
|
|||||
|
 | |
| |
| |
| |
| |
| |
|
Gene: DEF6 |
Gene summary for DEF6 |
| Gene information | Species | Human | Gene symbol | DEF6 | Gene ID | 50619 |
| Gene name | DEF6 guanine nucleotide exchange factor | |
| Gene Alias | IBP | |
| Cytomap | 6p21.31 | |
| Gene Type | protein-coding | GO ID | GO:0007154 | UniProtAcc | Q9H4E7 |
Top |
Malignant transformation analysis |
| Identification of the aberrant gene expression in precancerous and cancerous lesions by comparing the gene expression of stem-like cells in diseased tissues with normal stem cells |
| Entrez ID | Symbol | Replicates | Species | Organ | Tissue | Adj P-value | Log2FC | Malignancy |
| 50619 | DEF6 | P127T-E | Human | Esophagus | ESCC | 7.63e-12 | 2.17e-01 | 0.0826 |
| 50619 | DEF6 | P128T-E | Human | Esophagus | ESCC | 1.55e-13 | 4.40e-01 | 0.1241 |
| 50619 | DEF6 | P130T-E | Human | Esophagus | ESCC | 1.20e-58 | 1.13e+00 | 0.1676 |
| 50619 | DEF6 | C04 | Human | Oral cavity | OSCC | 4.18e-09 | 3.78e-01 | 0.2633 |
| 50619 | DEF6 | C21 | Human | Oral cavity | OSCC | 7.22e-30 | 8.66e-01 | 0.2678 |
| 50619 | DEF6 | C30 | Human | Oral cavity | OSCC | 6.72e-26 | 1.03e+00 | 0.3055 |
| 50619 | DEF6 | C38 | Human | Oral cavity | OSCC | 1.44e-06 | 8.64e-01 | 0.172 |
| 50619 | DEF6 | C43 | Human | Oral cavity | OSCC | 5.70e-19 | 2.45e-01 | 0.1704 |
| 50619 | DEF6 | C46 | Human | Oral cavity | OSCC | 6.20e-24 | 4.57e-01 | 0.1673 |
| 50619 | DEF6 | C51 | Human | Oral cavity | OSCC | 8.09e-07 | 4.85e-01 | 0.2674 |
| 50619 | DEF6 | C57 | Human | Oral cavity | OSCC | 3.59e-10 | 4.04e-01 | 0.1679 |
| 50619 | DEF6 | C06 | Human | Oral cavity | OSCC | 1.69e-02 | 8.39e-01 | 0.2699 |
| 50619 | DEF6 | C08 | Human | Oral cavity | OSCC | 1.70e-17 | 3.31e-01 | 0.1919 |
| 50619 | DEF6 | LN22 | Human | Oral cavity | OSCC | 1.92e-07 | 8.15e-01 | 0.1733 |
| 50619 | DEF6 | LN46 | Human | Oral cavity | OSCC | 2.25e-19 | 5.48e-01 | 0.1666 |
| 50619 | DEF6 | SYSMH1 | Human | Oral cavity | OSCC | 8.58e-03 | 3.44e-02 | 0.1127 |
| 50619 | DEF6 | SYSMH2 | Human | Oral cavity | OSCC | 4.10e-15 | 2.79e-01 | 0.2326 |
| 50619 | DEF6 | SYSMH3 | Human | Oral cavity | OSCC | 1.08e-19 | 4.33e-01 | 0.2442 |
| 50619 | DEF6 | SYSMH4 | Human | Oral cavity | OSCC | 3.79e-06 | 6.79e-02 | 0.1226 |
| 50619 | DEF6 | SYSMH5 | Human | Oral cavity | OSCC | 3.54e-05 | 1.14e-01 | 0.0647 |
| Page: 1 2 3 4 5 |
| Tissue | Expression Dynamics | Abbreviation |
| Esophagus | 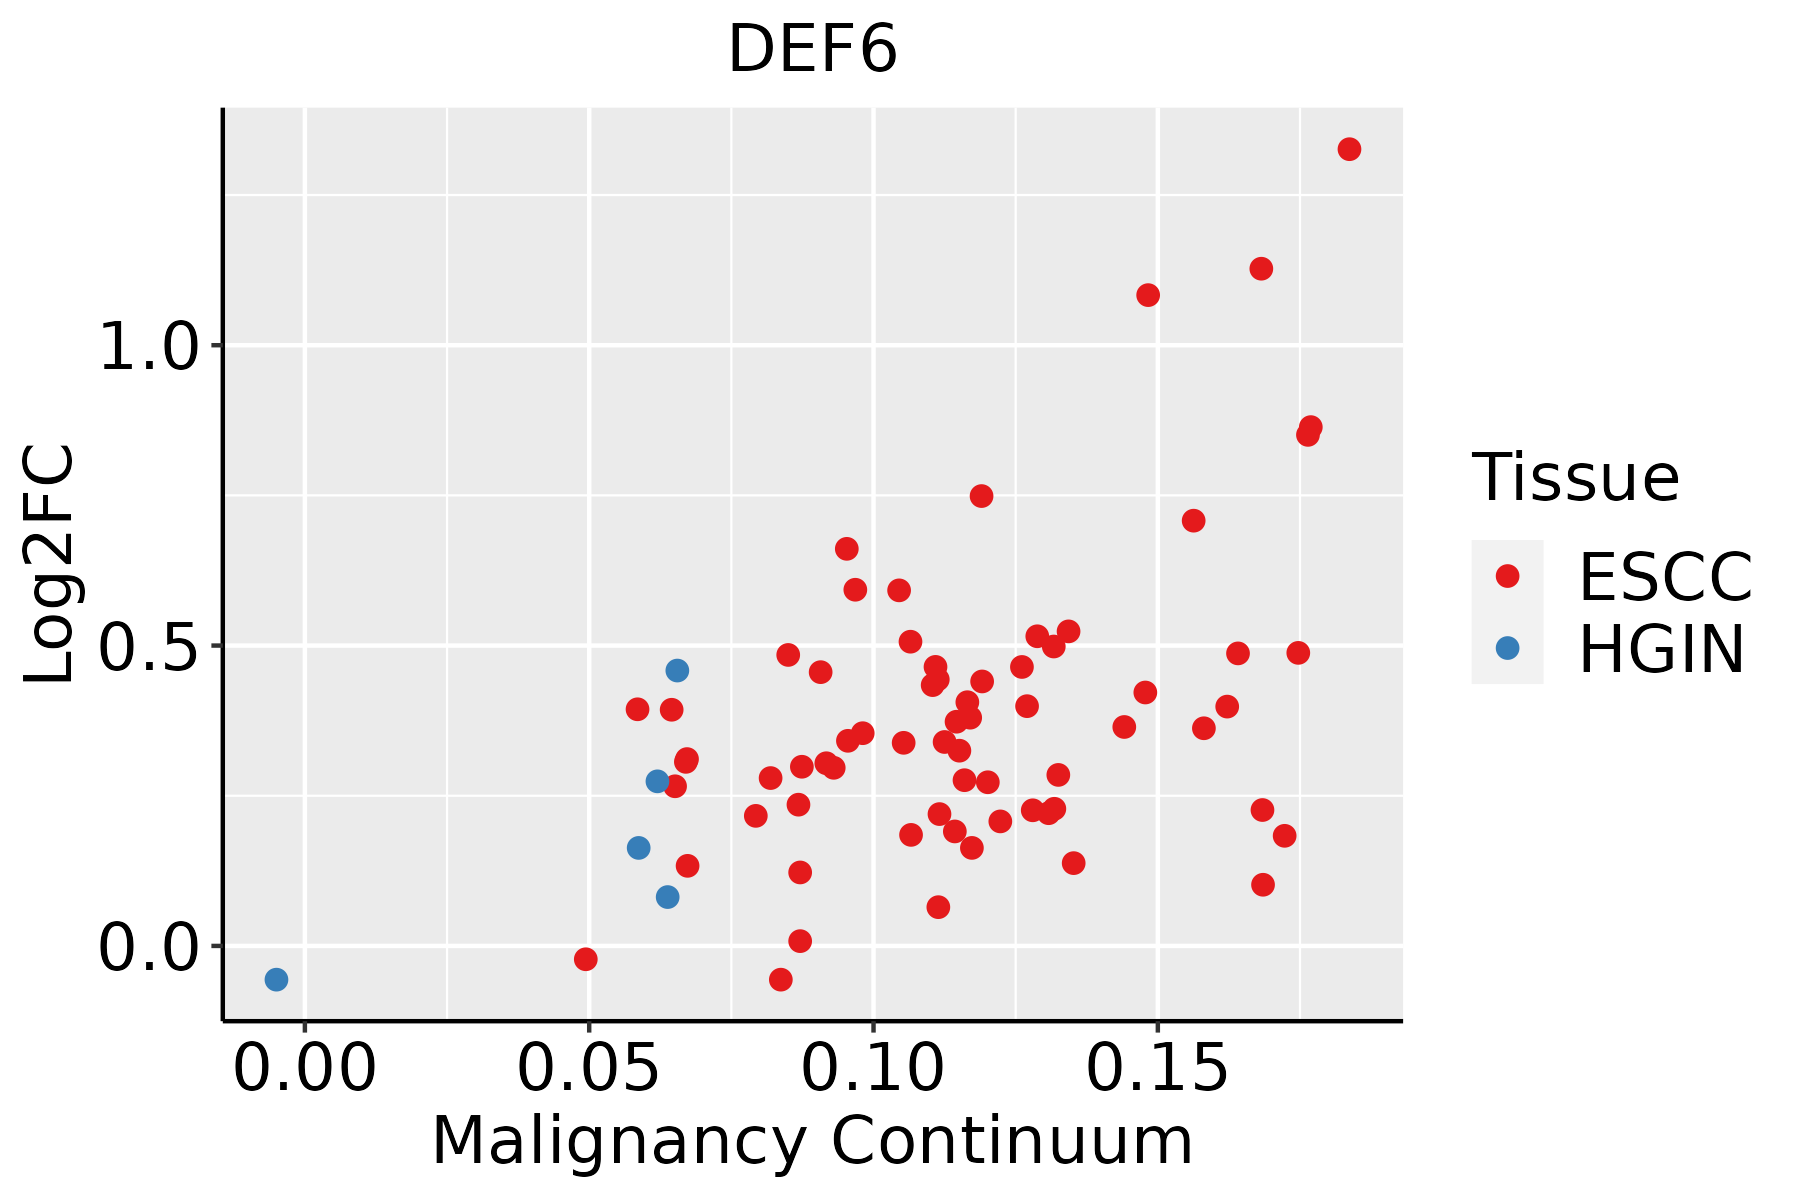 | ESCC: Esophageal squamous cell carcinoma |
| HGIN: High-grade intraepithelial neoplasias | ||
| LGIN: Low-grade intraepithelial neoplasias | ||
| Oral Cavity |  | EOLP: Erosive Oral lichen planus |
| LP: leukoplakia | ||
| NEOLP: Non-erosive oral lichen planus | ||
| OSCC: Oral squamous cell carcinoma | ||
| Skin | 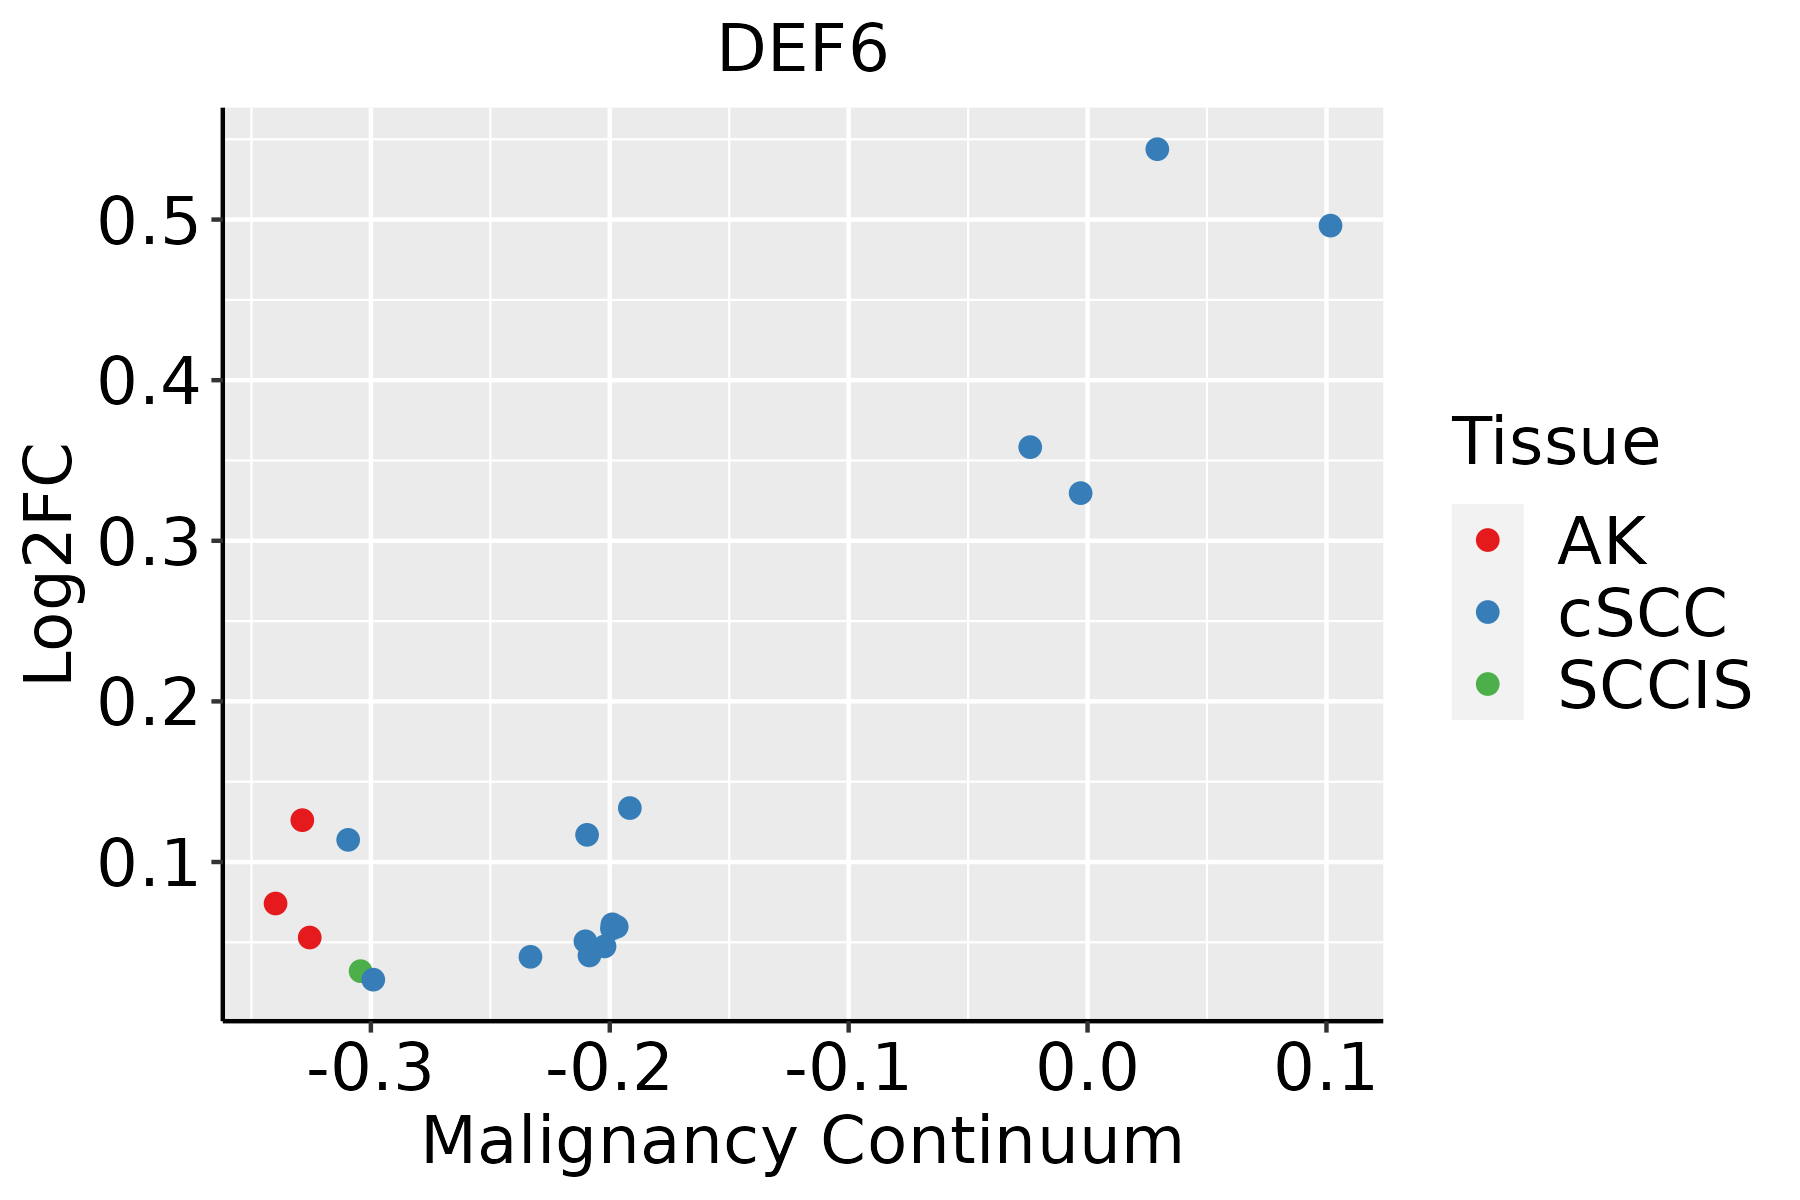 | AK: Actinic keratosis |
| cSCC: Cutaneous squamous cell carcinoma | ||
| SCCIS:squamous cell carcinoma in situ |
| ∗log2FC in expression of this searched gene in stem-like cells from each diseased tissue sample relative to stem-like cells in normal samples in each tissue plotted against the malignancy continuum. Samples are colored based on if they are from different disease stage. |
Top |
Malignant transformation related pathway analysis |
| Find out the enriched GO biological processes and KEGG pathways involved in transition from healthy to precancer to cancer |
| Tissue | Disease Stage | Enriched GO biological Processes |
| Colorectum | AD |  |
| Colorectum | SER |  |
| Colorectum | MSS |  |
| Colorectum | MSI-H |  |
| Colorectum | FAP |  |
| ∗Top 15 enriched GO BP terms are showed in the bar plot of each disease state in each tissue. Each row represents a significant GO biological process which is colored according to the -log10(p.adjust). |
| Page: 1 2 3 4 5 6 7 8 9 |
| GO ID | Tissue | Disease Stage | Description | Gene Ratio | Bg Ratio | pvalue | p.adjust | Count |
| GO:005105610 | Esophagus | ESCC | regulation of small GTPase mediated signal transduction | 157/8552 | 302/18723 | 1.55e-02 | 4.98e-02 | 157 |
| Page: 1 |
| Pathway ID | Tissue | Disease Stage | Description | Gene Ratio | Bg Ratio | pvalue | p.adjust | qvalue | Count |
| Page: 1 |
Top |
Cell-cell communication analysis |
| Identification of potential cell-cell interactions between two cell types and their ligand-receptor pairs for different disease states |
| Ligand | Receptor | LRpair | Pathway | Tissue | Disease Stage |
| Page: 1 |
Top |
Single-cell gene regulatory network inference analysis |
| Find out the significant the regulons (TFs) and the target genes of each regulon across cell types for different disease states |
| TF | Cell Type | Tissue | Disease Stage | Target Gene | RSS | Regulon Activity |
| ∗The dot plots of a searched regulon are shown for all cell subpopulations in each disease state of each tissue based on the regulon specific score inferred using pySCENIC and by calculating the average expression. |
| Page: 1 |
Top |
Somatic mutation of malignant transformation related genes |
| Annotation of somatic variants for genes involved in malignant transformation |
| Hugo Symbol | Variant Class | Variant Classification | dbSNP RS | HGVSc | HGVSp | HGVSp Short | SWISSPROT | BIOTYPE | SIFT | PolyPhen | Tumor Sample Barcode | Tissue | Histology | Sex | Age | Stage | Therapy Types | Drugs | Outcome |
| DEF6 | SNV | Missense_Mutation | c.232N>C | p.Asp78His | p.D78H | Q9H4E7 | protein_coding | deleterious(0) | probably_damaging(0.97) | TCGA-A8-A08R-01 | Breast | breast invasive carcinoma | Female | <65 | I/II | Unknown | Unknown | SD | |
| DEF6 | SNV | Missense_Mutation | novel | c.1453G>A | p.Glu485Lys | p.E485K | Q9H4E7 | protein_coding | tolerated(0.89) | benign(0.15) | TCGA-AN-A046-01 | Breast | breast invasive carcinoma | Female | >=65 | I/II | Unknown | Unknown | SD |
| DEF6 | SNV | Missense_Mutation | rs865793540 | c.1457N>A | p.Arg486Gln | p.R486Q | Q9H4E7 | protein_coding | tolerated(0.75) | benign(0) | TCGA-BH-A0HF-01 | Breast | breast invasive carcinoma | Female | >=65 | I/II | Hormone Therapy | arimidex | SD |
| DEF6 | deletion | Frame_Shift_Del | novel | c.213delN | p.Leu72SerfsTer26 | p.L72Sfs*26 | Q9H4E7 | protein_coding | TCGA-EW-A2FV-01 | Breast | breast invasive carcinoma | Female | <65 | III/IV | Chemotherapy | docetaxel | SD | ||
| DEF6 | deletion | Frame_Shift_Del | novel | c.745delN | p.Ser250ValfsTer34 | p.S250Vfs*34 | Q9H4E7 | protein_coding | TCGA-EW-A2FV-01 | Breast | breast invasive carcinoma | Female | <65 | III/IV | Chemotherapy | docetaxel | SD | ||
| DEF6 | SNV | Missense_Mutation | rs149842297 | c.359G>A | p.Arg120His | p.R120H | Q9H4E7 | protein_coding | tolerated(0.06) | benign(0.019) | TCGA-2W-A8YY-01 | Cervix | cervical & endocervical cancer | Female | <65 | I/II | Chemotherapy | cisplatin | CR |
| DEF6 | SNV | Missense_Mutation | novel | c.1555C>T | p.Arg519Trp | p.R519W | Q9H4E7 | protein_coding | deleterious(0) | probably_damaging(0.998) | TCGA-2W-A8YY-01 | Cervix | cervical & endocervical cancer | Female | <65 | I/II | Chemotherapy | cisplatin | CR |
| DEF6 | SNV | Missense_Mutation | novel | c.1249N>G | p.Lys417Glu | p.K417E | Q9H4E7 | protein_coding | deleterious(0.02) | probably_damaging(0.985) | TCGA-EA-A3HS-01 | Cervix | cervical & endocervical cancer | Female | <65 | I/II | Unknown | Unknown | SD |
| DEF6 | SNV | Missense_Mutation | c.1679N>A | p.Arg560His | p.R560H | Q9H4E7 | protein_coding | tolerated(0.09) | probably_damaging(0.98) | TCGA-EK-A2GZ-01 | Cervix | cervical & endocervical cancer | Female | <65 | III/IV | Unknown | Unknown | SD | |
| DEF6 | SNV | Missense_Mutation | c.677N>A | p.Arg226Gln | p.R226Q | Q9H4E7 | protein_coding | deleterious(0) | benign(0.278) | TCGA-LP-A5U2-01 | Cervix | cervical & endocervical cancer | Female | <65 | III/IV | Unknown | Unknown | SD |
| Page: 1 2 3 4 5 6 7 |
Top |
Related drugs of malignant transformation related genes |
| Identification of chemicals and drugs interact with genes involved in malignant transfromation |
| (DGIdb 4.0) |
| Entrez ID | Symbol | Category | Interaction Types | Drug Claim Name | Drug Name | PMIDs |
| Page: 1 |

Copyright 2023-Present -The University of Texas Health Science Center at Houston |