
|
|||||
|
 | |
| |
| |
| |
| |
| |
|
Gene: DDX55 |
Gene summary for DDX55 |
| Gene information | Species | Human | Gene symbol | DDX55 | Gene ID | 57696 |
| Gene name | DEAD-box helicase 55 | |
| Gene Alias | DDX55 | |
| Cytomap | 12q24.31 | |
| Gene Type | protein-coding | GO ID | GO:0005575 | UniProtAcc | A0A024RBS0 |
Top |
Malignant transformation analysis |
| Identification of the aberrant gene expression in precancerous and cancerous lesions by comparing the gene expression of stem-like cells in diseased tissues with normal stem cells |
| Entrez ID | Symbol | Replicates | Species | Organ | Tissue | Adj P-value | Log2FC | Malignancy |
| 57696 | DDX55 | HCC2 | Human | Liver | HCC | 1.20e-19 | 3.35e+00 | 0.5341 |
| 57696 | DDX55 | S014 | Human | Liver | HCC | 1.79e-19 | 5.71e-01 | 0.2254 |
| 57696 | DDX55 | S015 | Human | Liver | HCC | 1.08e-12 | 5.45e-01 | 0.2375 |
| 57696 | DDX55 | S016 | Human | Liver | HCC | 2.25e-17 | 5.36e-01 | 0.2243 |
| 57696 | DDX55 | S027 | Human | Liver | HCC | 2.39e-05 | 4.09e-01 | 0.2446 |
| 57696 | DDX55 | S028 | Human | Liver | HCC | 5.96e-11 | 4.59e-01 | 0.2503 |
| 57696 | DDX55 | S029 | Human | Liver | HCC | 9.02e-18 | 5.95e-01 | 0.2581 |
| 57696 | DDX55 | C04 | Human | Oral cavity | OSCC | 4.49e-14 | 7.05e-01 | 0.2633 |
| 57696 | DDX55 | C21 | Human | Oral cavity | OSCC | 6.83e-26 | 7.37e-01 | 0.2678 |
| 57696 | DDX55 | C30 | Human | Oral cavity | OSCC | 4.06e-13 | 6.55e-01 | 0.3055 |
| 57696 | DDX55 | C38 | Human | Oral cavity | OSCC | 1.74e-04 | 4.07e-01 | 0.172 |
| 57696 | DDX55 | C43 | Human | Oral cavity | OSCC | 5.92e-13 | 3.30e-01 | 0.1704 |
| 57696 | DDX55 | C46 | Human | Oral cavity | OSCC | 4.02e-03 | 2.14e-01 | 0.1673 |
| 57696 | DDX55 | C51 | Human | Oral cavity | OSCC | 8.09e-05 | 2.48e-01 | 0.2674 |
| 57696 | DDX55 | C08 | Human | Oral cavity | OSCC | 1.42e-13 | 3.30e-01 | 0.1919 |
| 57696 | DDX55 | LP15 | Human | Oral cavity | LP | 1.54e-03 | 7.20e-01 | 0.2174 |
| 57696 | DDX55 | SYSMH1 | Human | Oral cavity | OSCC | 1.32e-04 | 1.64e-01 | 0.1127 |
| 57696 | DDX55 | SYSMH2 | Human | Oral cavity | OSCC | 2.08e-16 | 4.49e-01 | 0.2326 |
| 57696 | DDX55 | SYSMH3 | Human | Oral cavity | OSCC | 4.79e-31 | 6.00e-01 | 0.2442 |
| 57696 | DDX55 | SYSMH5 | Human | Oral cavity | OSCC | 2.70e-02 | 1.34e-01 | 0.0647 |
| Page: 1 2 3 4 |
| Tissue | Expression Dynamics | Abbreviation |
| Esophagus | 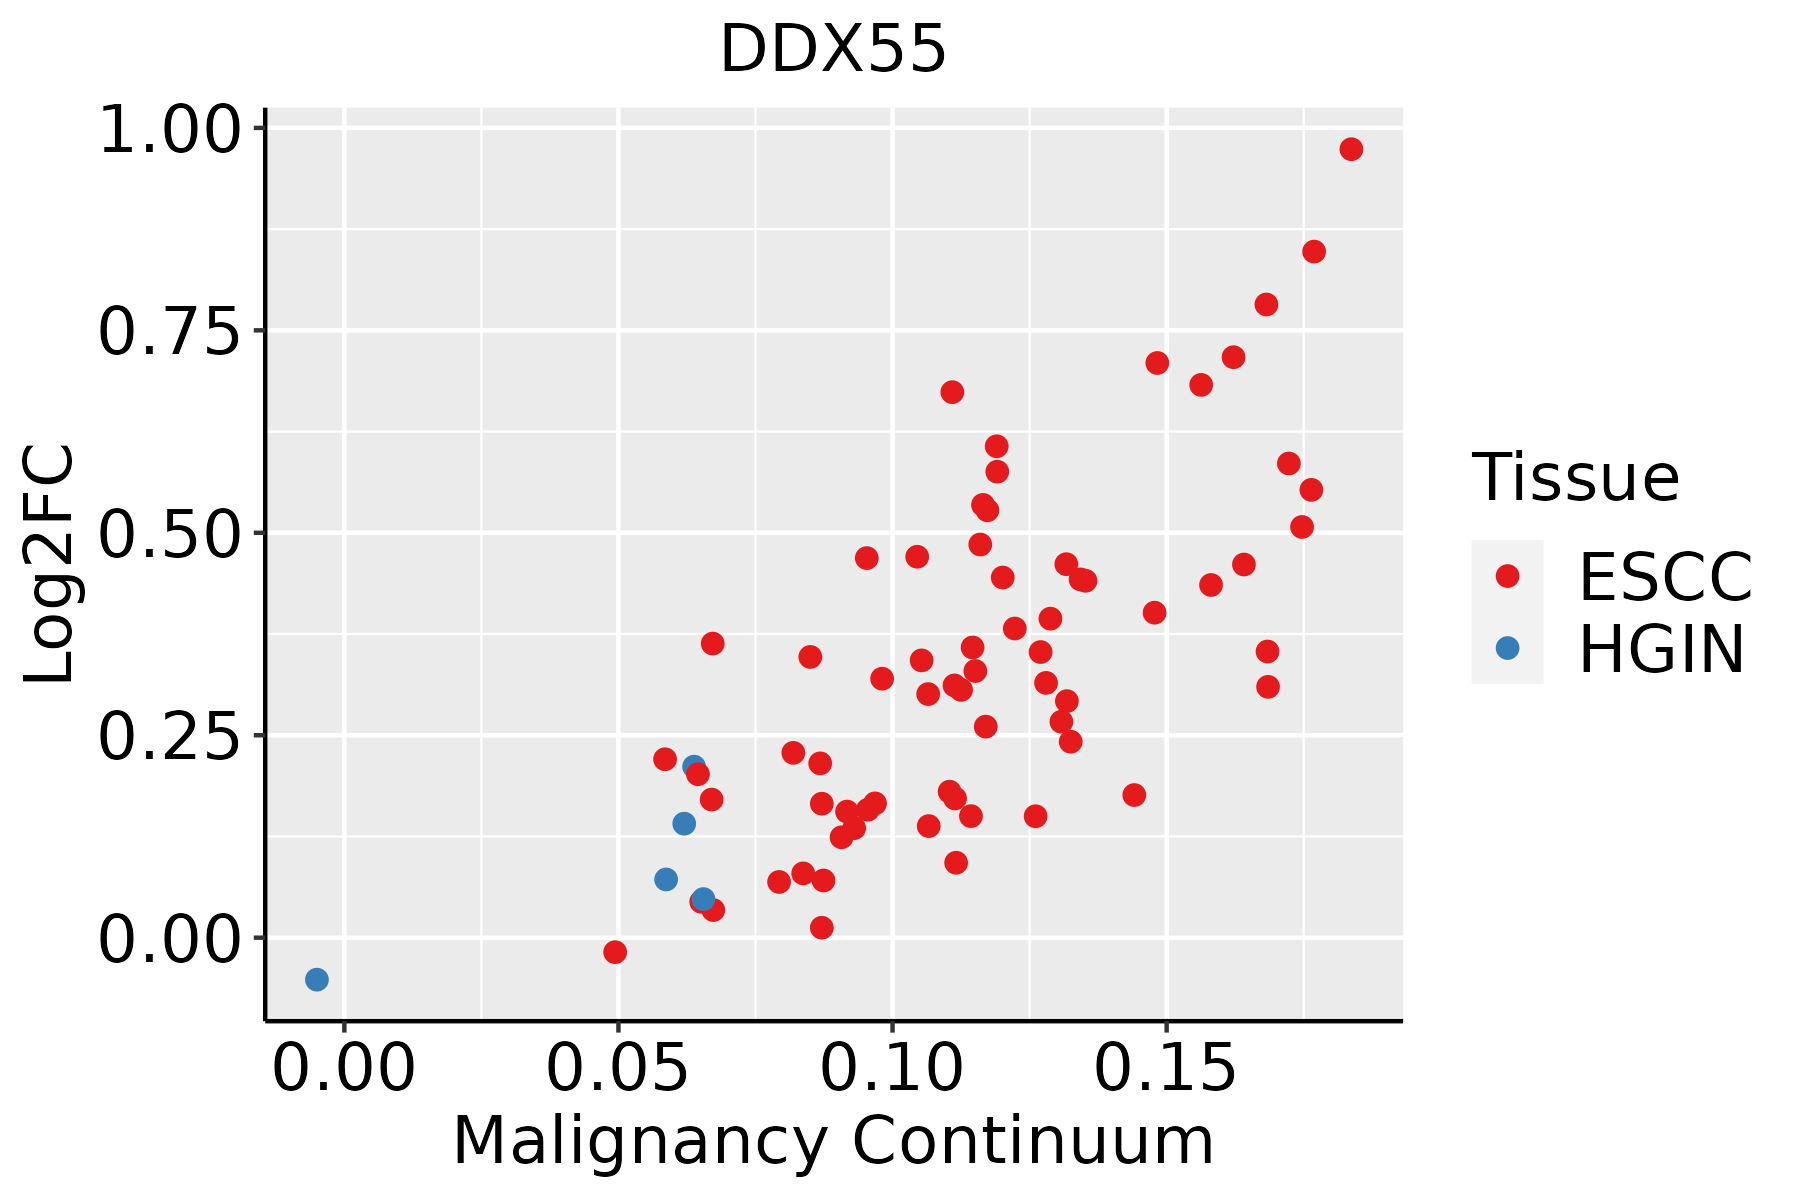 | ESCC: Esophageal squamous cell carcinoma |
| HGIN: High-grade intraepithelial neoplasias | ||
| LGIN: Low-grade intraepithelial neoplasias | ||
| Liver |  | HCC: Hepatocellular carcinoma |
| NAFLD: Non-alcoholic fatty liver disease | ||
| Oral Cavity | 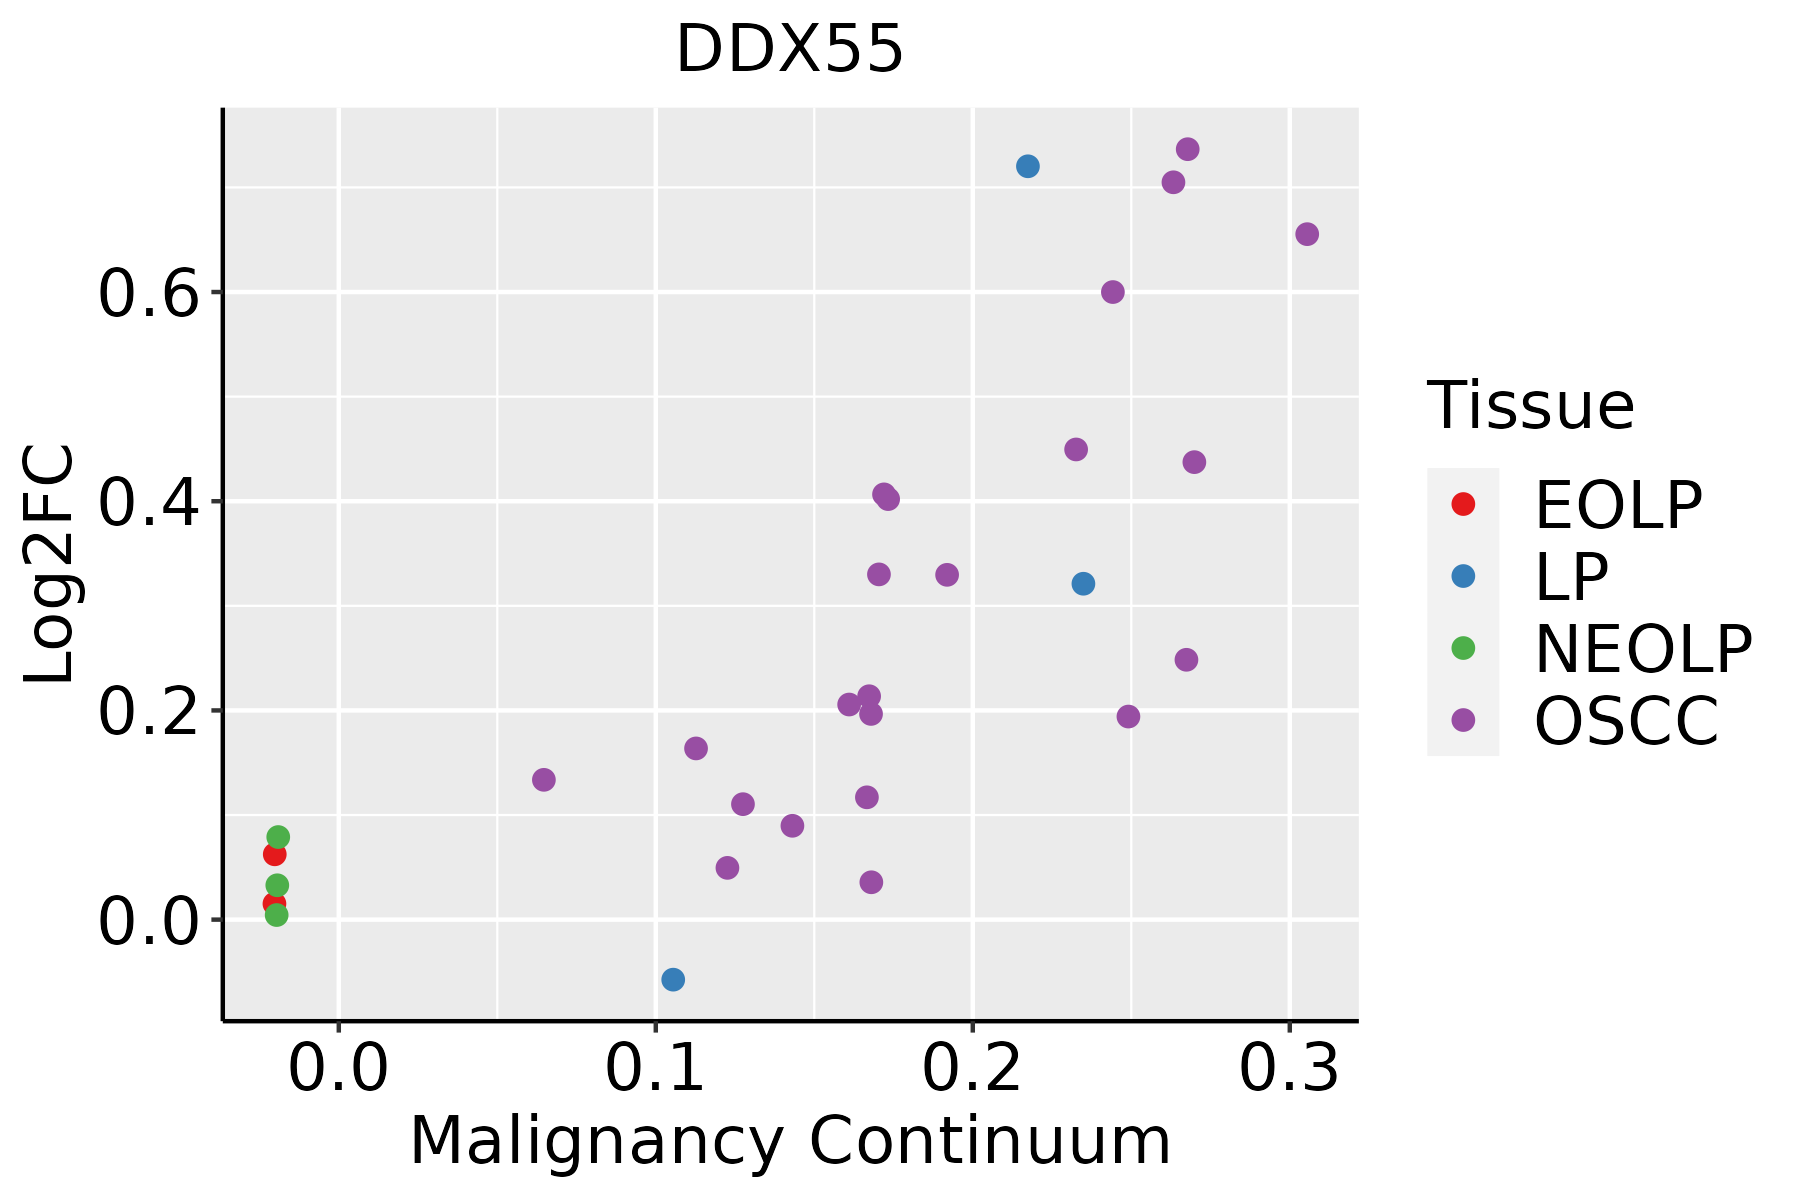 | EOLP: Erosive Oral lichen planus |
| LP: leukoplakia | ||
| NEOLP: Non-erosive oral lichen planus | ||
| OSCC: Oral squamous cell carcinoma |
| ∗log2FC in expression of this searched gene in stem-like cells from each diseased tissue sample relative to stem-like cells in normal samples in each tissue plotted against the malignancy continuum. Samples are colored based on if they are from different disease stage. |
Top |
Malignant transformation related pathway analysis |
| Find out the enriched GO biological processes and KEGG pathways involved in transition from healthy to precancer to cancer |
| Tissue | Disease Stage | Enriched GO biological Processes |
| Colorectum | AD |  |
| Colorectum | SER |  |
| Colorectum | MSS |  |
| Colorectum | MSI-H |  |
| Colorectum | FAP |  |
| ∗Top 15 enriched GO BP terms are showed in the bar plot of each disease state in each tissue. Each row represents a significant GO biological process which is colored according to the -log10(p.adjust). |
| Page: 1 2 3 4 5 6 7 8 9 |
| GO ID | Tissue | Disease Stage | Description | Gene Ratio | Bg Ratio | pvalue | p.adjust | Count |
| Page: 1 |
| Pathway ID | Tissue | Disease Stage | Description | Gene Ratio | Bg Ratio | pvalue | p.adjust | qvalue | Count |
| Page: 1 |
Top |
Cell-cell communication analysis |
| Identification of potential cell-cell interactions between two cell types and their ligand-receptor pairs for different disease states |
| Ligand | Receptor | LRpair | Pathway | Tissue | Disease Stage |
| Page: 1 |
Top |
Single-cell gene regulatory network inference analysis |
| Find out the significant the regulons (TFs) and the target genes of each regulon across cell types for different disease states |
| TF | Cell Type | Tissue | Disease Stage | Target Gene | RSS | Regulon Activity |
| ∗The dot plots of a searched regulon are shown for all cell subpopulations in each disease state of each tissue based on the regulon specific score inferred using pySCENIC and by calculating the average expression. |
| Page: 1 |
Top |
Somatic mutation of malignant transformation related genes |
| Annotation of somatic variants for genes involved in malignant transformation |
| Hugo Symbol | Variant Class | Variant Classification | dbSNP RS | HGVSc | HGVSp | HGVSp Short | SWISSPROT | BIOTYPE | SIFT | PolyPhen | Tumor Sample Barcode | Tissue | Histology | Sex | Age | Stage | Therapy Types | Drugs | Outcome |
| DDX55 | SNV | Missense_Mutation | c.633N>G | p.Asn211Lys | p.N211K | Q8NHQ9 | protein_coding | tolerated(0.72) | benign(0) | TCGA-AN-A04D-01 | Breast | breast invasive carcinoma | Female | <65 | I/II | Unknown | Unknown | SD | |
| DDX55 | SNV | Missense_Mutation | c.1255G>C | p.Glu419Gln | p.E419Q | Q8NHQ9 | protein_coding | deleterious(0.01) | possibly_damaging(0.685) | TCGA-AO-A128-01 | Breast | breast invasive carcinoma | Female | <65 | I/II | Chemotherapy | doxorubicin | SD | |
| DDX55 | SNV | Missense_Mutation | c.1244G>C | p.Arg415Thr | p.R415T | Q8NHQ9 | protein_coding | deleterious(0) | possibly_damaging(0.899) | TCGA-BH-A0BW-01 | Breast | breast invasive carcinoma | Female | >=65 | I/II | Chemotherapy | adriamycin | CR | |
| DDX55 | SNV | Missense_Mutation | c.577N>G | p.Pro193Ala | p.P193A | Q8NHQ9 | protein_coding | deleterious(0) | probably_damaging(0.989) | TCGA-D8-A1JE-01 | Breast | breast invasive carcinoma | Female | <65 | I/II | Chemotherapy | adriamicin | SD | |
| DDX55 | SNV | Missense_Mutation | c.976G>A | p.Asp326Asn | p.D326N | Q8NHQ9 | protein_coding | deleterious(0) | probably_damaging(0.994) | TCGA-E2-A10C-01 | Breast | breast invasive carcinoma | Female | <65 | I/II | Chemotherapy | cytoxan | SD | |
| DDX55 | deletion | Frame_Shift_Del | c.1591_1592delNN | p.Lys531GlufsTer5 | p.K531Efs*5 | Q8NHQ9 | protein_coding | TCGA-A2-A0D0-01 | Breast | breast invasive carcinoma | Female | <65 | I/II | Chemotherapy | cytoxan | SD | |||
| DDX55 | insertion | Frame_Shift_Ins | novel | c.1033_1034insATACAGTTTTGGTTTTCAAATGG | p.Pro345HisfsTer58 | p.P345Hfs*58 | Q8NHQ9 | protein_coding | TCGA-A7-A0CE-01 | Breast | breast invasive carcinoma | Female | <65 | I/II | Chemotherapy | adriamycin | SD | ||
| DDX55 | insertion | Nonsense_Mutation | novel | c.911_912insTTAAAACCCCCAAGGAC | p.Lys304AsnfsTer2 | p.K304Nfs*2 | Q8NHQ9 | protein_coding | TCGA-A8-A07F-01 | Breast | breast invasive carcinoma | Female | >=65 | I/II | Hormone Therapy | tamoxiphen | SD | ||
| DDX55 | insertion | Nonsense_Mutation | novel | c.1030_1031insGCTTGTAGTTAGGTTGCGTCTGCTGCAGCTATTGCTC | p.Asp344GlyfsTer3 | p.D344Gfs*3 | Q8NHQ9 | protein_coding | TCGA-AN-A0AR-01 | Breast | breast invasive carcinoma | Female | <65 | I/II | Unknown | Unknown | SD | ||
| DDX55 | deletion | Frame_Shift_Del | c.1509_1510delNN | p.Lys506AsnfsTer4 | p.K506Nfs*4 | Q8NHQ9 | protein_coding | TCGA-AO-A1KR-01 | Breast | breast invasive carcinoma | Female | <65 | I/II | Chemotherapy | cyclophosphamide | SD |
| Page: 1 2 3 4 5 6 |
Top |
Related drugs of malignant transformation related genes |
| Identification of chemicals and drugs interact with genes involved in malignant transfromation |
| (DGIdb 4.0) |
| Entrez ID | Symbol | Category | Interaction Types | Drug Claim Name | Drug Name | PMIDs |
| Page: 1 |

Copyright 2023-Present -The University of Texas Health Science Center at Houston |