
|
|||||
|
 | |
| |
| |
| |
| |
| |
|
Gene: DDX19B |
Gene summary for DDX19B |
| Gene information | Species | Human | Gene symbol | DDX19B | Gene ID | 11269 |
| Gene name | DEAD-box helicase 19B | |
| Gene Alias | DBP5 | |
| Cytomap | 16q22.1 | |
| Gene Type | protein-coding | GO ID | GO:0006403 | UniProtAcc | A0A024QZ90 |
Top |
Malignant transformation analysis |
| Identification of the aberrant gene expression in precancerous and cancerous lesions by comparing the gene expression of stem-like cells in diseased tissues with normal stem cells |
| Entrez ID | Symbol | Replicates | Species | Organ | Tissue | Adj P-value | Log2FC | Malignancy |
| 11269 | DDX19B | C43 | Human | Oral cavity | OSCC | 3.43e-15 | 3.46e-01 | 0.1704 |
| 11269 | DDX19B | C46 | Human | Oral cavity | OSCC | 9.70e-15 | 4.21e-01 | 0.1673 |
| 11269 | DDX19B | C51 | Human | Oral cavity | OSCC | 2.87e-06 | 2.37e-01 | 0.2674 |
| 11269 | DDX19B | C57 | Human | Oral cavity | OSCC | 1.02e-02 | 1.48e-01 | 0.1679 |
| 11269 | DDX19B | C06 | Human | Oral cavity | OSCC | 1.01e-12 | 1.01e+00 | 0.2699 |
| 11269 | DDX19B | C08 | Human | Oral cavity | OSCC | 7.48e-10 | 3.18e-01 | 0.1919 |
| 11269 | DDX19B | C09 | Human | Oral cavity | OSCC | 1.43e-05 | 1.81e-01 | 0.1431 |
| 11269 | DDX19B | LN22 | Human | Oral cavity | OSCC | 3.86e-02 | 3.17e-01 | 0.1733 |
| 11269 | DDX19B | LN46 | Human | Oral cavity | OSCC | 4.87e-07 | 3.60e-01 | 0.1666 |
| 11269 | DDX19B | LP15 | Human | Oral cavity | LP | 3.00e-03 | 4.62e-01 | 0.2174 |
| 11269 | DDX19B | LP17 | Human | Oral cavity | LP | 2.71e-02 | 4.33e-01 | 0.2349 |
| 11269 | DDX19B | SYSMH1 | Human | Oral cavity | OSCC | 2.17e-07 | 1.26e-01 | 0.1127 |
| 11269 | DDX19B | SYSMH2 | Human | Oral cavity | OSCC | 1.74e-11 | 3.35e-01 | 0.2326 |
| 11269 | DDX19B | SYSMH3 | Human | Oral cavity | OSCC | 1.17e-07 | 1.57e-01 | 0.2442 |
| 11269 | DDX19B | SYSMH4 | Human | Oral cavity | OSCC | 3.07e-02 | 7.04e-02 | 0.1226 |
| 11269 | DDX19B | SYSMH5 | Human | Oral cavity | OSCC | 1.38e-02 | 1.43e-01 | 0.0647 |
| 11269 | DDX19B | P1_cSCC | Human | Skin | cSCC | 1.80e-22 | 6.97e-01 | 0.0292 |
| 11269 | DDX19B | P2_cSCC | Human | Skin | cSCC | 1.50e-06 | 3.16e-01 | -0.024 |
| 11269 | DDX19B | P4_cSCC | Human | Skin | cSCC | 1.27e-13 | 3.57e-01 | -0.00290000000000005 |
| 11269 | DDX19B | P10_cSCC | Human | Skin | cSCC | 1.33e-07 | 3.26e-01 | 0.1017 |
| Page: 1 2 3 4 |
| Tissue | Expression Dynamics | Abbreviation |
| Esophagus |  | ESCC: Esophageal squamous cell carcinoma |
| HGIN: High-grade intraepithelial neoplasias | ||
| LGIN: Low-grade intraepithelial neoplasias | ||
| Oral Cavity | 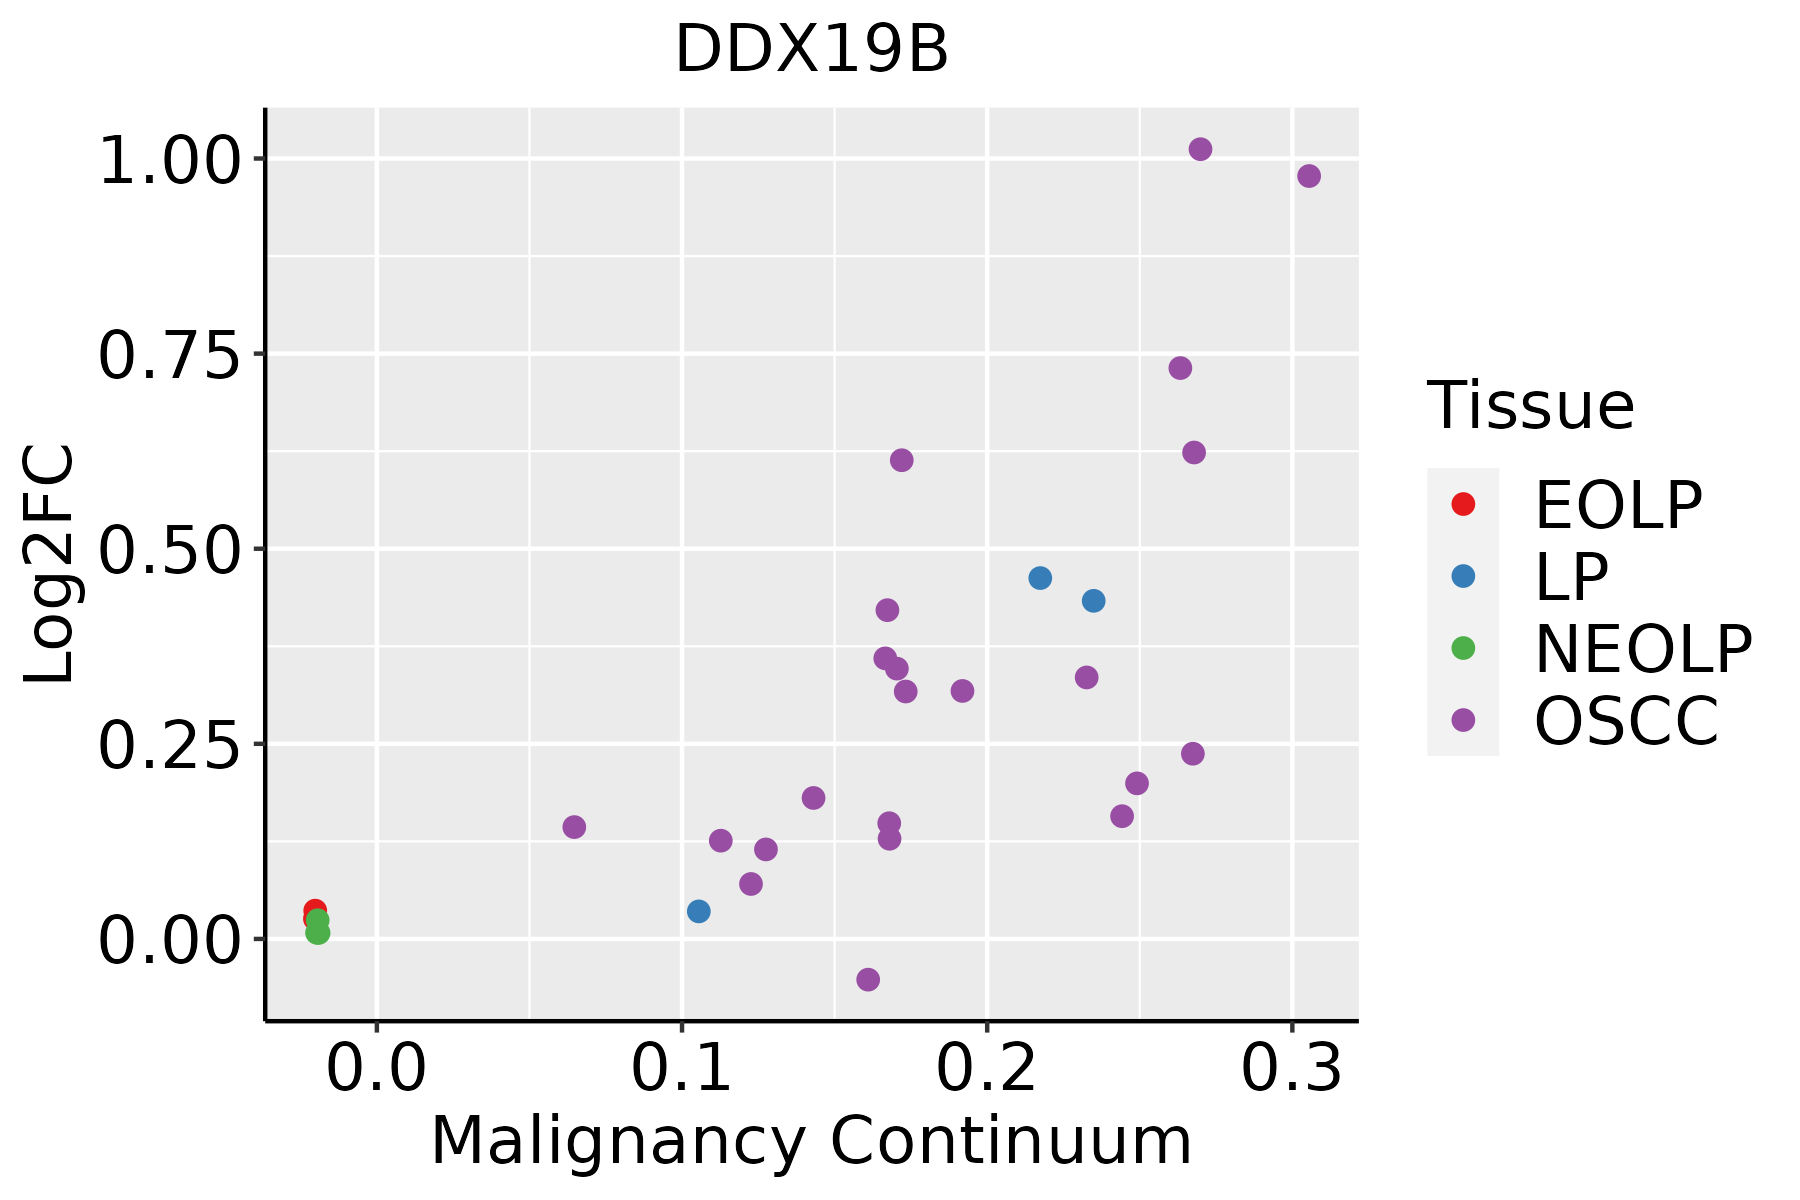 | EOLP: Erosive Oral lichen planus |
| LP: leukoplakia | ||
| NEOLP: Non-erosive oral lichen planus | ||
| OSCC: Oral squamous cell carcinoma | ||
| Skin | 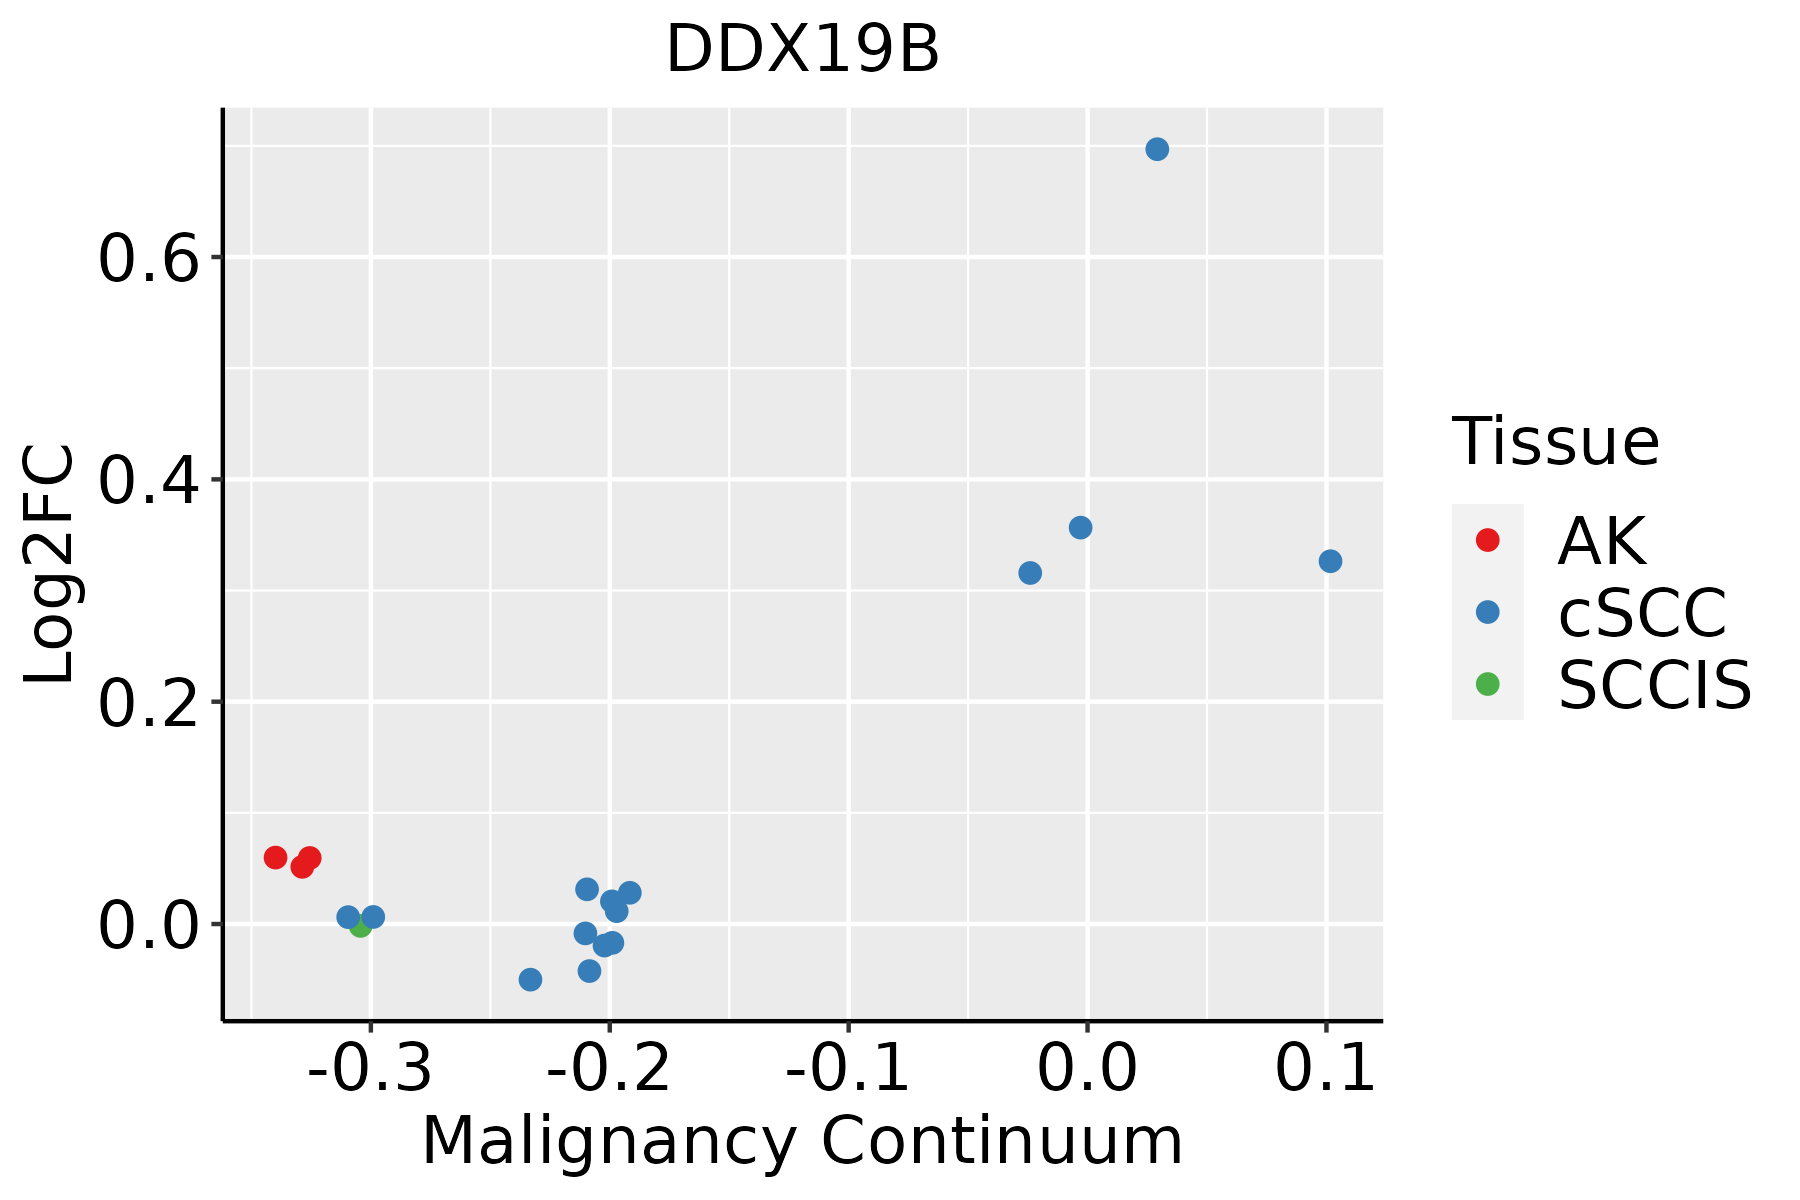 | AK: Actinic keratosis |
| cSCC: Cutaneous squamous cell carcinoma | ||
| SCCIS:squamous cell carcinoma in situ |
| ∗log2FC in expression of this searched gene in stem-like cells from each diseased tissue sample relative to stem-like cells in normal samples in each tissue plotted against the malignancy continuum. Samples are colored based on if they are from different disease stage. |
Top |
Malignant transformation related pathway analysis |
| Find out the enriched GO biological processes and KEGG pathways involved in transition from healthy to precancer to cancer |
| Tissue | Disease Stage | Enriched GO biological Processes |
| Colorectum | AD |  |
| Colorectum | SER |  |
| Colorectum | MSS |  |
| Colorectum | MSI-H |  |
| Colorectum | FAP |  |
| ∗Top 15 enriched GO BP terms are showed in the bar plot of each disease state in each tissue. Each row represents a significant GO biological process which is colored according to the -log10(p.adjust). |
| Page: 1 2 3 4 5 6 7 8 9 |
| GO ID | Tissue | Disease Stage | Description | Gene Ratio | Bg Ratio | pvalue | p.adjust | Count |
| GO:0006913110 | Esophagus | ESCC | nucleocytoplasmic transport | 230/8552 | 301/18723 | 6.04e-28 | 2.02e-25 | 230 |
| GO:0051169110 | Esophagus | ESCC | nuclear transport | 230/8552 | 301/18723 | 6.04e-28 | 2.02e-25 | 230 |
| GO:0006403110 | Esophagus | ESCC | RNA localization | 166/8552 | 201/18723 | 1.95e-27 | 6.18e-25 | 166 |
| GO:005123617 | Esophagus | ESCC | establishment of RNA localization | 134/8552 | 166/18723 | 1.23e-20 | 1.81e-18 | 134 |
| GO:0051168110 | Esophagus | ESCC | nuclear export | 126/8552 | 154/18723 | 1.88e-20 | 2.65e-18 | 126 |
| GO:005102815 | Esophagus | ESCC | mRNA transport | 110/8552 | 130/18723 | 2.76e-20 | 3.80e-18 | 110 |
| GO:005065717 | Esophagus | ESCC | nucleic acid transport | 131/8552 | 163/18723 | 6.94e-20 | 8.46e-18 | 131 |
| GO:005065817 | Esophagus | ESCC | RNA transport | 131/8552 | 163/18723 | 6.94e-20 | 8.46e-18 | 131 |
| GO:001593117 | Esophagus | ESCC | nucleobase-containing compound transport | 162/8552 | 222/18723 | 9.87e-17 | 7.93e-15 | 162 |
| GO:007116612 | Esophagus | ESCC | ribonucleoprotein complex localization | 66/8552 | 77/18723 | 2.94e-13 | 1.38e-11 | 66 |
| GO:007142612 | Esophagus | ESCC | ribonucleoprotein complex export from nucleus | 65/8552 | 76/18723 | 5.56e-13 | 2.50e-11 | 65 |
| GO:000640512 | Esophagus | ESCC | RNA export from nucleus | 68/8552 | 84/18723 | 2.99e-11 | 1.01e-09 | 68 |
| GO:00064064 | Esophagus | ESCC | mRNA export from nucleus | 51/8552 | 59/18723 | 7.98e-11 | 2.47e-09 | 51 |
| GO:00714274 | Esophagus | ESCC | mRNA-containing ribonucleoprotein complex export from nucleus | 51/8552 | 59/18723 | 7.98e-11 | 2.47e-09 | 51 |
| GO:003150314 | Esophagus | ESCC | protein-containing complex localization | 139/8552 | 220/18723 | 1.14e-07 | 1.85e-06 | 139 |
| GO:000640318 | Oral cavity | OSCC | RNA localization | 150/7305 | 201/18723 | 6.90e-25 | 1.98e-22 | 150 |
| GO:000691317 | Oral cavity | OSCC | nucleocytoplasmic transport | 204/7305 | 301/18723 | 2.65e-24 | 6.98e-22 | 204 |
| GO:005116917 | Oral cavity | OSCC | nuclear transport | 204/7305 | 301/18723 | 2.65e-24 | 6.98e-22 | 204 |
| GO:00510287 | Oral cavity | OSCC | mRNA transport | 101/7305 | 130/18723 | 2.19e-19 | 3.15e-17 | 101 |
| GO:005065714 | Oral cavity | OSCC | nucleic acid transport | 120/7305 | 163/18723 | 2.31e-19 | 3.18e-17 | 120 |
| Page: 1 2 3 |
| Pathway ID | Tissue | Disease Stage | Description | Gene Ratio | Bg Ratio | pvalue | p.adjust | qvalue | Count |
| hsa0301321 | Esophagus | ESCC | Nucleocytoplasmic transport | 89/4205 | 108/8465 | 1.20e-12 | 2.37e-11 | 1.21e-11 | 89 |
| hsa0301524 | Esophagus | ESCC | mRNA surveillance pathway | 72/4205 | 97/8465 | 6.12e-07 | 4.10e-06 | 2.10e-06 | 72 |
| hsa0301331 | Esophagus | ESCC | Nucleocytoplasmic transport | 89/4205 | 108/8465 | 1.20e-12 | 2.37e-11 | 1.21e-11 | 89 |
| hsa0301534 | Esophagus | ESCC | mRNA surveillance pathway | 72/4205 | 97/8465 | 6.12e-07 | 4.10e-06 | 2.10e-06 | 72 |
| hsa030136 | Oral cavity | OSCC | Nucleocytoplasmic transport | 82/3704 | 108/8465 | 7.93e-12 | 1.33e-10 | 6.77e-11 | 82 |
| hsa030158 | Oral cavity | OSCC | mRNA surveillance pathway | 75/3704 | 97/8465 | 1.30e-11 | 2.01e-10 | 1.02e-10 | 75 |
| hsa0301311 | Oral cavity | OSCC | Nucleocytoplasmic transport | 82/3704 | 108/8465 | 7.93e-12 | 1.33e-10 | 6.77e-11 | 82 |
| hsa0301513 | Oral cavity | OSCC | mRNA surveillance pathway | 75/3704 | 97/8465 | 1.30e-11 | 2.01e-10 | 1.02e-10 | 75 |
| hsa0301523 | Oral cavity | LP | mRNA surveillance pathway | 50/2418 | 97/8465 | 1.39e-06 | 1.50e-05 | 9.66e-06 | 50 |
| hsa030132 | Oral cavity | LP | Nucleocytoplasmic transport | 53/2418 | 108/8465 | 4.68e-06 | 4.10e-05 | 2.64e-05 | 53 |
| hsa0301533 | Oral cavity | LP | mRNA surveillance pathway | 50/2418 | 97/8465 | 1.39e-06 | 1.50e-05 | 9.66e-06 | 50 |
| hsa030133 | Oral cavity | LP | Nucleocytoplasmic transport | 53/2418 | 108/8465 | 4.68e-06 | 4.10e-05 | 2.64e-05 | 53 |
| Page: 1 |
Top |
Cell-cell communication analysis |
| Identification of potential cell-cell interactions between two cell types and their ligand-receptor pairs for different disease states |
| Ligand | Receptor | LRpair | Pathway | Tissue | Disease Stage |
| Page: 1 |
Top |
Single-cell gene regulatory network inference analysis |
| Find out the significant the regulons (TFs) and the target genes of each regulon across cell types for different disease states |
| TF | Cell Type | Tissue | Disease Stage | Target Gene | RSS | Regulon Activity |
| ∗The dot plots of a searched regulon are shown for all cell subpopulations in each disease state of each tissue based on the regulon specific score inferred using pySCENIC and by calculating the average expression. |
| Page: 1 |
Top |
Somatic mutation of malignant transformation related genes |
| Annotation of somatic variants for genes involved in malignant transformation |
| Hugo Symbol | Variant Class | Variant Classification | dbSNP RS | HGVSc | HGVSp | HGVSp Short | SWISSPROT | BIOTYPE | SIFT | PolyPhen | Tumor Sample Barcode | Tissue | Histology | Sex | Age | Stage | Therapy Types | Drugs | Outcome |
| DDX19B | SNV | Missense_Mutation | c.499T>C | p.Cys167Arg | p.C167R | Q9UMR2 | protein_coding | deleterious(0.03) | probably_damaging(0.935) | TCGA-BH-A1FU-01 | Breast | breast invasive carcinoma | Female | <65 | I/II | Unknown | Unknown | PD | |
| DDX19B | SNV | Missense_Mutation | c.727G>A | p.Glu243Lys | p.E243K | Q9UMR2 | protein_coding | deleterious(0) | probably_damaging(0.997) | TCGA-EK-A3GK-01 | Cervix | cervical & endocervical cancer | Female | <65 | I/II | Unknown | Unknown | SD | |
| DDX19B | SNV | Missense_Mutation | novel | c.562N>A | p.Phe188Ile | p.F188I | Q9UMR2 | protein_coding | deleterious(0) | possibly_damaging(0.768) | TCGA-AA-A010-01 | Colorectum | colon adenocarcinoma | Female | <65 | I/II | Chemotherapy | folinic | CR |
| DDX19B | SNV | Missense_Mutation | novel | c.396N>T | p.Gln132His | p.Q132H | Q9UMR2 | protein_coding | deleterious(0.02) | probably_damaging(0.968) | TCGA-AZ-4315-01 | Colorectum | colon adenocarcinoma | Male | <65 | I/II | Unknown | Unknown | SD |
| DDX19B | SNV | Missense_Mutation | novel | c.396G>T | p.Gln132His | p.Q132H | Q9UMR2 | protein_coding | deleterious(0.02) | probably_damaging(0.968) | TCGA-CA-6717-01 | Colorectum | colon adenocarcinoma | Male | <65 | I/II | Chemotherapy | oxaliplatin | CR |
| DDX19B | insertion | Frame_Shift_Ins | novel | c.1033dupA | p.Thr345AsnfsTer3 | p.T345Nfs*3 | Q9UMR2 | protein_coding | TCGA-G4-6628-01 | Colorectum | colon adenocarcinoma | Male | >=65 | I/II | Unknown | Unknown | SD | ||
| DDX19B | SNV | Missense_Mutation | novel | c.1405N>A | p.Asp469Asn | p.D469N | Q9UMR2 | protein_coding | tolerated(0.08) | benign(0.005) | TCGA-A5-A0G2-01 | Endometrium | uterine corpus endometrioid carcinoma | Female | <65 | III/IV | Unknown | Unknown | SD |
| DDX19B | SNV | Missense_Mutation | novel | c.1405N>T | p.Asp469Tyr | p.D469Y | Q9UMR2 | protein_coding | deleterious(0.02) | benign(0.053) | TCGA-A5-A1OF-01 | Endometrium | uterine corpus endometrioid carcinoma | Female | <65 | I/II | Unknown | Unknown | SD |
| DDX19B | SNV | Missense_Mutation | c.244C>T | p.Arg82Trp | p.R82W | Q9UMR2 | protein_coding | deleterious(0) | benign(0.015) | TCGA-AP-A051-01 | Endometrium | uterine corpus endometrioid carcinoma | Female | >=65 | I/II | Unknown | Unknown | SD | |
| DDX19B | SNV | Missense_Mutation | c.560N>C | p.Lys187Thr | p.K187T | Q9UMR2 | protein_coding | deleterious(0.03) | benign(0.083) | TCGA-AP-A056-01 | Endometrium | uterine corpus endometrioid carcinoma | Female | <65 | I/II | Unknown | Unknown | SD |
| Page: 1 2 3 4 |
Top |
Related drugs of malignant transformation related genes |
| Identification of chemicals and drugs interact with genes involved in malignant transfromation |
| (DGIdb 4.0) |
| Entrez ID | Symbol | Category | Interaction Types | Drug Claim Name | Drug Name | PMIDs |
| Page: 1 |

Copyright 2023-Present -The University of Texas Health Science Center at Houston |