
|
|||||
|
 | |
| |
| |
| |
| |
| |
|
Gene: CYSTM1 |
Gene summary for CYSTM1 |
| Gene information | Species | Human | Gene symbol | CYSTM1 | Gene ID | 84418 |
| Gene name | cysteine rich transmembrane module containing 1 | |
| Gene Alias | C5orf32 | |
| Cytomap | 5q31.3 | |
| Gene Type | protein-coding | GO ID | GO:0008150 | UniProtAcc | Q9H1C7 |
Top |
Malignant transformation analysis |
| Identification of the aberrant gene expression in precancerous and cancerous lesions by comparing the gene expression of stem-like cells in diseased tissues with normal stem cells |
| Entrez ID | Symbol | Replicates | Species | Organ | Tissue | Adj P-value | Log2FC | Malignancy |
| 84418 | CYSTM1 | P2T-E | Human | Esophagus | ESCC | 3.24e-19 | 4.56e-01 | 0.1177 |
| 84418 | CYSTM1 | P4T-E | Human | Esophagus | ESCC | 1.62e-36 | 1.02e+00 | 0.1323 |
| 84418 | CYSTM1 | P5T-E | Human | Esophagus | ESCC | 7.79e-59 | 1.29e+00 | 0.1327 |
| 84418 | CYSTM1 | P8T-E | Human | Esophagus | ESCC | 6.66e-39 | 9.93e-01 | 0.0889 |
| 84418 | CYSTM1 | P9T-E | Human | Esophagus | ESCC | 1.81e-27 | 1.02e+00 | 0.1131 |
| 84418 | CYSTM1 | P10T-E | Human | Esophagus | ESCC | 2.96e-15 | 3.08e-01 | 0.116 |
| 84418 | CYSTM1 | P11T-E | Human | Esophagus | ESCC | 2.31e-17 | 1.11e+00 | 0.1426 |
| 84418 | CYSTM1 | P12T-E | Human | Esophagus | ESCC | 5.56e-23 | 6.28e-01 | 0.1122 |
| 84418 | CYSTM1 | P15T-E | Human | Esophagus | ESCC | 9.04e-30 | 1.02e+00 | 0.1149 |
| 84418 | CYSTM1 | P16T-E | Human | Esophagus | ESCC | 3.73e-17 | 2.15e-01 | 0.1153 |
| 84418 | CYSTM1 | P17T-E | Human | Esophagus | ESCC | 2.43e-08 | 8.72e-01 | 0.1278 |
| 84418 | CYSTM1 | P19T-E | Human | Esophagus | ESCC | 1.32e-11 | 1.31e+00 | 0.1662 |
| 84418 | CYSTM1 | P20T-E | Human | Esophagus | ESCC | 6.78e-42 | 1.66e+00 | 0.1124 |
| 84418 | CYSTM1 | P21T-E | Human | Esophagus | ESCC | 7.06e-58 | 1.30e+00 | 0.1617 |
| 84418 | CYSTM1 | P22T-E | Human | Esophagus | ESCC | 7.90e-50 | 1.42e+00 | 0.1236 |
| 84418 | CYSTM1 | P23T-E | Human | Esophagus | ESCC | 1.19e-24 | 1.12e+00 | 0.108 |
| 84418 | CYSTM1 | P24T-E | Human | Esophagus | ESCC | 7.82e-36 | 7.76e-01 | 0.1287 |
| 84418 | CYSTM1 | P26T-E | Human | Esophagus | ESCC | 1.80e-50 | 1.20e+00 | 0.1276 |
| 84418 | CYSTM1 | P27T-E | Human | Esophagus | ESCC | 1.61e-23 | 6.50e-01 | 0.1055 |
| 84418 | CYSTM1 | P28T-E | Human | Esophagus | ESCC | 1.17e-23 | 7.72e-01 | 0.1149 |
| Page: 1 2 3 4 5 6 7 8 9 10 11 12 13 14 |
| Tissue | Expression Dynamics | Abbreviation |
| Colorectum (GSE201348) |  | FAP: Familial adenomatous polyposis |
| CRC: Colorectal cancer | ||
| Colorectum (HTA11) |  | AD: Adenomas |
| SER: Sessile serrated lesions | ||
| MSI-H: Microsatellite-high colorectal cancer | ||
| MSS: Microsatellite stable colorectal cancer | ||
| Endometrium |  | AEH: Atypical endometrial hyperplasia |
| EEC: Endometrioid Cancer | ||
| Esophagus | 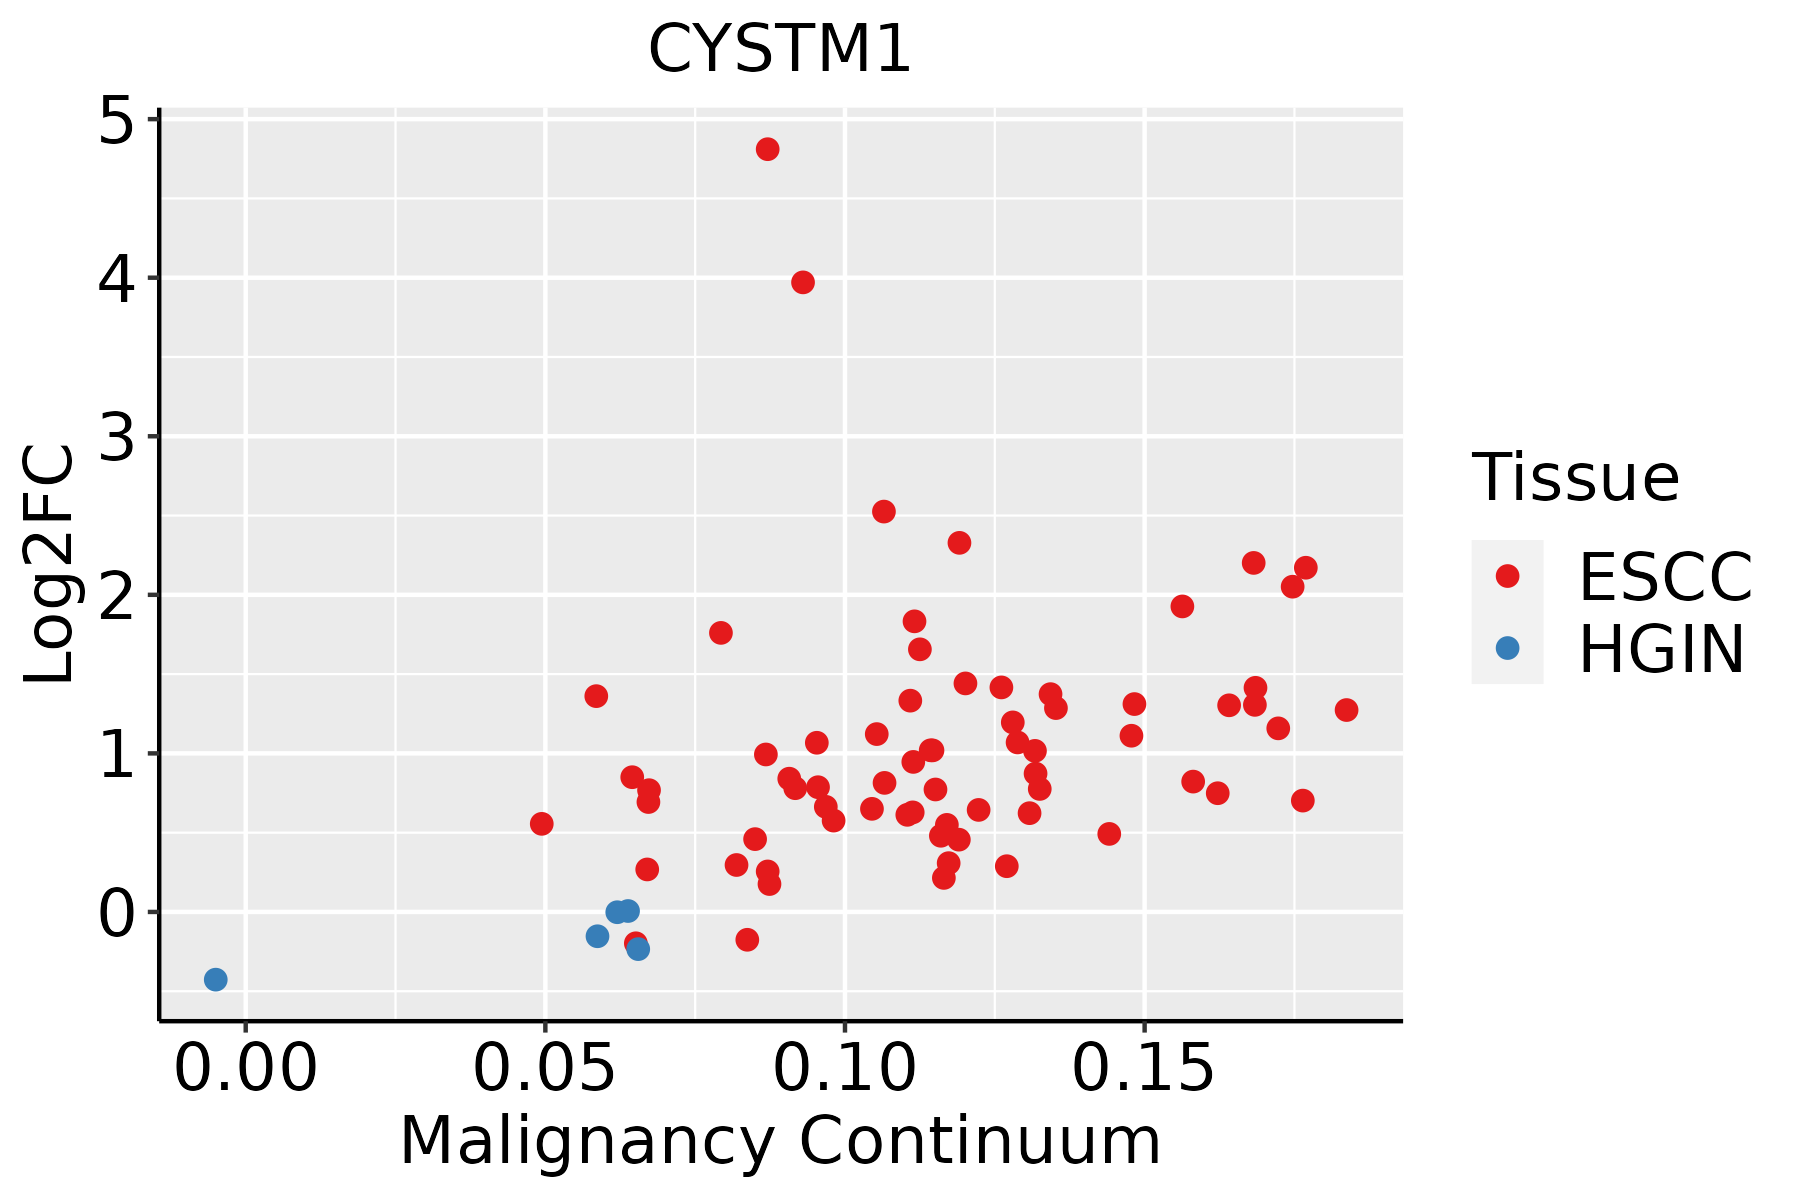 | ESCC: Esophageal squamous cell carcinoma |
| HGIN: High-grade intraepithelial neoplasias | ||
| LGIN: Low-grade intraepithelial neoplasias | ||
| GC | 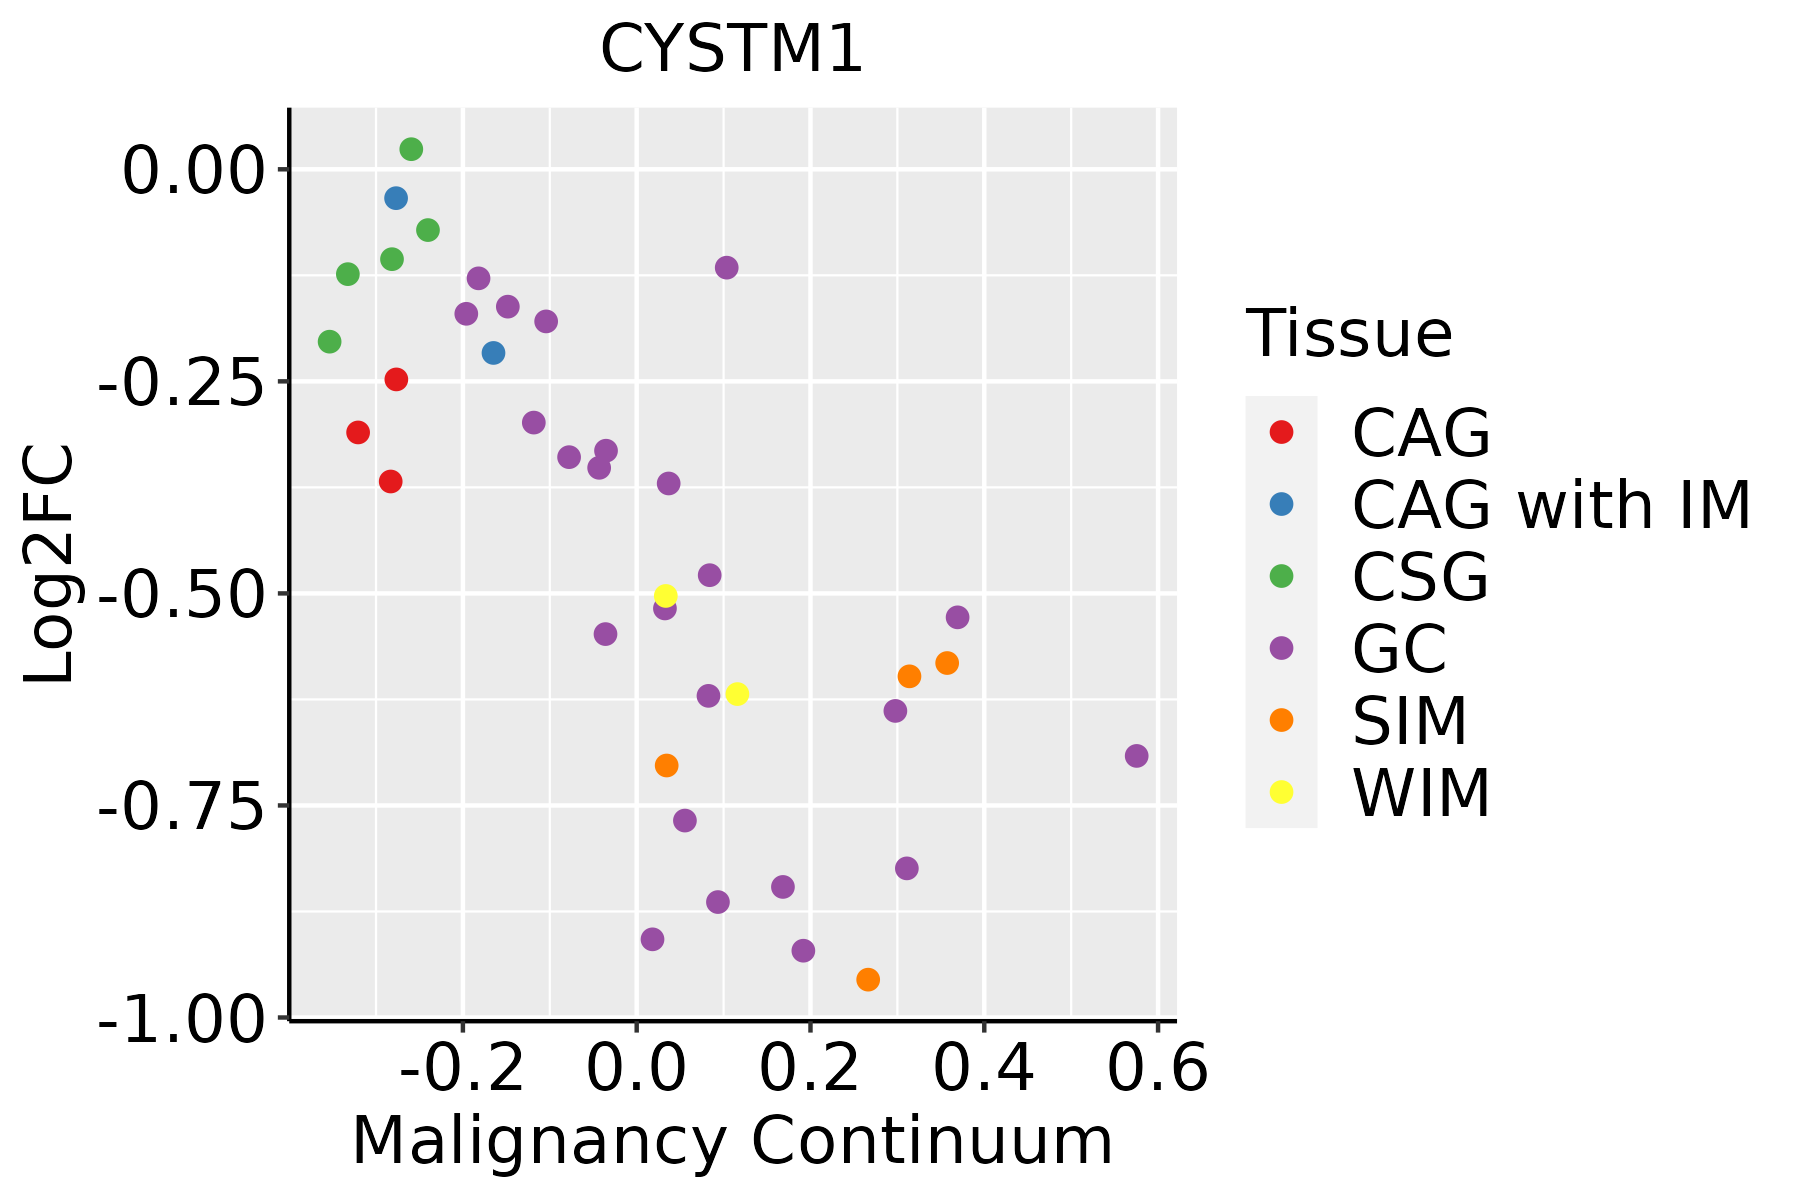 | CAG: Chronic atrophic gastritis |
| CAG with IM: Chronic atrophic gastritis with intestinal metaplasia | ||
| CSG: Chronic superficial gastritis | ||
| GC: Gastric cancer | ||
| SIM: Severe intestinal metaplasia | ||
| WIM: Wild intestinal metaplasia | ||
| Liver | 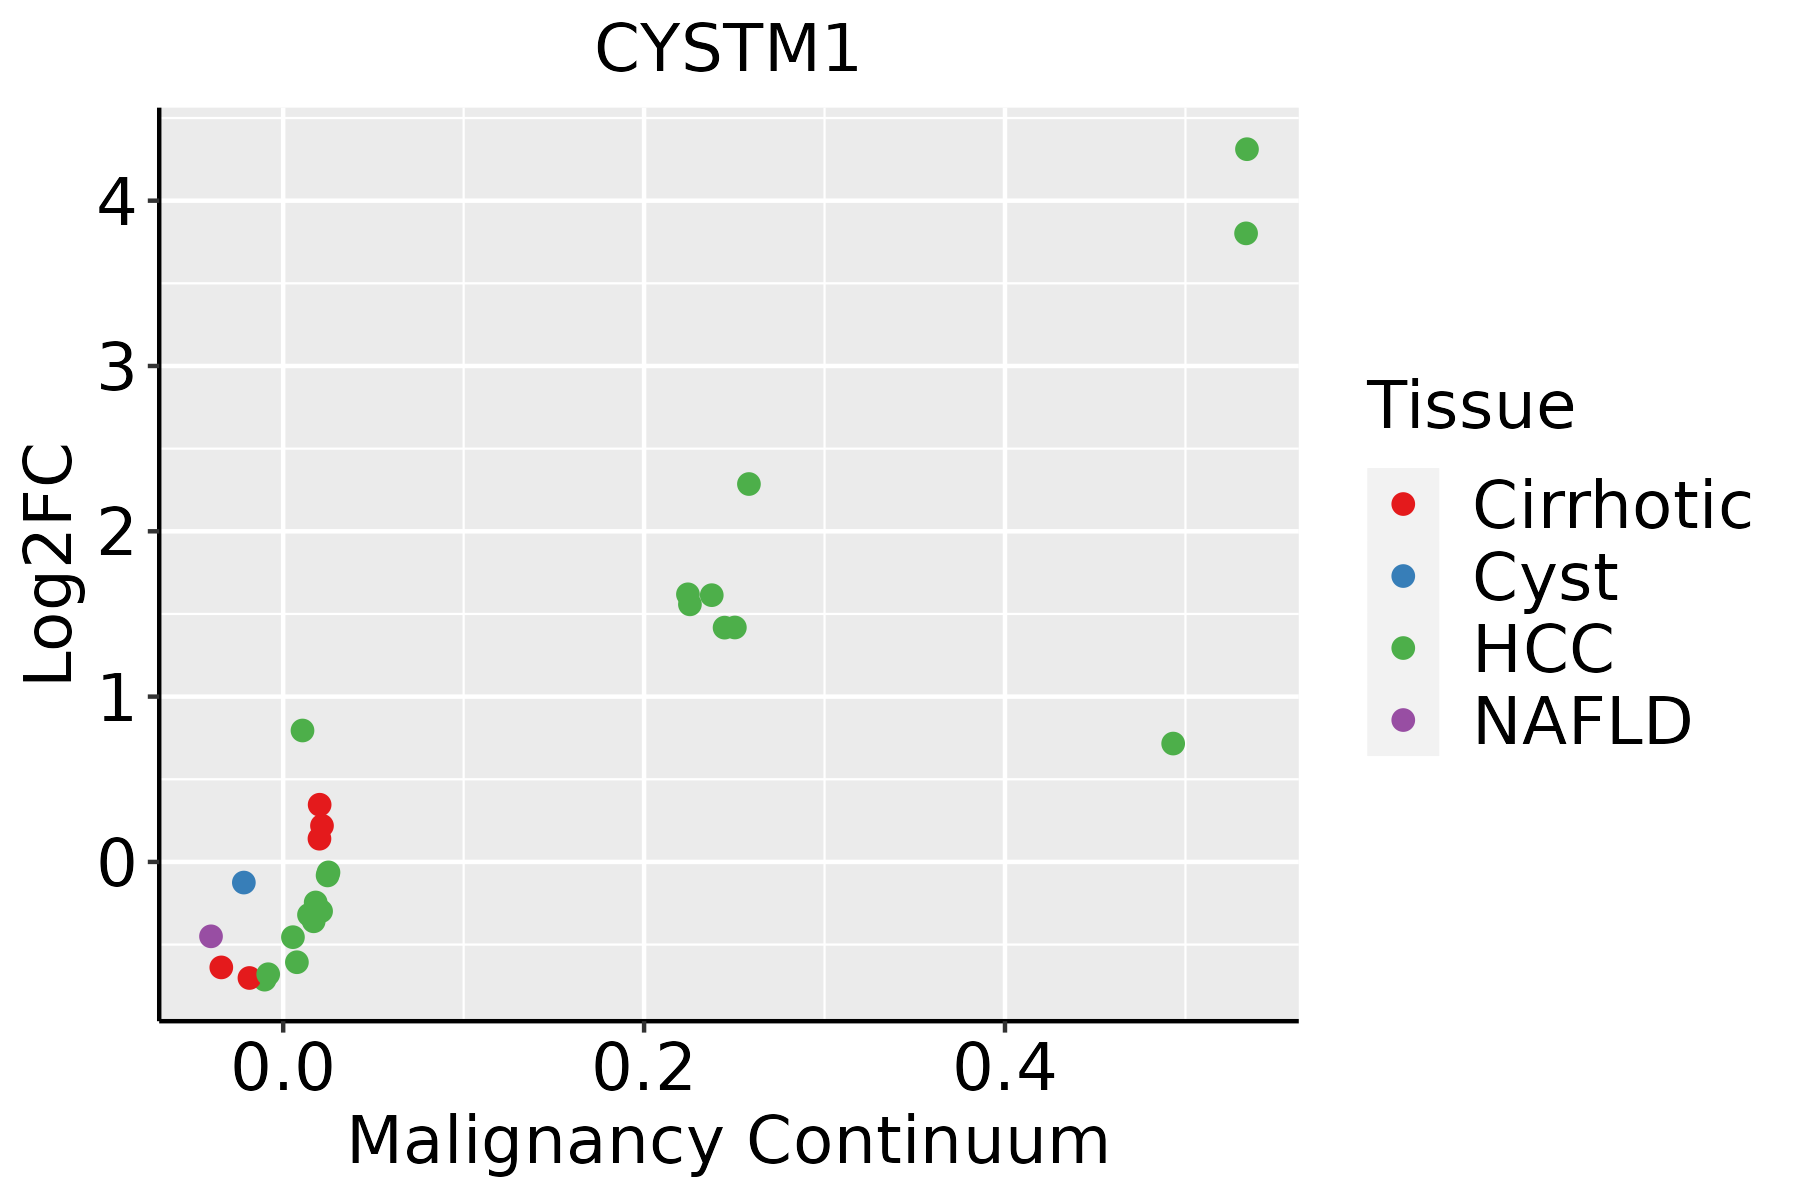 | HCC: Hepatocellular carcinoma |
| NAFLD: Non-alcoholic fatty liver disease | ||
| Oral Cavity |  | EOLP: Erosive Oral lichen planus |
| LP: leukoplakia | ||
| NEOLP: Non-erosive oral lichen planus | ||
| OSCC: Oral squamous cell carcinoma | ||
| Prostate | 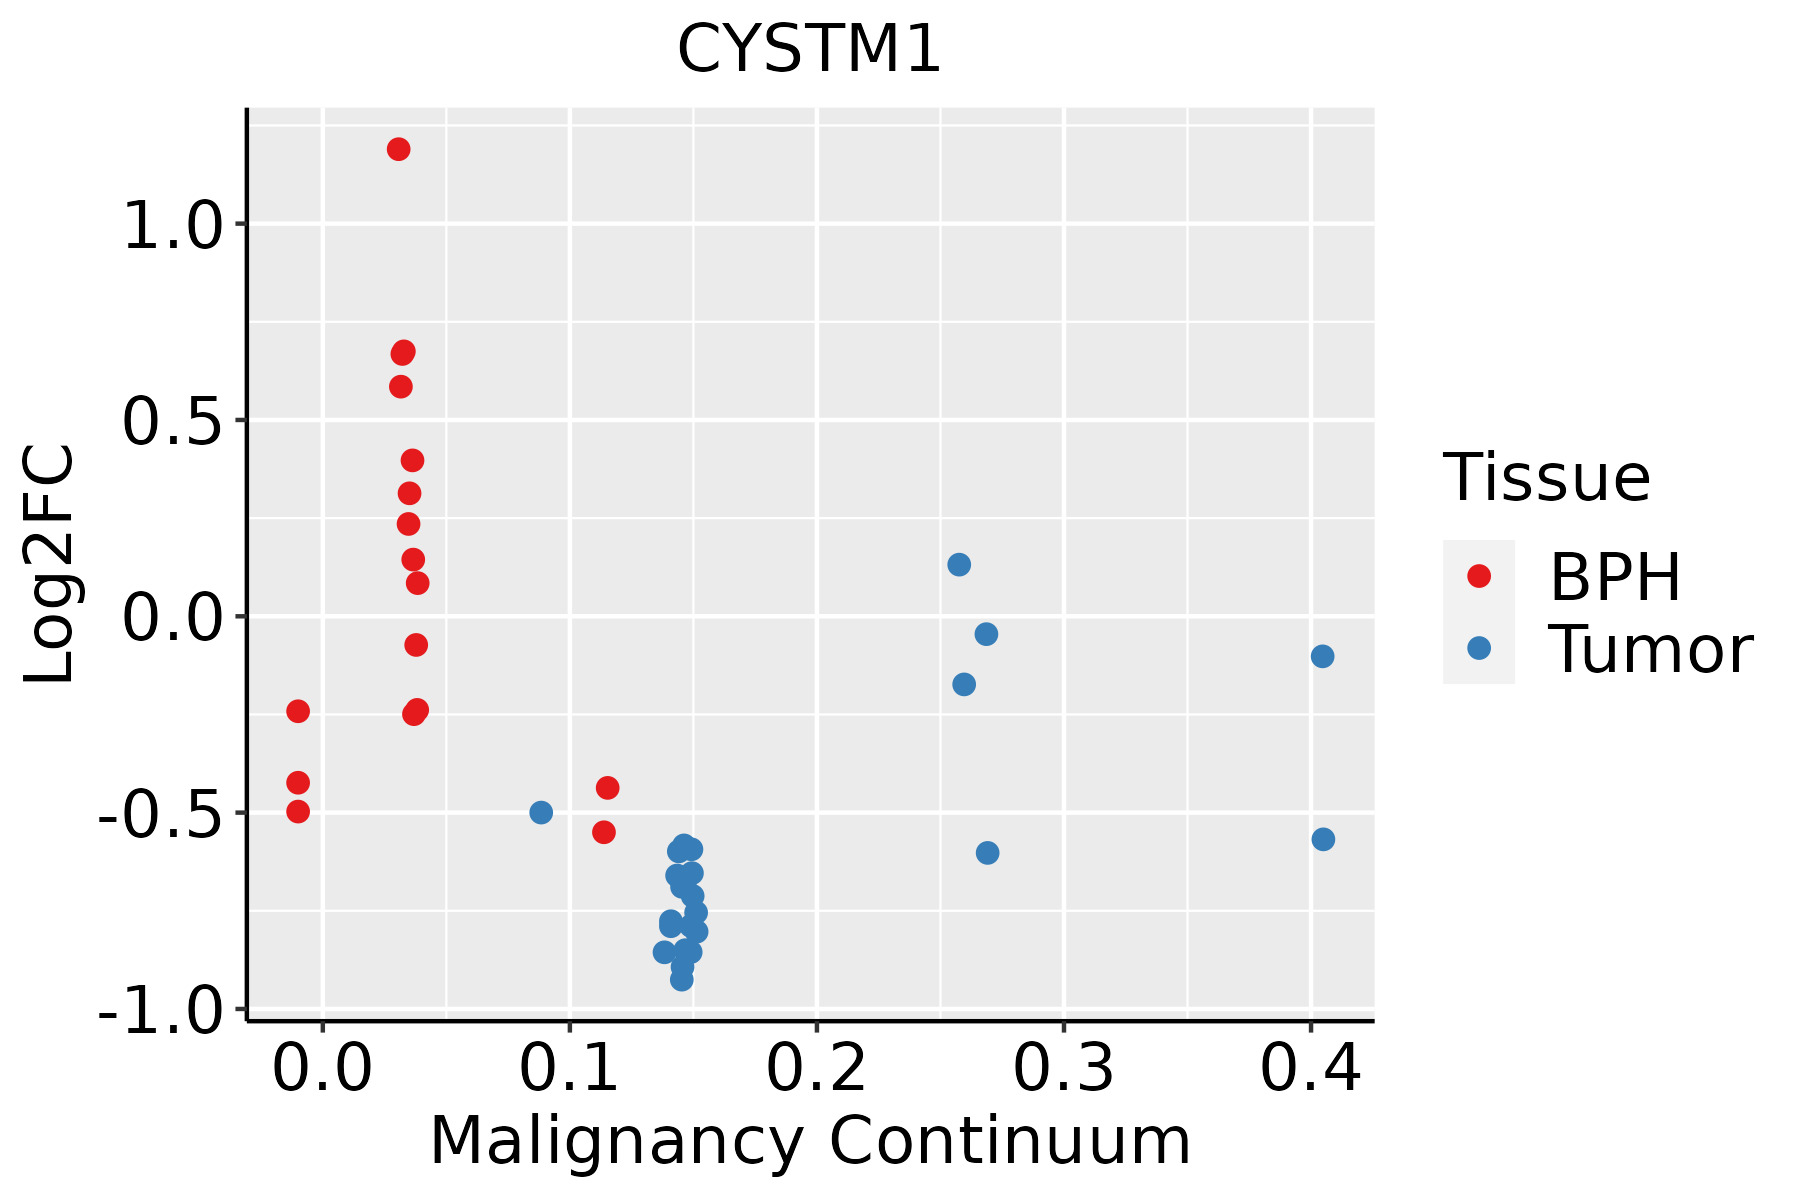 | BPH: Benign Prostatic Hyperplasia |
| Skin | 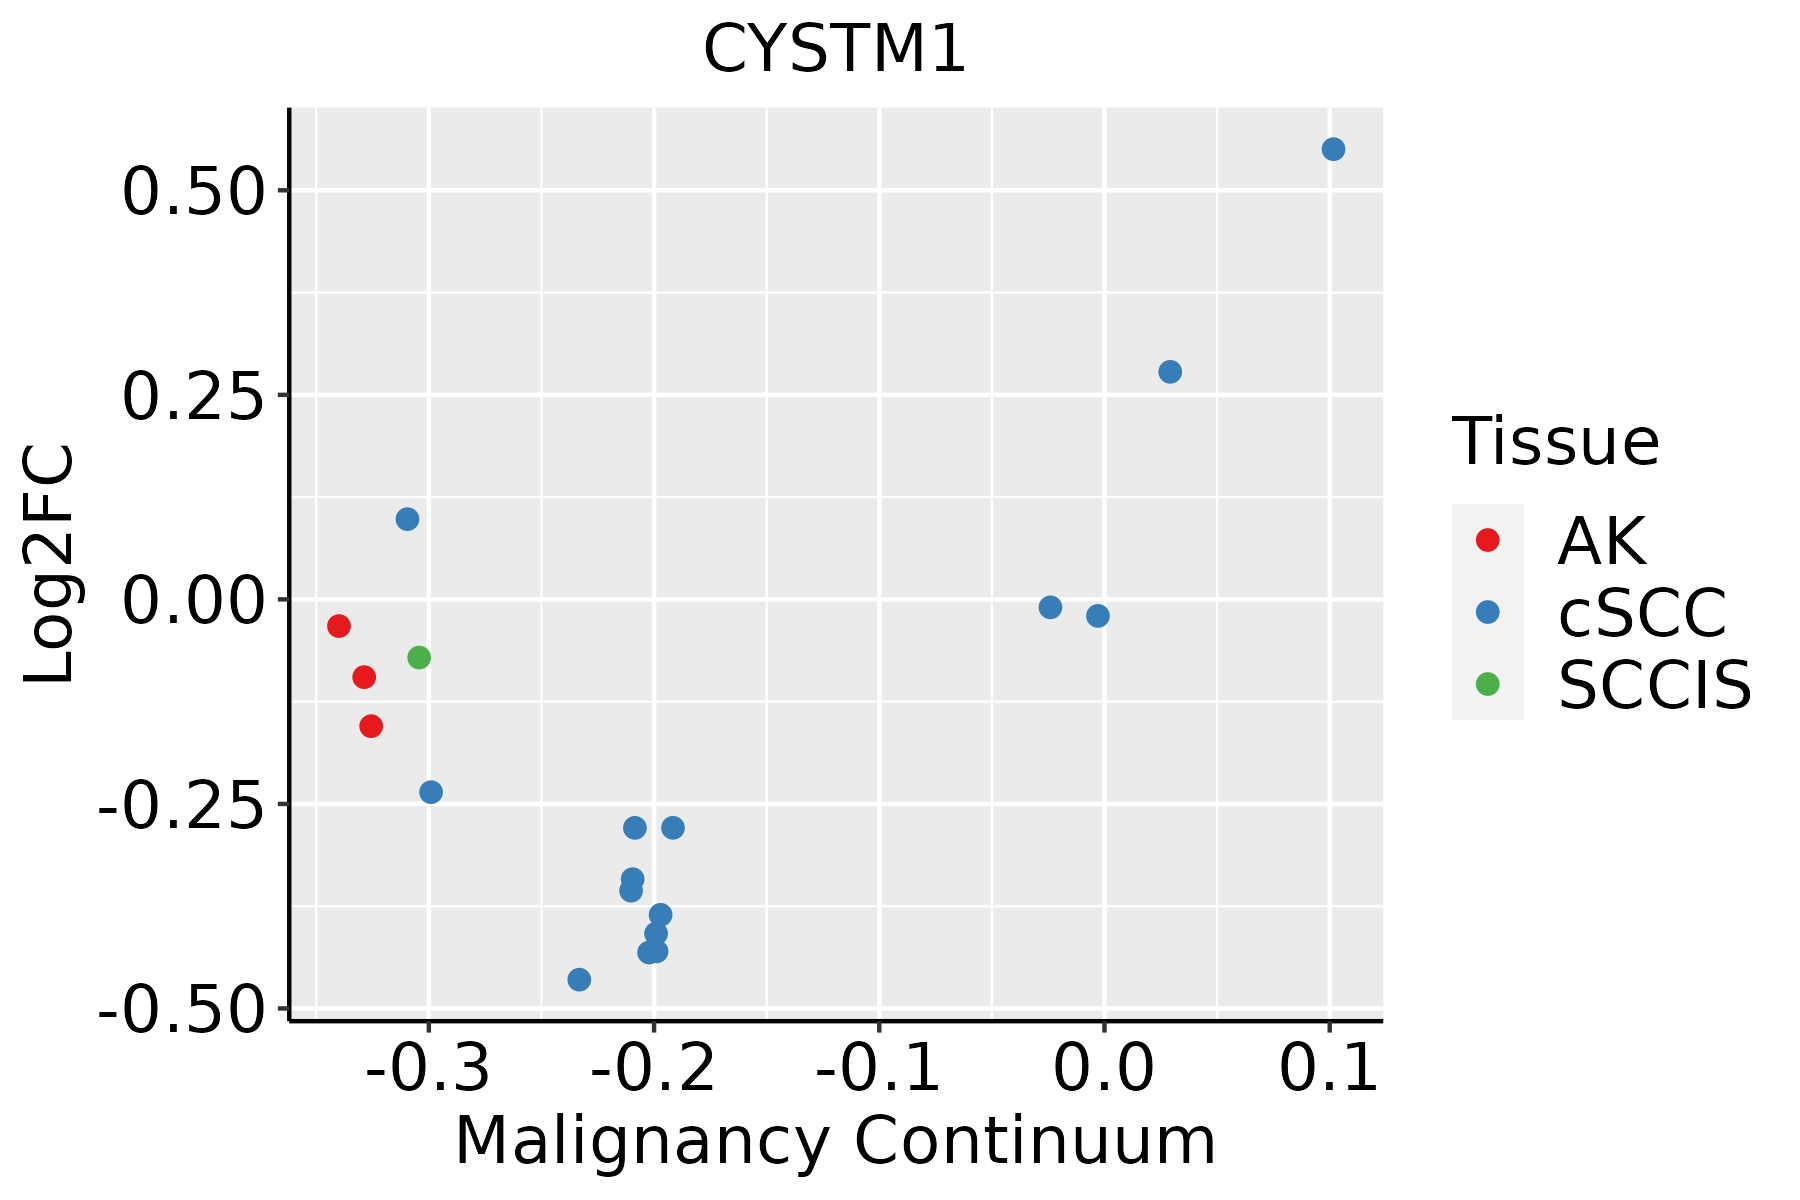 | AK: Actinic keratosis |
| cSCC: Cutaneous squamous cell carcinoma | ||
| SCCIS:squamous cell carcinoma in situ | ||
| Thyroid | 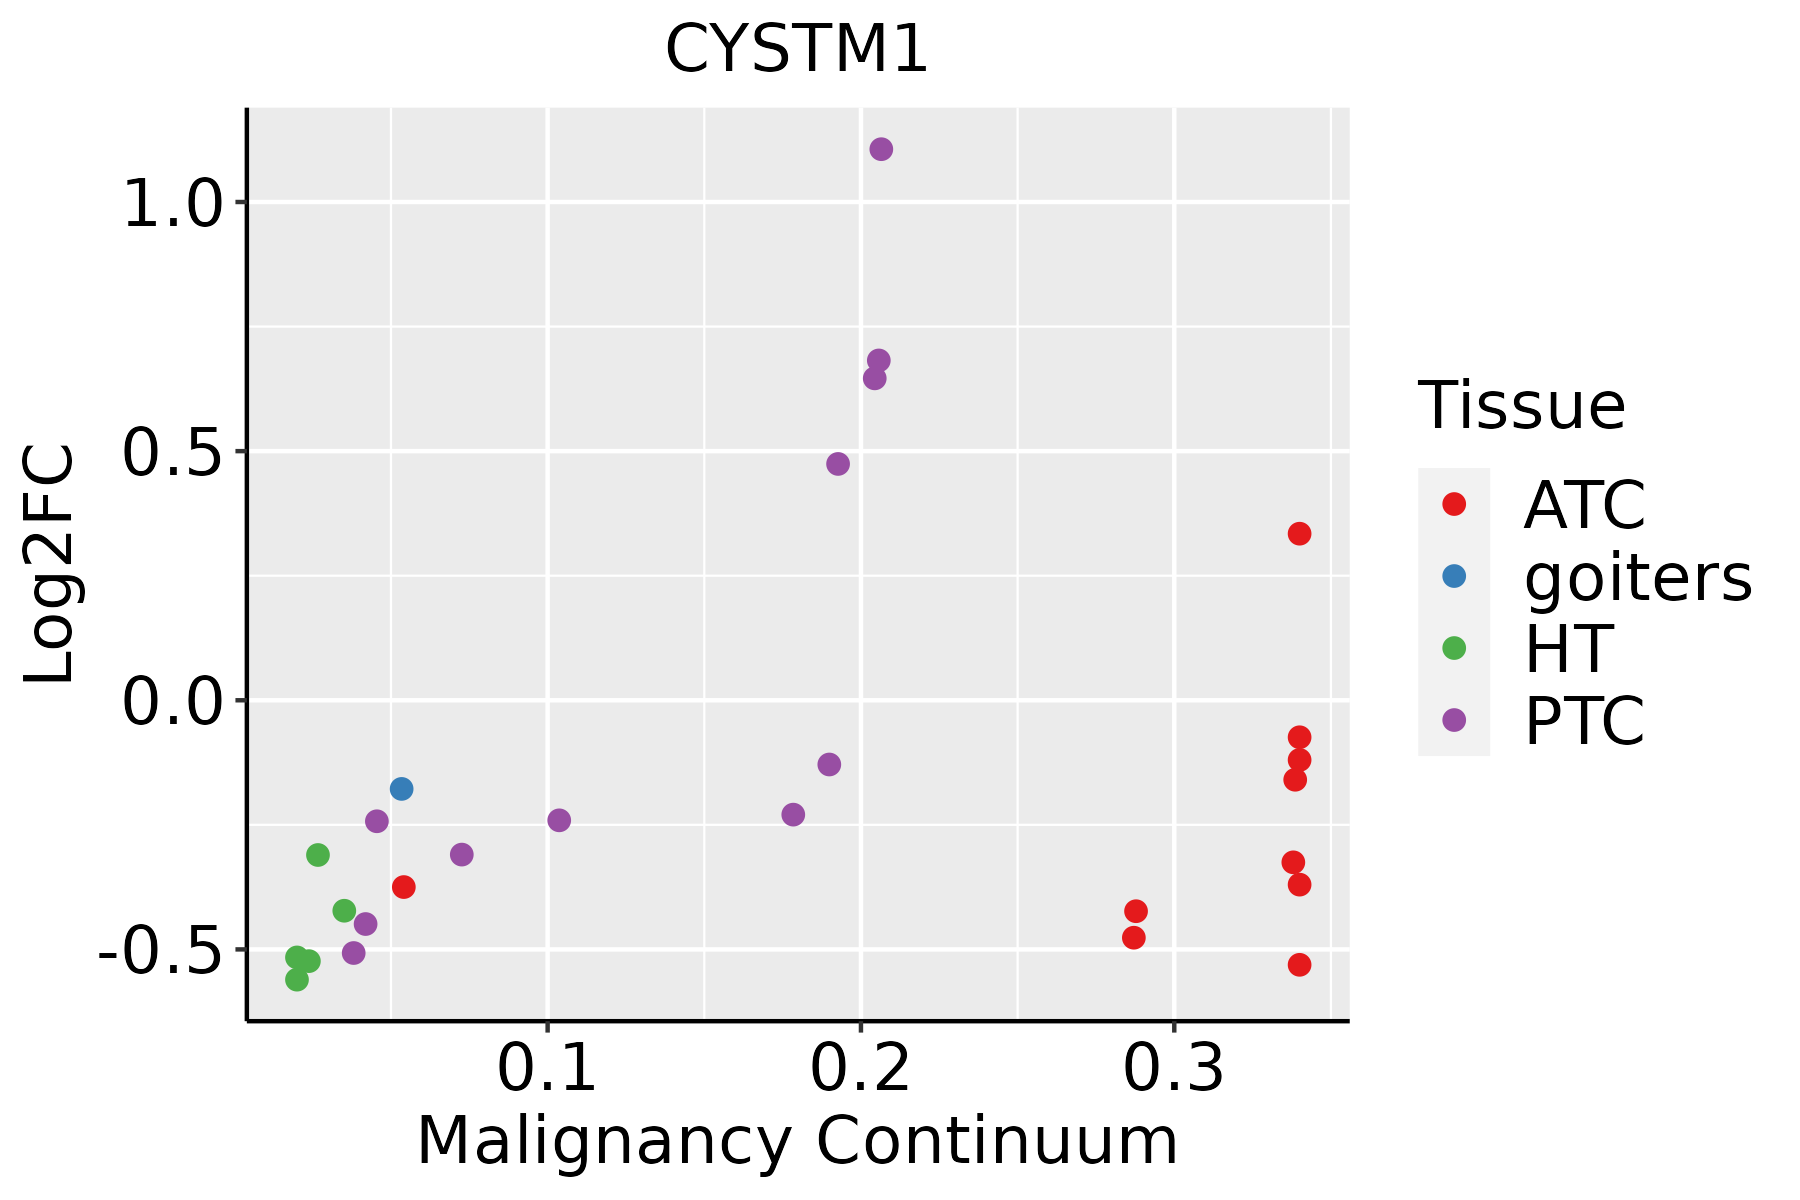 | ATC: Anaplastic thyroid cancer |
| HT: Hashimoto's thyroiditis | ||
| PTC: Papillary thyroid cancer |
| ∗log2FC in expression of this searched gene in stem-like cells from each diseased tissue sample relative to stem-like cells in normal samples in each tissue plotted against the malignancy continuum. Samples are colored based on if they are from different disease stage. |
Top |
Malignant transformation related pathway analysis |
| Find out the enriched GO biological processes and KEGG pathways involved in transition from healthy to precancer to cancer |
| Tissue | Disease Stage | Enriched GO biological Processes |
| Colorectum | AD |  |
| Colorectum | SER |  |
| Colorectum | MSS |  |
| Colorectum | MSI-H |  |
| Colorectum | FAP |  |
| ∗Top 15 enriched GO BP terms are showed in the bar plot of each disease state in each tissue. Each row represents a significant GO biological process which is colored according to the -log10(p.adjust). |
| Page: 1 2 3 4 5 6 7 8 9 |
| GO ID | Tissue | Disease Stage | Description | Gene Ratio | Bg Ratio | pvalue | p.adjust | Count |
| Page: 1 |
| Pathway ID | Tissue | Disease Stage | Description | Gene Ratio | Bg Ratio | pvalue | p.adjust | qvalue | Count |
| Page: 1 |
Top |
Cell-cell communication analysis |
| Identification of potential cell-cell interactions between two cell types and their ligand-receptor pairs for different disease states |
| Ligand | Receptor | LRpair | Pathway | Tissue | Disease Stage |
| Page: 1 |
Top |
Single-cell gene regulatory network inference analysis |
| Find out the significant the regulons (TFs) and the target genes of each regulon across cell types for different disease states |
| TF | Cell Type | Tissue | Disease Stage | Target Gene | RSS | Regulon Activity |
| ∗The dot plots of a searched regulon are shown for all cell subpopulations in each disease state of each tissue based on the regulon specific score inferred using pySCENIC and by calculating the average expression. |
| Page: 1 |
Top |
Somatic mutation of malignant transformation related genes |
| Annotation of somatic variants for genes involved in malignant transformation |
| Hugo Symbol | Variant Class | Variant Classification | dbSNP RS | HGVSc | HGVSp | HGVSp Short | SWISSPROT | BIOTYPE | SIFT | PolyPhen | Tumor Sample Barcode | Tissue | Histology | Sex | Age | Stage | Therapy Types | Drugs | Outcome |
| CYSTM1 | SNV | Missense_Mutation | c.10G>C | p.Glu4Gln | p.E4Q | Q9H1C7 | protein_coding | tolerated_low_confidence(0.22) | benign(0.054) | TCGA-A2-A25D-01 | Breast | breast invasive carcinoma | Female | >=65 | III/IV | Hormone Therapy | tamoxiphen | SD | |
| CYSTM1 | SNV | Missense_Mutation | c.17N>A | p.Pro6His | p.P6H | Q9H1C7 | protein_coding | deleterious_low_confidence(0) | possibly_damaging(0.737) | TCGA-AD-6964-01 | Colorectum | colon adenocarcinoma | Male | <65 | III/IV | Chemotherapy | folfox | PD | |
| CYSTM1 | SNV | Missense_Mutation | novel | c.47N>T | p.Ala16Val | p.A16V | Q9H1C7 | protein_coding | deleterious_low_confidence(0.01) | probably_damaging(0.968) | TCGA-AX-A06F-01 | Endometrium | uterine corpus endometrioid carcinoma | Female | <65 | III/IV | Chemotherapy | carboplatin | SD |
| CYSTM1 | SNV | Missense_Mutation | rs200380290 | c.148N>A | p.Gly50Ser | p.G50S | Q9H1C7 | protein_coding | tolerated_low_confidence(0.09) | probably_damaging(0.999) | TCGA-B5-A3FC-01 | Endometrium | uterine corpus endometrioid carcinoma | Female | <65 | I/II | Unknown | Unknown | SD |
| CYSTM1 | SNV | Missense_Mutation | novel | c.124C>A | p.Pro42Thr | p.P42T | Q9H1C7 | protein_coding | tolerated_low_confidence(0.1) | probably_damaging(0.998) | TCGA-EY-A5W2-01 | Endometrium | uterine corpus endometrioid carcinoma | Female | >=65 | I/II | Unknown | Unknown | SD |
| CYSTM1 | SNV | Missense_Mutation | rs200380290 | c.148G>A | p.Gly50Ser | p.G50S | Q9H1C7 | protein_coding | tolerated_low_confidence(0.09) | probably_damaging(0.999) | TCGA-FI-A2D4-01 | Endometrium | uterine corpus endometrioid carcinoma | Female | <65 | III/IV | Chemotherapy | carboplatinum | PD |
| CYSTM1 | SNV | Missense_Mutation | novel | c.78N>C | p.Met26Ile | p.M26I | Q9H1C7 | protein_coding | tolerated_low_confidence(0.39) | benign(0) | TCGA-O2-A52V-01 | Lung | lung squamous cell carcinoma | Female | >=65 | I/II | Unknown | Unknown | PD |
| CYSTM1 | SNV | Missense_Mutation | c.168N>T | p.Gln56His | p.Q56H | Q9H1C7 | protein_coding | tolerated_low_confidence(0.08) | possibly_damaging(0.601) | TCGA-HU-A4H4-01 | Stomach | stomach adenocarcinoma | Female | <65 | I/II | Chemotherapy | ts-1 | CR | |
| CYSTM1 | SNV | Missense_Mutation | novel | c.170N>C | p.Glu57Ala | p.E57A | Q9H1C7 | protein_coding | tolerated_low_confidence(0.1) | benign(0.287) | TCGA-VQ-A8PP-01 | Stomach | stomach adenocarcinoma | Male | >=65 | III/IV | Chemotherapy | fluorouracil | PD |
| Page: 1 |
Top |
Related drugs of malignant transformation related genes |
| Identification of chemicals and drugs interact with genes involved in malignant transfromation |
| (DGIdb 4.0) |
| Entrez ID | Symbol | Category | Interaction Types | Drug Claim Name | Drug Name | PMIDs |
| Page: 1 |

Copyright 2023-Present -The University of Texas Health Science Center at Houston |