
|
|||||
|
 | |
| |
| |
| |
| |
| |
|
Gene: CTGF |
Gene summary for CTGF |
| Gene information | Species | Human | Gene symbol | CTGF | Gene ID | 1490 |
| Gene name | cellular communication network factor 2 | |
| Gene Alias | CTGF | |
| Cytomap | 6q23.2 | |
| Gene Type | protein-coding | GO ID | GO:0000165 | UniProtAcc | P29279 |
Top |
Malignant transformation analysis |
| Identification of the aberrant gene expression in precancerous and cancerous lesions by comparing the gene expression of stem-like cells in diseased tissues with normal stem cells |
| Entrez ID | Symbol | Replicates | Species | Organ | Tissue | Adj P-value | Log2FC | Malignancy |
| 1490 | CTGF | C09 | Human | Oral cavity | OSCC | 1.62e-54 | 2.49e+00 | 0.1431 |
| 1490 | CTGF | LP15 | Human | Oral cavity | LP | 8.75e-06 | 1.52e+00 | 0.2174 |
| 1490 | CTGF | SYSMH2 | Human | Oral cavity | OSCC | 4.01e-06 | 9.83e-01 | 0.2326 |
| 1490 | CTGF | SYSMH6 | Human | Oral cavity | OSCC | 2.84e-13 | 6.83e-01 | 0.1275 |
| 1490 | CTGF | Dong_P1 | Human | Prostate | Tumor | 3.16e-20 | 3.00e-01 | 0.035 |
| 1490 | CTGF | Dong_P3 | Human | Prostate | Tumor | 1.18e-16 | 2.30e-01 | 0.0278 |
| 1490 | CTGF | Dong_P4 | Human | Prostate | Tumor | 1.57e-10 | 3.69e-01 | 0.0292 |
| 1490 | CTGF | Dong_P5 | Human | Prostate | Tumor | 6.58e-16 | 1.77e-01 | 0.053 |
| 1490 | CTGF | Dong_P6 | Human | Prostate | Tumor | 3.95e-04 | 3.07e-01 | 0.0371 |
| 1490 | CTGF | P7 | Human | Prostate | Tumor | 5.49e-10 | 9.58e-01 | -0.1025 |
| 1490 | CTGF | P9 | Human | Prostate | Tumor | 9.79e-26 | 9.54e-01 | -0.0285 |
| 1490 | CTGF | P10 | Human | Prostate | Tumor | 4.61e-07 | 7.20e-01 | -0.0902 |
| 1490 | CTGF | GSM5353221_PA_PB2A_Pool_1_3_S25_L001 | Human | Prostate | Tumor | 2.76e-07 | 3.65e-01 | 0.1633 |
| 1490 | CTGF | GSM5353222_PA_PB2B_Pool_1_3_S52_L002 | Human | Prostate | Tumor | 1.45e-06 | 3.64e-01 | 0.1608 |
| 1490 | CTGF | GSM5353223_PA_PB2B_Pool_2_S26_L001 | Human | Prostate | Tumor | 1.98e-07 | 4.34e-01 | 0.1604 |
| 1490 | CTGF | GSM5353224_PA_PR5186_Pool_1_2_3_S27_L001 | Human | Prostate | Tumor | 4.44e-11 | 4.94e-01 | 0.1621 |
| 1490 | CTGF | GSM5353227_PA_PR5199-193K_Pool_1_2_3_S55_L002 | Human | Prostate | Tumor | 7.56e-14 | 7.75e-01 | 0.1602 |
| 1490 | CTGF | GSM5353236_PA_PR5251_T1_S7_L001 | Human | Prostate | Tumor | 4.89e-09 | 6.21e-01 | 0.1608 |
| 1490 | CTGF | GSM5353237_PA_PR5251_T2_S8_L001 | Human | Prostate | Tumor | 1.86e-05 | 5.37e-01 | 0.1622 |
| 1490 | CTGF | GSM5353240_PA_PR5254_T1_S15_L001 | Human | Prostate | Tumor | 5.08e-12 | 5.16e-01 | 0.1575 |
| Page: 1 2 3 4 5 6 7 |
| Tissue | Expression Dynamics | Abbreviation |
| Breast | 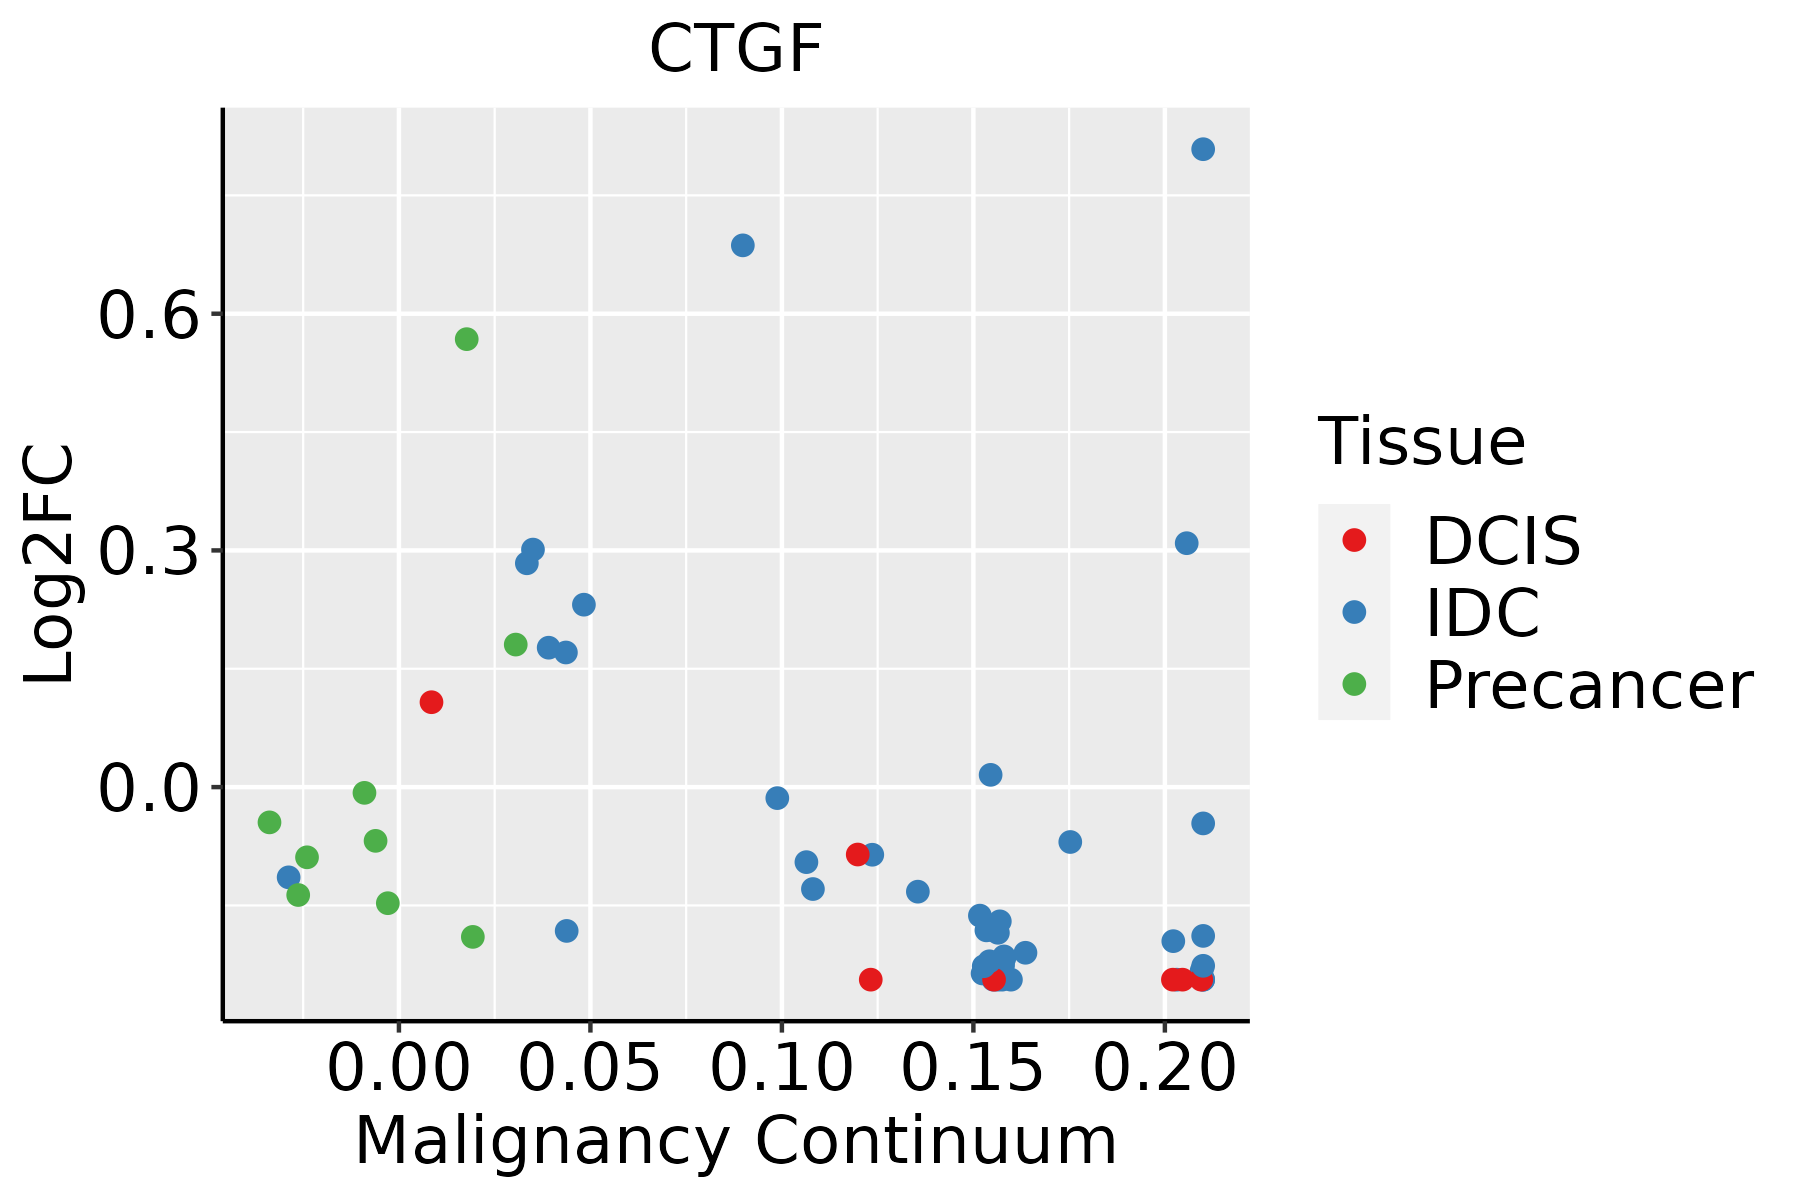 | IDC: Invasive ductal carcinoma |
| DCIS: Ductal carcinoma in situ | ||
| Precancer(BRCA1-mut): Precancerous lesion from BRCA1 mutation carriers | ||
| Esophagus | 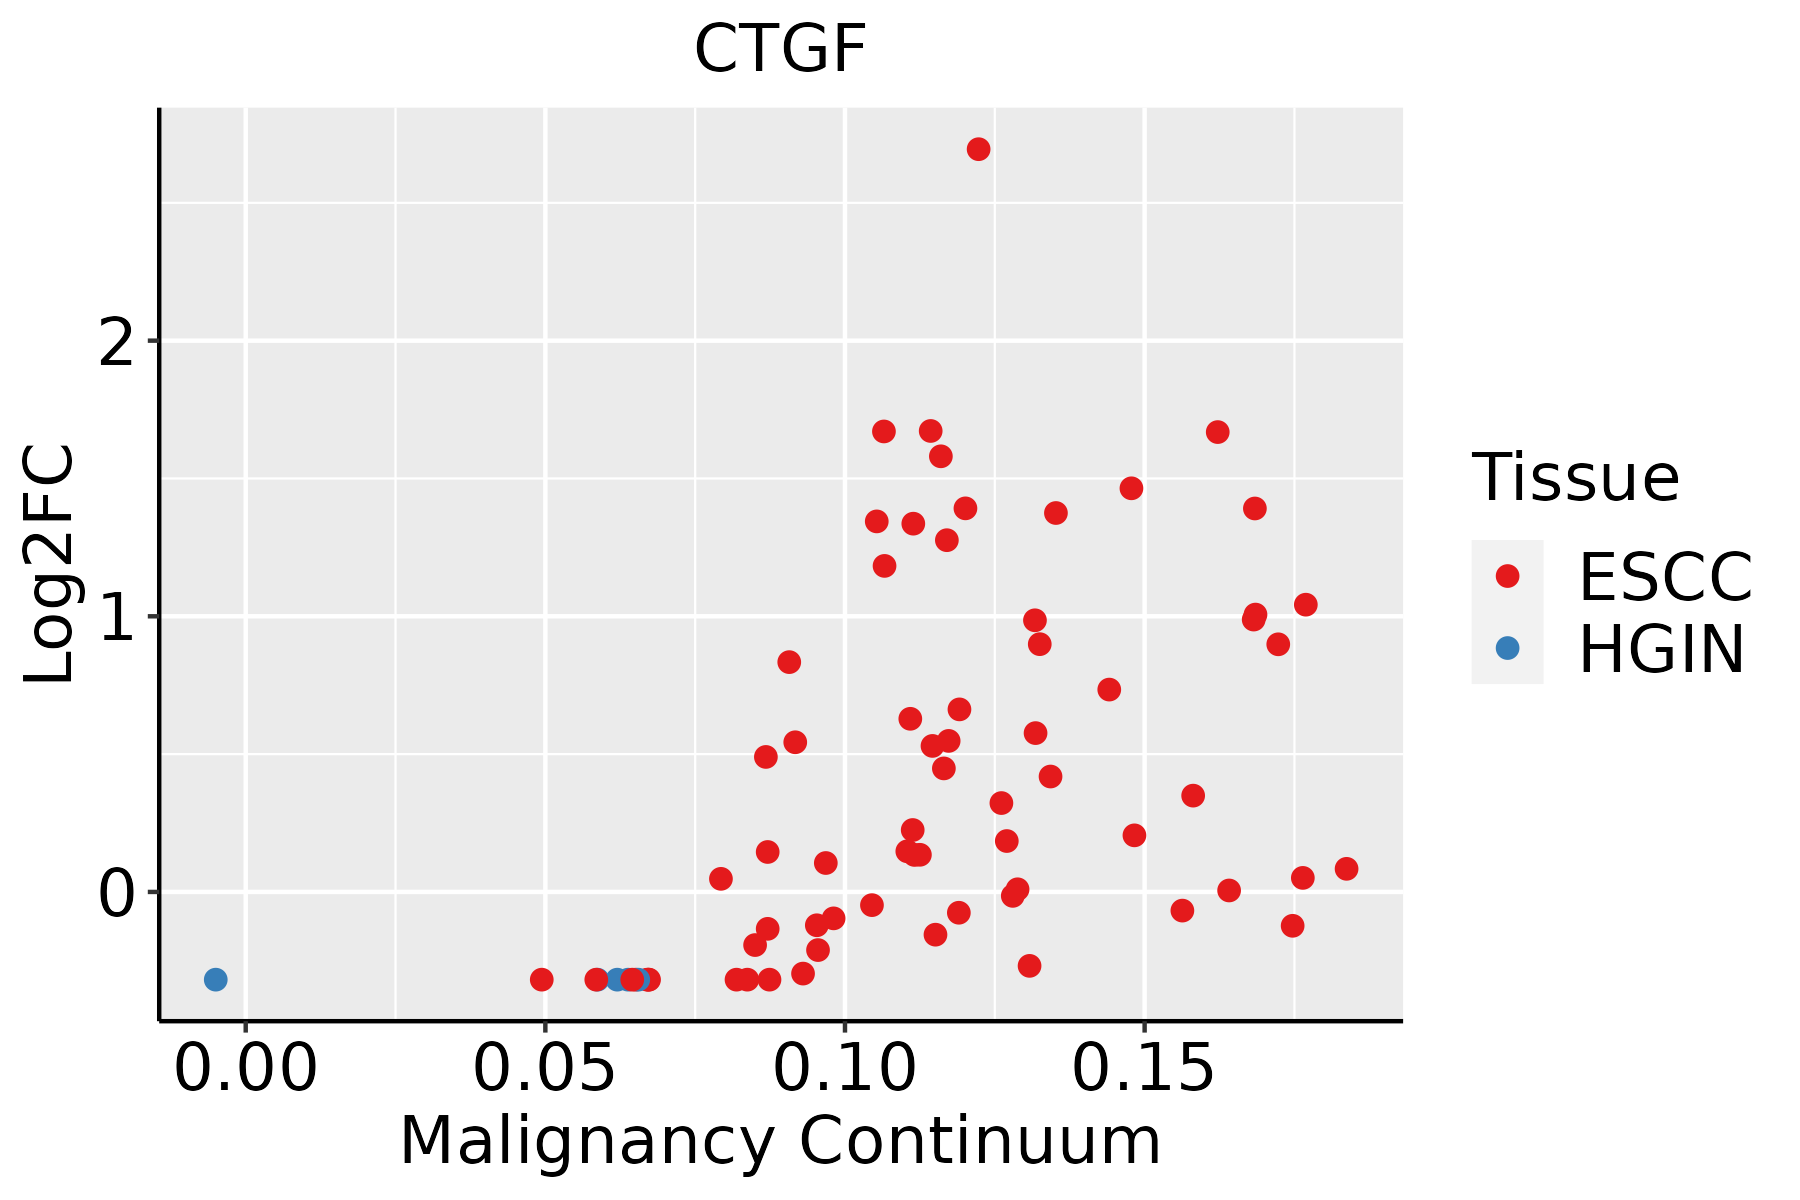 | ESCC: Esophageal squamous cell carcinoma |
| HGIN: High-grade intraepithelial neoplasias | ||
| LGIN: Low-grade intraepithelial neoplasias | ||
| Liver | 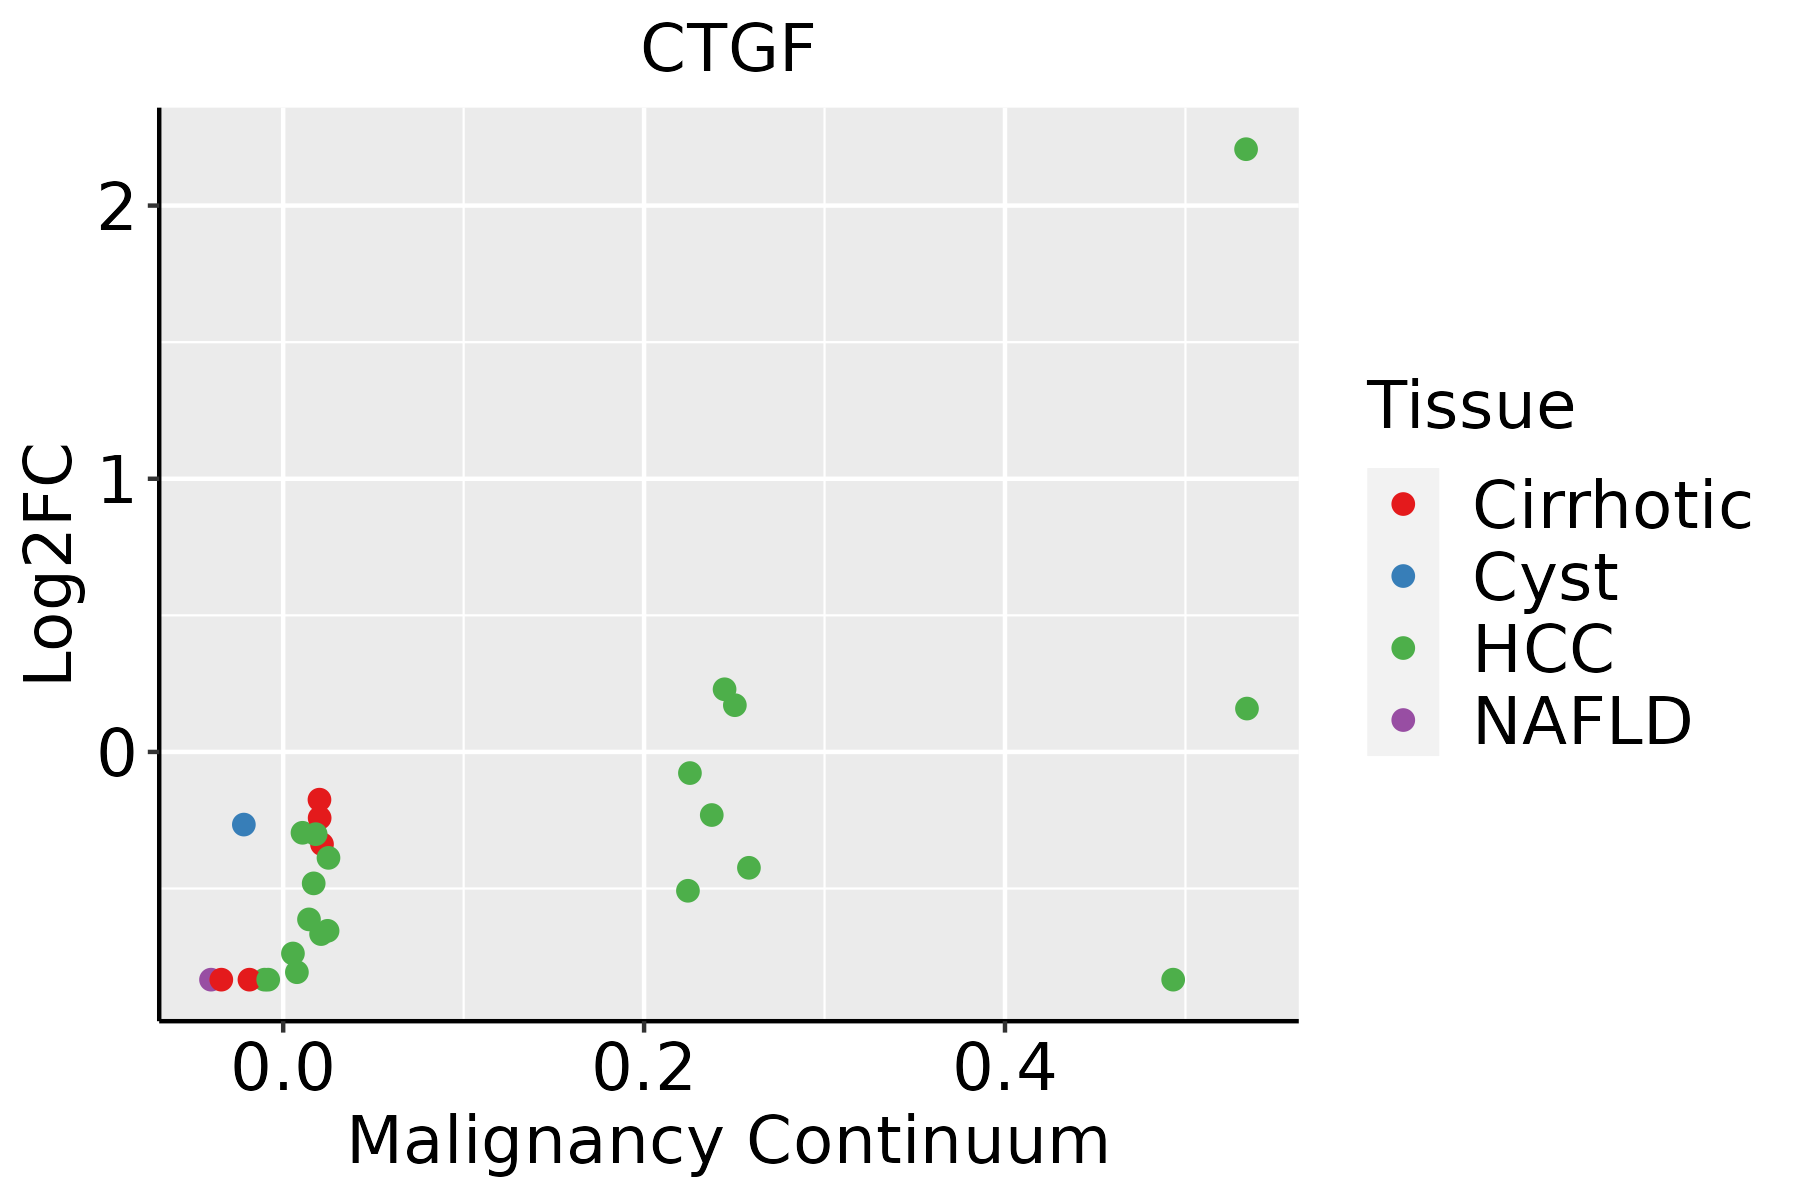 | HCC: Hepatocellular carcinoma |
| NAFLD: Non-alcoholic fatty liver disease | ||
| Lung |  | AAH: Atypical adenomatous hyperplasia |
| AIS: Adenocarcinoma in situ | ||
| IAC: Invasive lung adenocarcinoma | ||
| MIA: Minimally invasive adenocarcinoma | ||
| Oral Cavity | 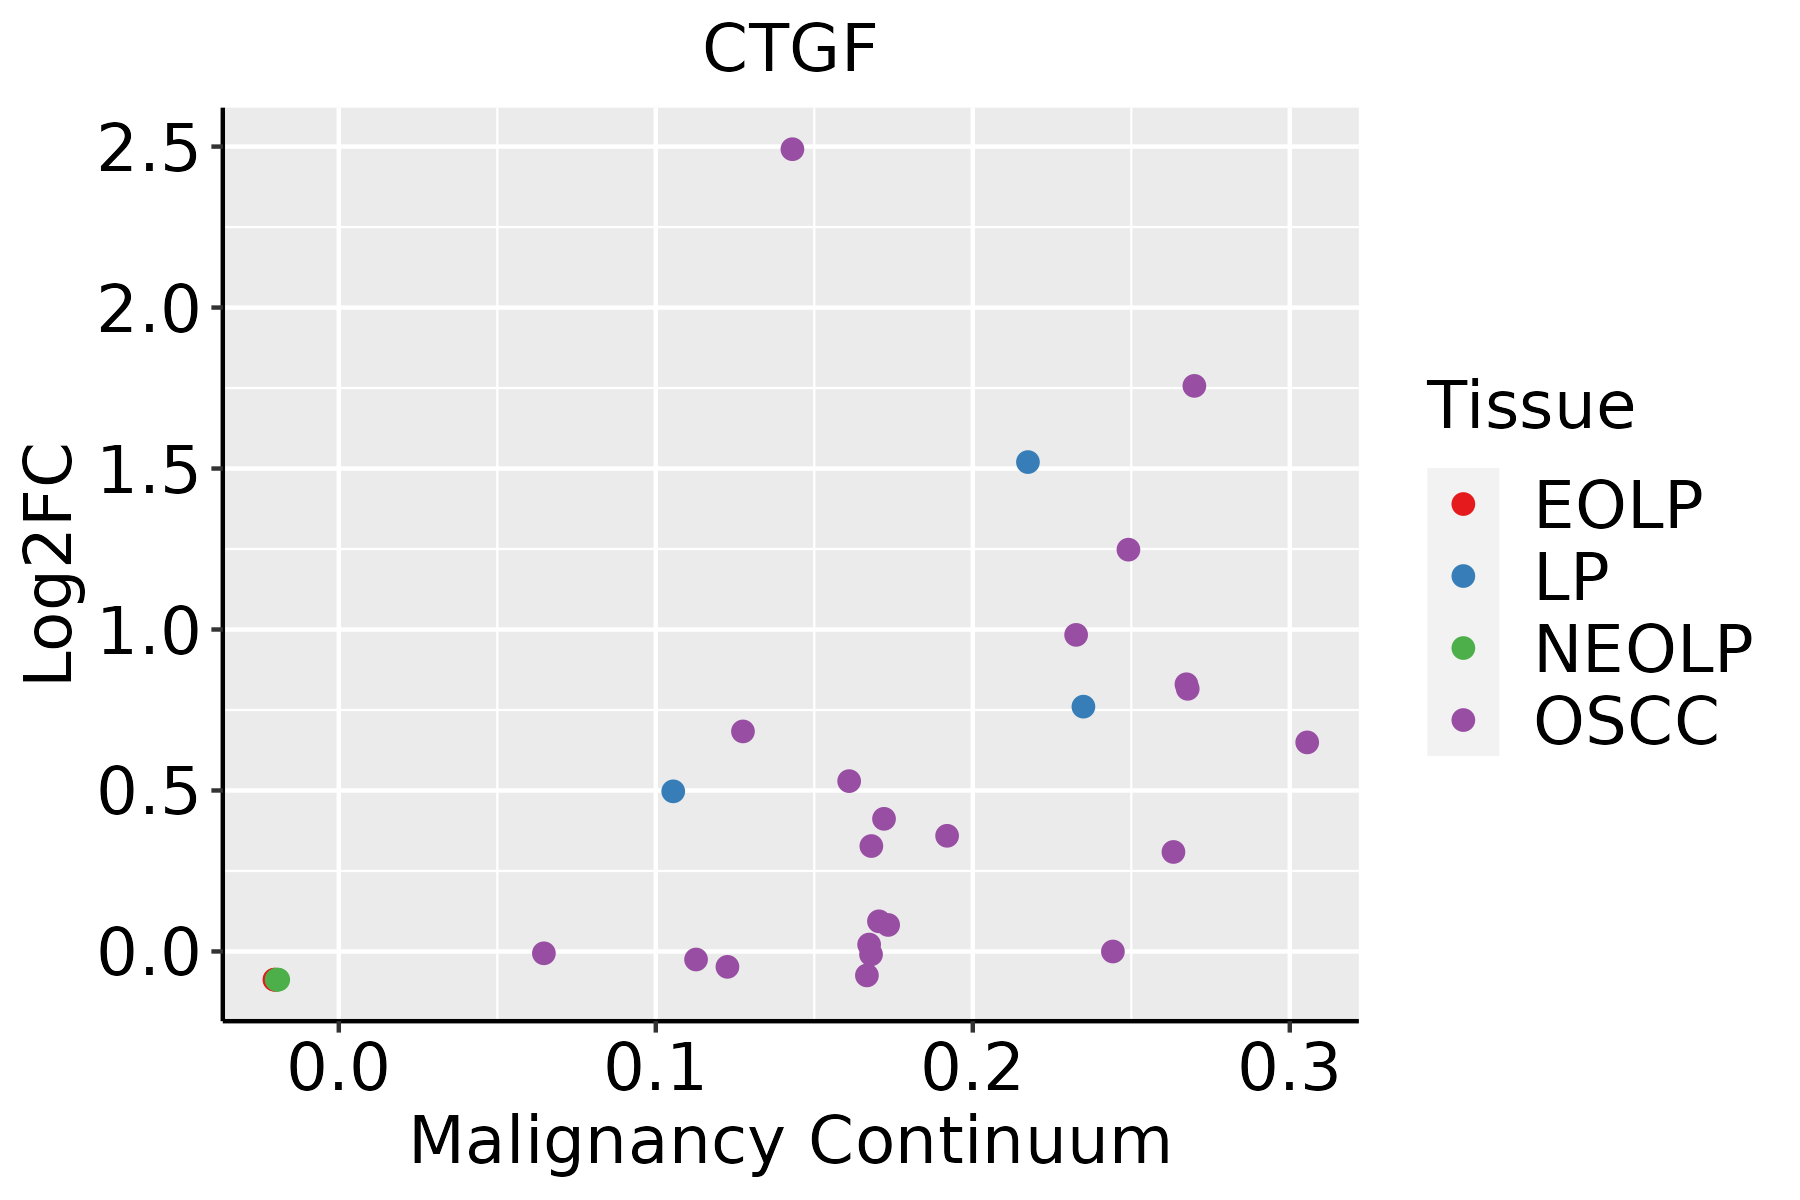 | EOLP: Erosive Oral lichen planus |
| LP: leukoplakia | ||
| NEOLP: Non-erosive oral lichen planus | ||
| OSCC: Oral squamous cell carcinoma | ||
| Prostate | 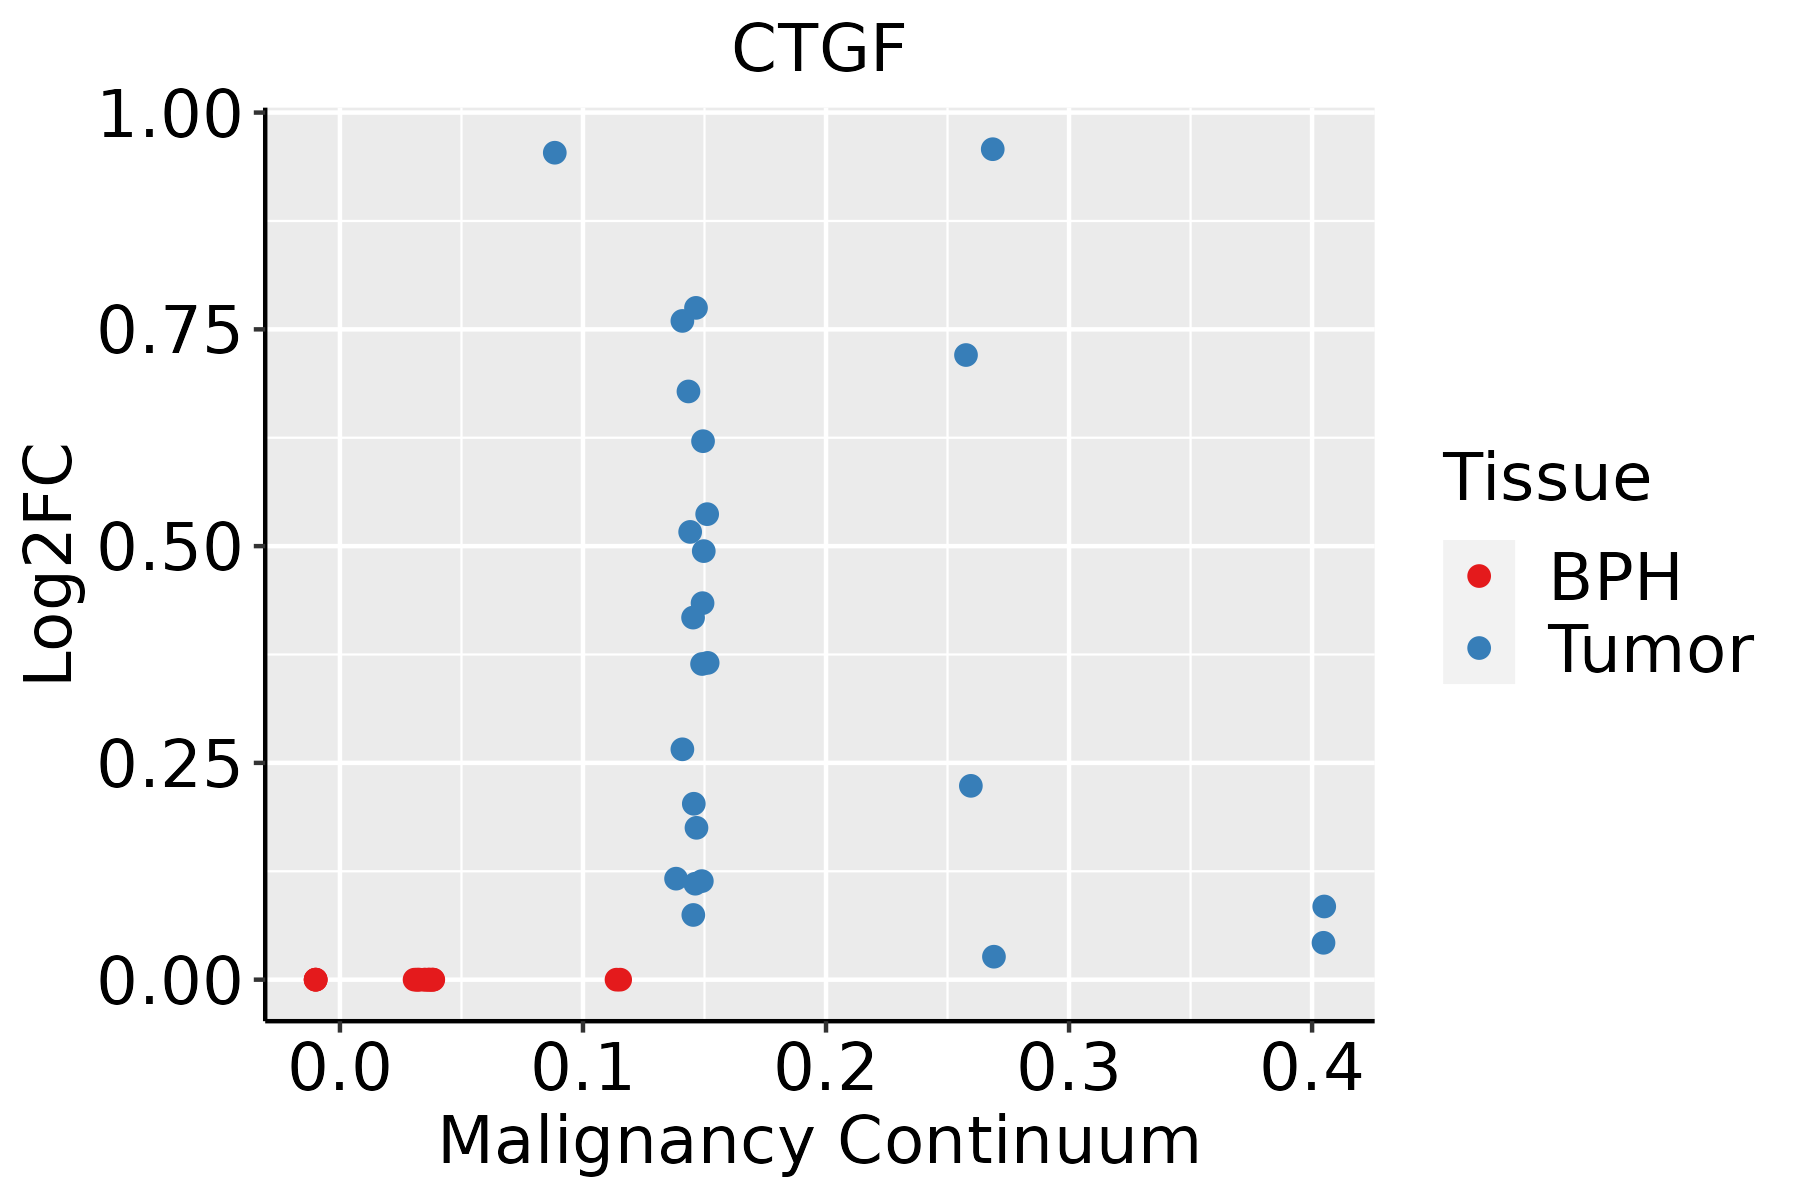 | BPH: Benign Prostatic Hyperplasia |
| Skin | 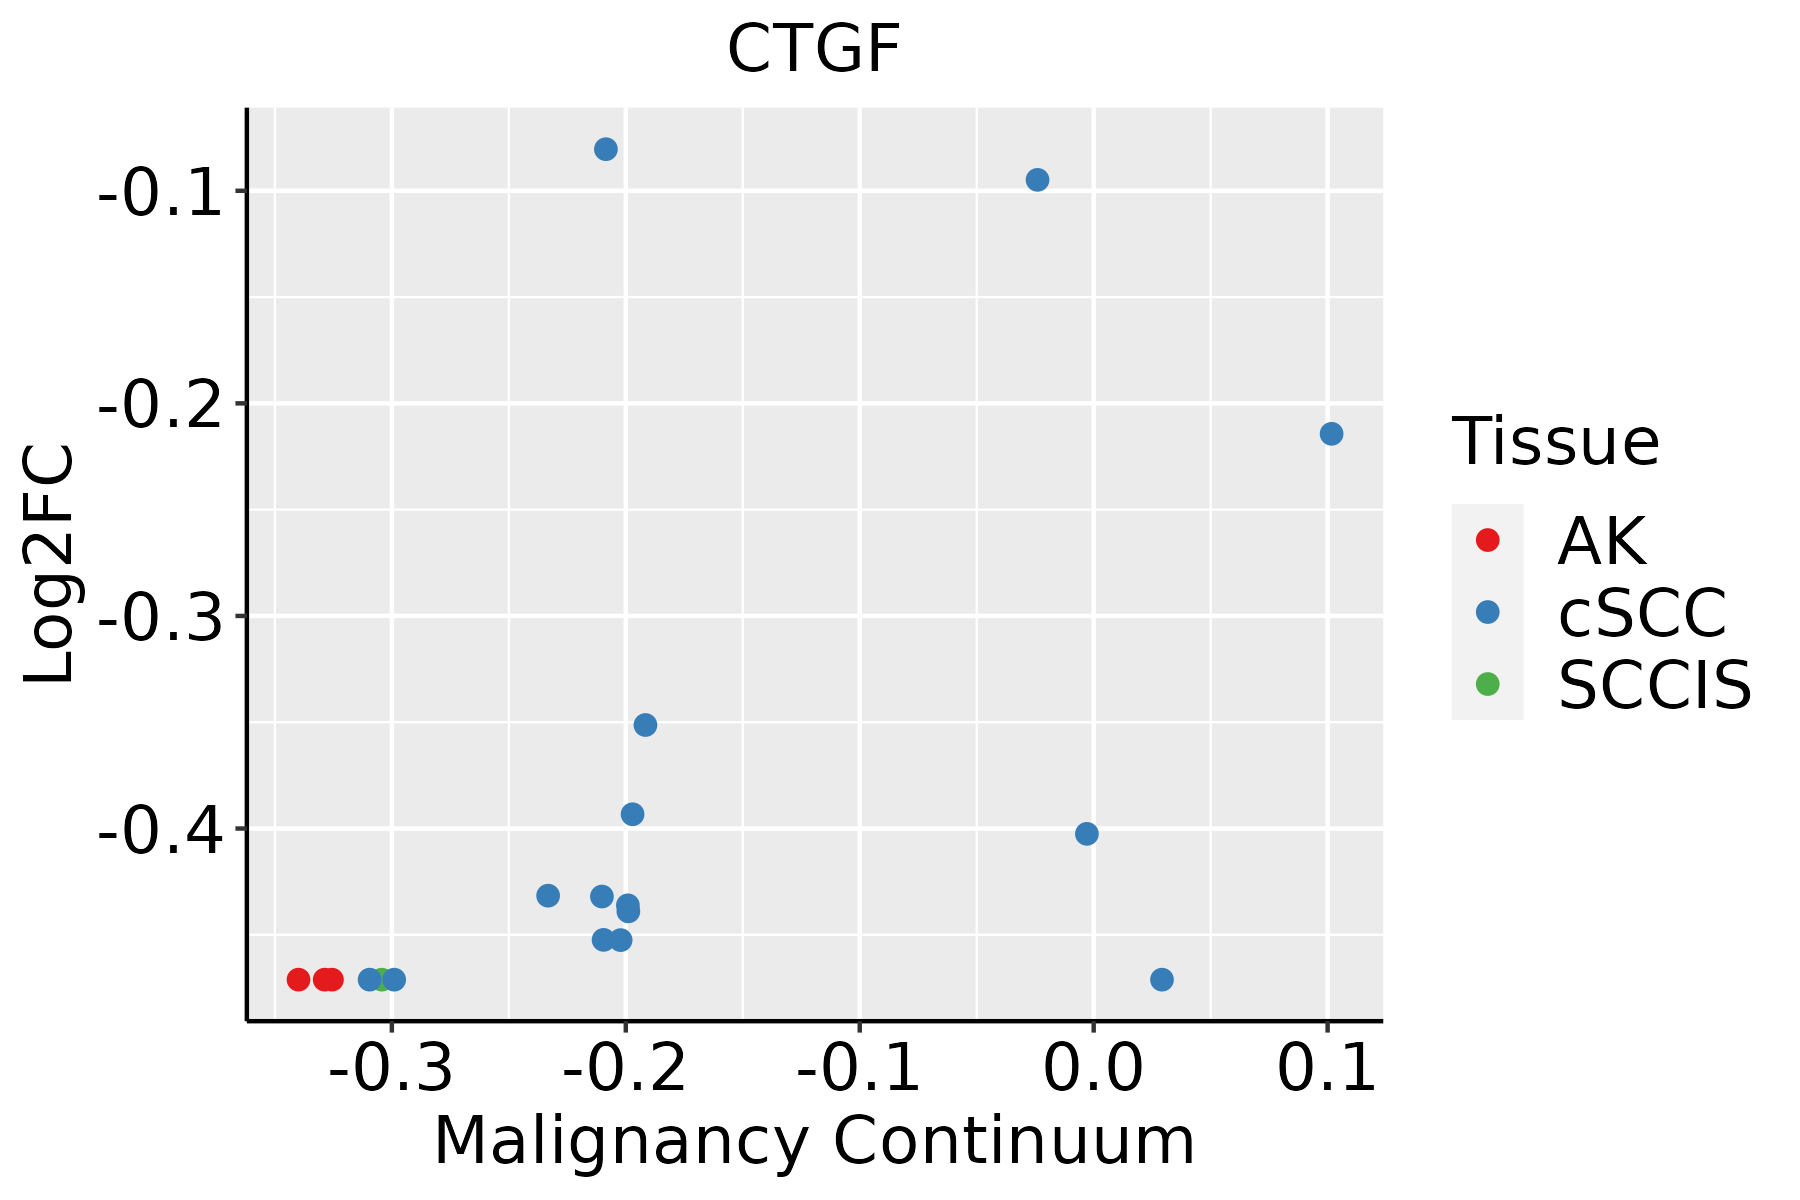 | AK: Actinic keratosis |
| cSCC: Cutaneous squamous cell carcinoma | ||
| SCCIS:squamous cell carcinoma in situ | ||
| Thyroid |  | ATC: Anaplastic thyroid cancer |
| HT: Hashimoto's thyroiditis | ||
| PTC: Papillary thyroid cancer |
| ∗log2FC in expression of this searched gene in stem-like cells from each diseased tissue sample relative to stem-like cells in normal samples in each tissue plotted against the malignancy continuum. Samples are colored based on if they are from different disease stage. |
Top |
Malignant transformation related pathway analysis |
| Find out the enriched GO biological processes and KEGG pathways involved in transition from healthy to precancer to cancer |
| Tissue | Disease Stage | Enriched GO biological Processes |
| Colorectum | AD |  |
| Colorectum | SER |  |
| Colorectum | MSS |  |
| Colorectum | MSI-H |  |
| Colorectum | FAP |  |
| ∗Top 15 enriched GO BP terms are showed in the bar plot of each disease state in each tissue. Each row represents a significant GO biological process which is colored according to the -log10(p.adjust). |
| Page: 1 2 3 4 5 6 7 8 9 |
| GO ID | Tissue | Disease Stage | Description | Gene Ratio | Bg Ratio | pvalue | p.adjust | Count |
| Page: 1 |
| Pathway ID | Tissue | Disease Stage | Description | Gene Ratio | Bg Ratio | pvalue | p.adjust | qvalue | Count |
| hsa043909 | Endometrium | AEH | Hippo signaling pathway | 38/1197 | 157/8465 | 4.79e-04 | 3.38e-03 | 2.47e-03 | 38 |
| hsa0439014 | Endometrium | AEH | Hippo signaling pathway | 38/1197 | 157/8465 | 4.79e-04 | 3.38e-03 | 2.47e-03 | 38 |
| hsa0439023 | Endometrium | EEC | Hippo signaling pathway | 39/1237 | 157/8465 | 4.54e-04 | 3.47e-03 | 2.59e-03 | 39 |
| hsa0439033 | Endometrium | EEC | Hippo signaling pathway | 39/1237 | 157/8465 | 4.54e-04 | 3.47e-03 | 2.59e-03 | 39 |
| Page: 1 |
Top |
Cell-cell communication analysis |
| Identification of potential cell-cell interactions between two cell types and their ligand-receptor pairs for different disease states |
| Ligand | Receptor | LRpair | Pathway | Tissue | Disease Stage |
| Page: 1 |
Top |
Single-cell gene regulatory network inference analysis |
| Find out the significant the regulons (TFs) and the target genes of each regulon across cell types for different disease states |
| TF | Cell Type | Tissue | Disease Stage | Target Gene | RSS | Regulon Activity |
| ∗The dot plots of a searched regulon are shown for all cell subpopulations in each disease state of each tissue based on the regulon specific score inferred using pySCENIC and by calculating the average expression. |
| Page: 1 |
Top |
Somatic mutation of malignant transformation related genes |
| Annotation of somatic variants for genes involved in malignant transformation |
| Hugo Symbol | Variant Class | Variant Classification | dbSNP RS | HGVSc | HGVSp | HGVSp Short | SWISSPROT | BIOTYPE | SIFT | PolyPhen | Tumor Sample Barcode | Tissue | Histology | Sex | Age | Stage | Therapy Types | Drugs | Outcome |
| CTGF | SNV | Missense_Mutation | novel | c.773N>A | p.Arg258His | p.R258H | P29279 | protein_coding | deleterious(0) | probably_damaging(1) | TCGA-A2-A0EW-01 | Breast | breast invasive carcinoma | Female | <65 | III/IV | Chemotherapy | adriamycin | PD |
| CTGF | SNV | Missense_Mutation | c.691G>C | p.Glu231Gln | p.E231Q | P29279 | protein_coding | tolerated(0.09) | probably_damaging(1) | TCGA-A2-A0YK-01 | Breast | breast invasive carcinoma | Female | <65 | I/II | Chemotherapy | cytoxan | SD | |
| CTGF | SNV | Missense_Mutation | c.526N>T | p.Gly176Trp | p.G176W | P29279 | protein_coding | deleterious(0) | probably_damaging(0.994) | TCGA-AO-A128-01 | Breast | breast invasive carcinoma | Female | <65 | I/II | Chemotherapy | doxorubicin | SD | |
| CTGF | SNV | Missense_Mutation | rs754080279 | c.907G>T | p.Val303Leu | p.V303L | P29279 | protein_coding | deleterious(0) | possibly_damaging(0.511) | TCGA-AR-A0TQ-01 | Breast | breast invasive carcinoma | Female | <65 | III/IV | Chemotherapy | doxorubicin | SD |
| CTGF | SNV | Missense_Mutation | rs754080279 | c.907N>T | p.Val303Leu | p.V303L | P29279 | protein_coding | deleterious(0) | possibly_damaging(0.511) | TCGA-AR-A0U3-01 | Breast | breast invasive carcinoma | Female | <65 | I/II | Chemotherapy | doxorubicin | SD |
| CTGF | SNV | Missense_Mutation | novel | c.734N>C | p.Asp245Ala | p.D245A | P29279 | protein_coding | tolerated(0.34) | benign(0.001) | TCGA-B6-A0I8-01 | Breast | breast invasive carcinoma | Female | <65 | I/II | Unknown | Unknown | PD |
| CTGF | SNV | Missense_Mutation | rs754080279 | c.907N>T | p.Val303Leu | p.V303L | P29279 | protein_coding | deleterious(0) | possibly_damaging(0.511) | TCGA-BH-A0BW-01 | Breast | breast invasive carcinoma | Female | >=65 | I/II | Chemotherapy | adriamycin | CR |
| CTGF | SNV | Missense_Mutation | rs754080279 | c.907N>T | p.Val303Leu | p.V303L | P29279 | protein_coding | deleterious(0) | possibly_damaging(0.511) | TCGA-BH-A0H0-01 | Breast | breast invasive carcinoma | Female | >=65 | I/II | Hormone Therapy | arimidex | SD |
| CTGF | SNV | Missense_Mutation | rs754080279 | c.907G>T | p.Val303Leu | p.V303L | P29279 | protein_coding | deleterious(0) | possibly_damaging(0.511) | TCGA-BH-A0HB-01 | Breast | breast invasive carcinoma | Female | <65 | I/II | Chemotherapy | docetaxel | SD |
| CTGF | SNV | Missense_Mutation | rs754080279 | c.907N>T | p.Val303Leu | p.V303L | P29279 | protein_coding | deleterious(0) | possibly_damaging(0.511) | TCGA-C8-A130-01 | Breast | breast invasive carcinoma | Female | <65 | III/IV | Unknown | Unknown | SD |
| Page: 1 2 3 4 5 |
Top |
Related drugs of malignant transformation related genes |
| Identification of chemicals and drugs interact with genes involved in malignant transfromation |
| (DGIdb 4.0) |
| Entrez ID | Symbol | Category | Interaction Types | Drug Claim Name | Drug Name | PMIDs |
| Page: 1 |

Copyright 2023-Present -The University of Texas Health Science Center at Houston |