
|
|||||
|
 | |
| |
| |
| |
| |
| |
|
Gene: CPSF3 |
Gene summary for CPSF3 |
| Gene information | Species | Human | Gene symbol | CPSF3 | Gene ID | 51692 |
| Gene name | cleavage and polyadenylation specific factor 3 | |
| Gene Alias | CPSF-73 | |
| Cytomap | 2p25.1 | |
| Gene Type | protein-coding | GO ID | GO:0006139 | UniProtAcc | G5E9W3 |
Top |
Malignant transformation analysis |
| Identification of the aberrant gene expression in precancerous and cancerous lesions by comparing the gene expression of stem-like cells in diseased tissues with normal stem cells |
| Entrez ID | Symbol | Replicates | Species | Organ | Tissue | Adj P-value | Log2FC | Malignancy |
| 51692 | CPSF3 | HCC1 | Human | Liver | HCC | 1.16e-07 | 3.86e+00 | 0.5336 |
| 51692 | CPSF3 | HCC2 | Human | Liver | HCC | 4.86e-15 | 3.90e+00 | 0.5341 |
| 51692 | CPSF3 | S014 | Human | Liver | HCC | 1.49e-15 | 6.25e-01 | 0.2254 |
| 51692 | CPSF3 | S015 | Human | Liver | HCC | 7.70e-12 | 6.36e-01 | 0.2375 |
| 51692 | CPSF3 | S016 | Human | Liver | HCC | 2.36e-14 | 5.62e-01 | 0.2243 |
| 51692 | CPSF3 | S027 | Human | Liver | HCC | 1.74e-05 | 6.19e-01 | 0.2446 |
| 51692 | CPSF3 | S028 | Human | Liver | HCC | 4.44e-03 | 4.15e-01 | 0.2503 |
| 51692 | CPSF3 | S029 | Human | Liver | HCC | 3.21e-05 | 4.24e-01 | 0.2581 |
| 51692 | CPSF3 | C04 | Human | Oral cavity | OSCC | 3.49e-03 | 4.00e-01 | 0.2633 |
| 51692 | CPSF3 | C21 | Human | Oral cavity | OSCC | 1.54e-05 | 3.93e-01 | 0.2678 |
| 51692 | CPSF3 | C30 | Human | Oral cavity | OSCC | 5.40e-15 | 7.91e-01 | 0.3055 |
| 51692 | CPSF3 | C38 | Human | Oral cavity | OSCC | 1.07e-05 | 6.76e-01 | 0.172 |
| 51692 | CPSF3 | C43 | Human | Oral cavity | OSCC | 4.45e-28 | 5.91e-01 | 0.1704 |
| 51692 | CPSF3 | C46 | Human | Oral cavity | OSCC | 1.66e-30 | 7.51e-01 | 0.1673 |
| 51692 | CPSF3 | C06 | Human | Oral cavity | OSCC | 2.44e-04 | 8.82e-01 | 0.2699 |
| 51692 | CPSF3 | C08 | Human | Oral cavity | OSCC | 1.82e-29 | 7.00e-01 | 0.1919 |
| 51692 | CPSF3 | LN38 | Human | Oral cavity | OSCC | 6.01e-03 | 6.27e-01 | 0.168 |
| 51692 | CPSF3 | LN46 | Human | Oral cavity | OSCC | 5.85e-12 | 5.39e-01 | 0.1666 |
| 51692 | CPSF3 | LP15 | Human | Oral cavity | LP | 1.18e-05 | 8.79e-01 | 0.2174 |
| 51692 | CPSF3 | SYSMH1 | Human | Oral cavity | OSCC | 4.48e-02 | 1.21e-01 | 0.1127 |
| Page: 1 2 3 4 5 |
| Tissue | Expression Dynamics | Abbreviation |
| Esophagus |  | ESCC: Esophageal squamous cell carcinoma |
| HGIN: High-grade intraepithelial neoplasias | ||
| LGIN: Low-grade intraepithelial neoplasias | ||
| Liver | 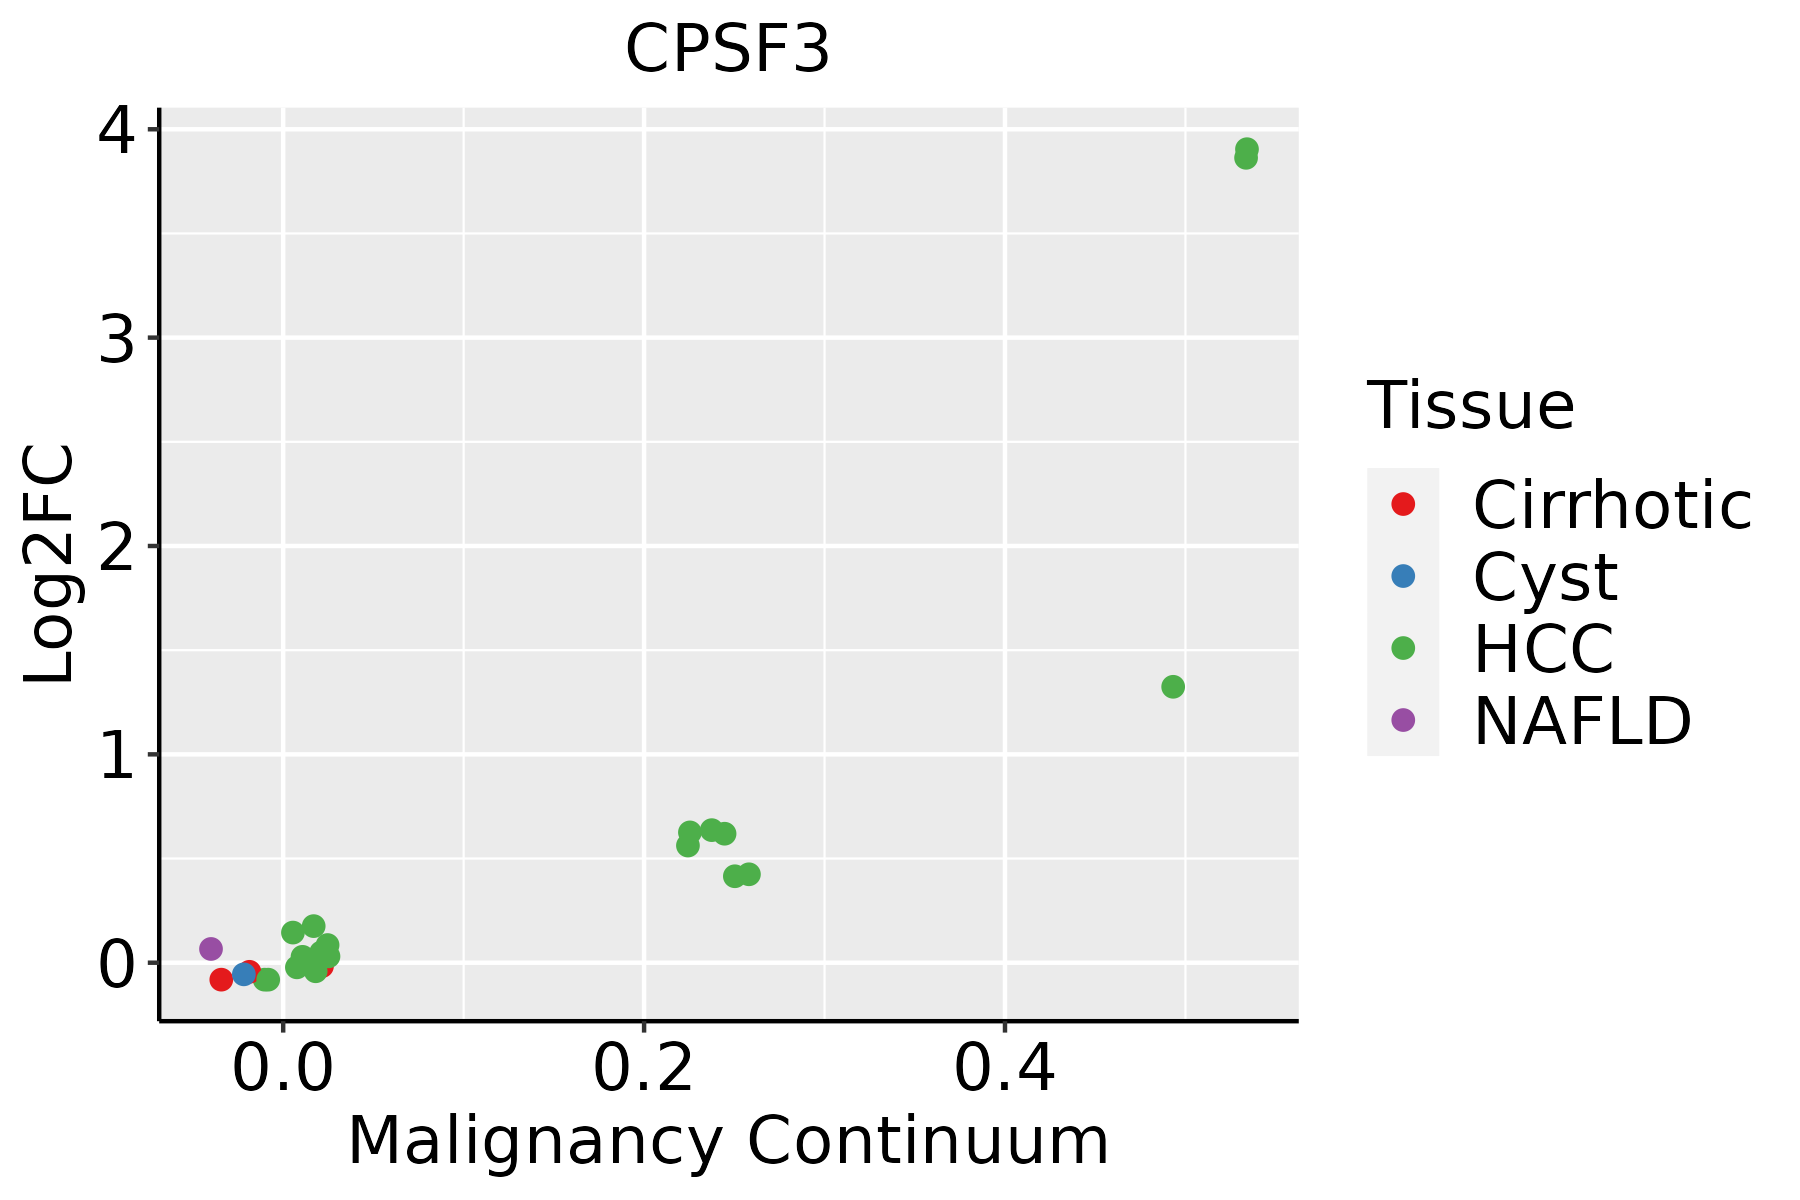 | HCC: Hepatocellular carcinoma |
| NAFLD: Non-alcoholic fatty liver disease | ||
| Oral Cavity | 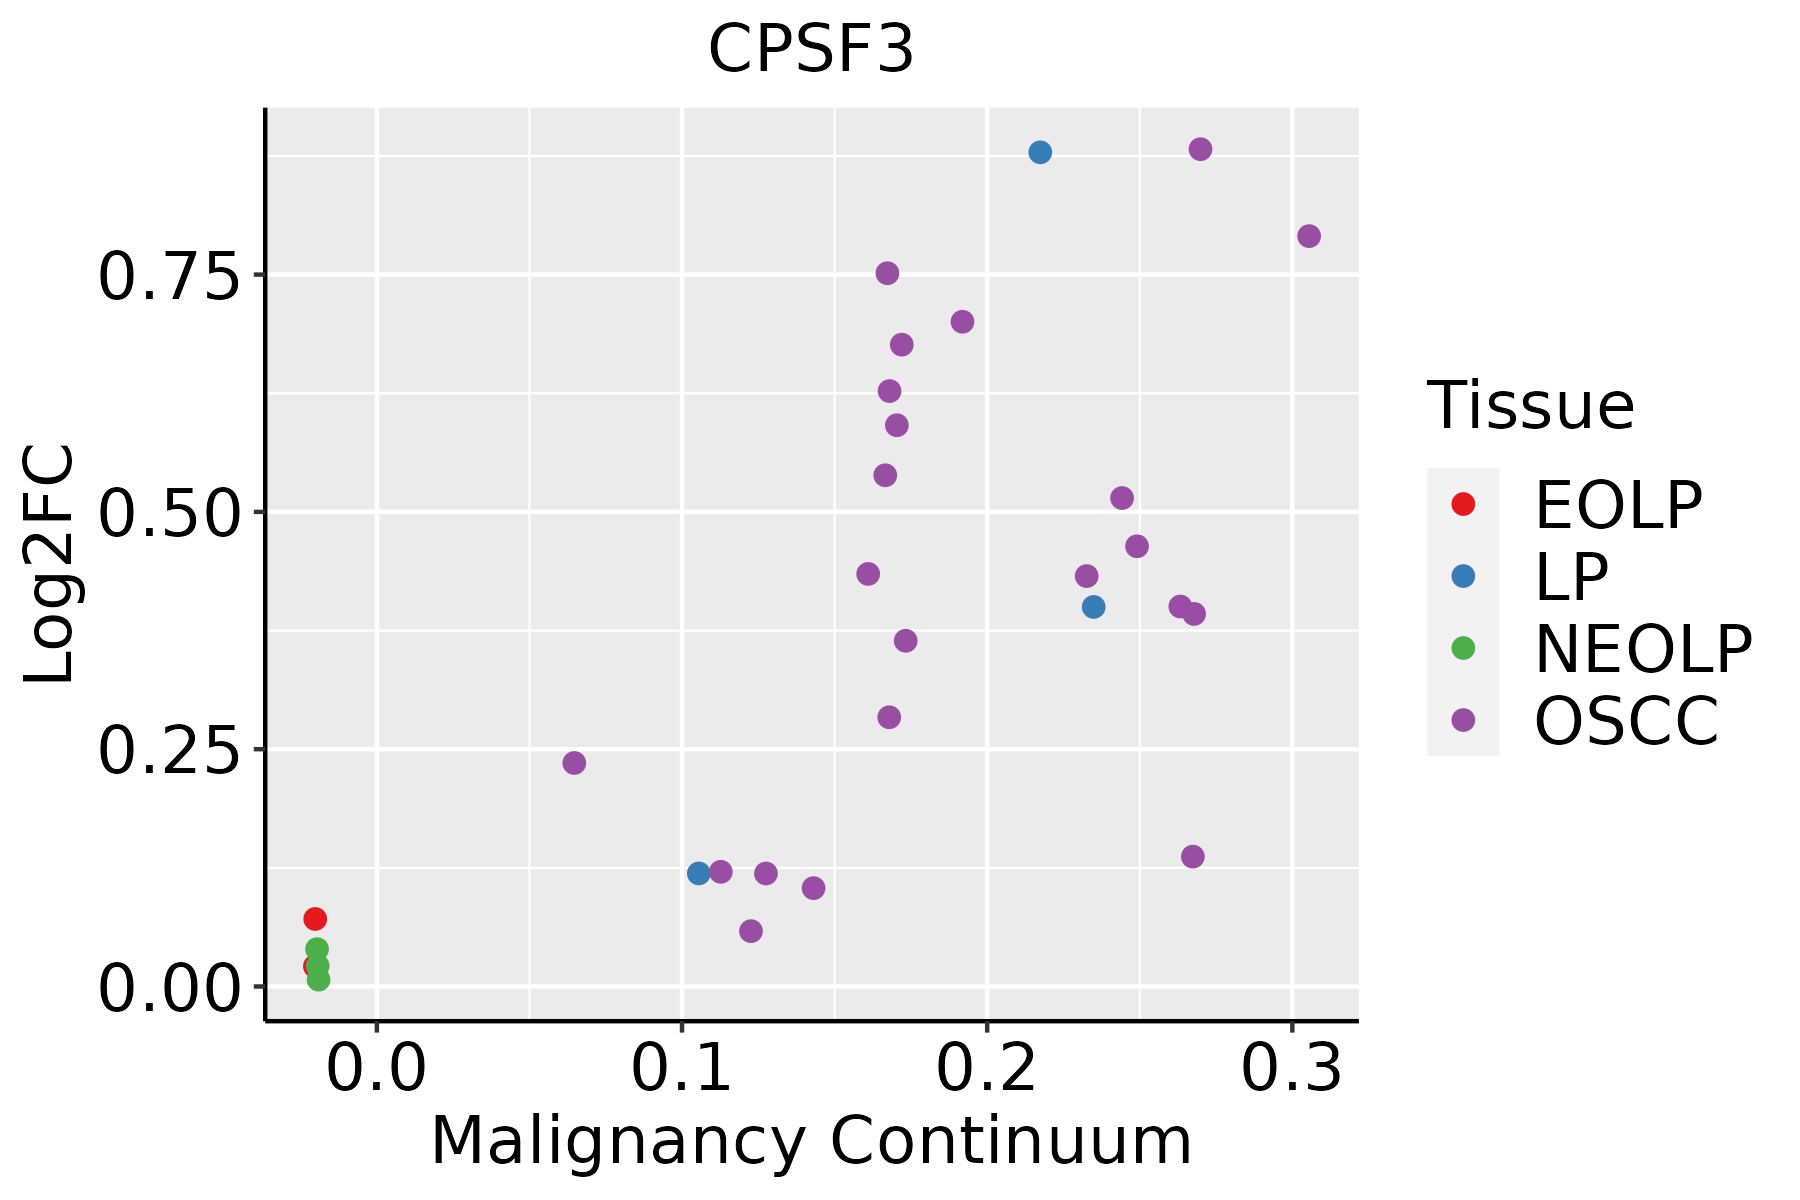 | EOLP: Erosive Oral lichen planus |
| LP: leukoplakia | ||
| NEOLP: Non-erosive oral lichen planus | ||
| OSCC: Oral squamous cell carcinoma | ||
| Skin |  | AK: Actinic keratosis |
| cSCC: Cutaneous squamous cell carcinoma | ||
| SCCIS:squamous cell carcinoma in situ |
| ∗log2FC in expression of this searched gene in stem-like cells from each diseased tissue sample relative to stem-like cells in normal samples in each tissue plotted against the malignancy continuum. Samples are colored based on if they are from different disease stage. |
Top |
Malignant transformation related pathway analysis |
| Find out the enriched GO biological processes and KEGG pathways involved in transition from healthy to precancer to cancer |
| Tissue | Disease Stage | Enriched GO biological Processes |
| Colorectum | AD |  |
| Colorectum | SER |  |
| Colorectum | MSS |  |
| Colorectum | MSI-H |  |
| Colorectum | FAP |  |
| ∗Top 15 enriched GO BP terms are showed in the bar plot of each disease state in each tissue. Each row represents a significant GO biological process which is colored according to the -log10(p.adjust). |
| Page: 1 2 3 4 5 6 7 8 9 |
| GO ID | Tissue | Disease Stage | Description | Gene Ratio | Bg Ratio | pvalue | p.adjust | Count |
| GO:00905013 | Esophagus | ESCC | RNA phosphodiester bond hydrolysis | 110/8552 | 152/18723 | 1.95e-11 | 6.81e-10 | 110 |
| GO:00903053 | Esophagus | ESCC | nucleic acid phosphodiester bond hydrolysis | 163/8552 | 261/18723 | 3.07e-08 | 5.73e-07 | 163 |
| GO:00905033 | Esophagus | ESCC | RNA phosphodiester bond hydrolysis, exonucleolytic | 35/8552 | 42/18723 | 5.35e-07 | 7.11e-06 | 35 |
| GO:003112412 | Esophagus | ESCC | mRNA 3'-end processing | 47/8552 | 62/18723 | 1.29e-06 | 1.58e-05 | 47 |
| GO:00311233 | Esophagus | ESCC | RNA 3'-end processing | 76/8552 | 116/18723 | 1.25e-05 | 1.15e-04 | 76 |
| GO:00063783 | Esophagus | ESCC | mRNA polyadenylation | 33/8552 | 44/18723 | 7.30e-05 | 5.49e-04 | 33 |
| GO:00905023 | Esophagus | ESCC | RNA phosphodiester bond hydrolysis, endonucleolytic | 55/8552 | 82/18723 | 7.34e-05 | 5.51e-04 | 55 |
| GO:00436313 | Esophagus | ESCC | RNA polyadenylation | 33/8552 | 45/18723 | 1.54e-04 | 1.02e-03 | 33 |
| GO:00063793 | Esophagus | ESCC | mRNA cleavage | 17/8552 | 22/18723 | 2.60e-03 | 1.11e-02 | 17 |
| GO:00311241 | Liver | HCC | mRNA 3'-end processing | 50/7958 | 62/18723 | 8.44e-10 | 2.60e-08 | 50 |
| GO:00905011 | Liver | HCC | RNA phosphodiester bond hydrolysis | 101/7958 | 152/18723 | 1.99e-09 | 5.63e-08 | 101 |
| GO:00311231 | Liver | HCC | RNA 3'-end processing | 81/7958 | 116/18723 | 2.27e-09 | 6.32e-08 | 81 |
| GO:0090305 | Liver | HCC | nucleic acid phosphodiester bond hydrolysis | 152/7958 | 261/18723 | 1.90e-07 | 3.46e-06 | 152 |
| GO:0006378 | Liver | HCC | mRNA polyadenylation | 35/7958 | 44/18723 | 5.70e-07 | 9.03e-06 | 35 |
| GO:0043631 | Liver | HCC | RNA polyadenylation | 35/7958 | 45/18723 | 1.51e-06 | 2.15e-05 | 35 |
| GO:0090502 | Liver | HCC | RNA phosphodiester bond hydrolysis, endonucleolytic | 52/7958 | 82/18723 | 1.06e-04 | 9.08e-04 | 52 |
| GO:00905031 | Liver | HCC | RNA phosphodiester bond hydrolysis, exonucleolytic | 29/7958 | 42/18723 | 4.57e-04 | 3.04e-03 | 29 |
| GO:0006379 | Liver | HCC | mRNA cleavage | 17/7958 | 22/18723 | 9.84e-04 | 5.70e-03 | 17 |
| GO:0008334 | Liver | HCC | histone mRNA metabolic process | 13/7958 | 17/18723 | 4.77e-03 | 2.02e-02 | 13 |
| GO:00311242 | Oral cavity | OSCC | mRNA 3'-end processing | 49/7305 | 62/18723 | 1.40e-10 | 4.14e-09 | 49 |
| Page: 1 2 3 |
| Pathway ID | Tissue | Disease Stage | Description | Gene Ratio | Bg Ratio | pvalue | p.adjust | qvalue | Count |
| hsa0301524 | Esophagus | ESCC | mRNA surveillance pathway | 72/4205 | 97/8465 | 6.12e-07 | 4.10e-06 | 2.10e-06 | 72 |
| hsa0301534 | Esophagus | ESCC | mRNA surveillance pathway | 72/4205 | 97/8465 | 6.12e-07 | 4.10e-06 | 2.10e-06 | 72 |
| hsa0301521 | Liver | HCC | mRNA surveillance pathway | 66/4020 | 97/8465 | 3.16e-05 | 1.88e-04 | 1.04e-04 | 66 |
| hsa0301531 | Liver | HCC | mRNA surveillance pathway | 66/4020 | 97/8465 | 3.16e-05 | 1.88e-04 | 1.04e-04 | 66 |
| hsa030158 | Oral cavity | OSCC | mRNA surveillance pathway | 75/3704 | 97/8465 | 1.30e-11 | 2.01e-10 | 1.02e-10 | 75 |
| hsa0301513 | Oral cavity | OSCC | mRNA surveillance pathway | 75/3704 | 97/8465 | 1.30e-11 | 2.01e-10 | 1.02e-10 | 75 |
| hsa0301523 | Oral cavity | LP | mRNA surveillance pathway | 50/2418 | 97/8465 | 1.39e-06 | 1.50e-05 | 9.66e-06 | 50 |
| hsa0301533 | Oral cavity | LP | mRNA surveillance pathway | 50/2418 | 97/8465 | 1.39e-06 | 1.50e-05 | 9.66e-06 | 50 |
| Page: 1 |
Top |
Cell-cell communication analysis |
| Identification of potential cell-cell interactions between two cell types and their ligand-receptor pairs for different disease states |
| Ligand | Receptor | LRpair | Pathway | Tissue | Disease Stage |
| Page: 1 |
Top |
Single-cell gene regulatory network inference analysis |
| Find out the significant the regulons (TFs) and the target genes of each regulon across cell types for different disease states |
| TF | Cell Type | Tissue | Disease Stage | Target Gene | RSS | Regulon Activity |
| ∗The dot plots of a searched regulon are shown for all cell subpopulations in each disease state of each tissue based on the regulon specific score inferred using pySCENIC and by calculating the average expression. |
| Page: 1 |
Top |
Somatic mutation of malignant transformation related genes |
| Annotation of somatic variants for genes involved in malignant transformation |
| Hugo Symbol | Variant Class | Variant Classification | dbSNP RS | HGVSc | HGVSp | HGVSp Short | SWISSPROT | BIOTYPE | SIFT | PolyPhen | Tumor Sample Barcode | Tissue | Histology | Sex | Age | Stage | Therapy Types | Drugs | Outcome |
| CPSF3 | SNV | Missense_Mutation | c.1800N>T | p.Lys600Asn | p.K600N | Q9UKF6 | protein_coding | tolerated(0.46) | benign(0.001) | TCGA-A8-A09Z-01 | Breast | breast invasive carcinoma | Female | >=65 | I/II | Unknown | Unknown | SD | |
| CPSF3 | SNV | Missense_Mutation | novel | c.1903N>A | p.Leu635Ile | p.L635I | Q9UKF6 | protein_coding | tolerated(0.22) | benign(0.007) | TCGA-AN-A046-01 | Breast | breast invasive carcinoma | Female | >=65 | I/II | Unknown | Unknown | SD |
| CPSF3 | SNV | Missense_Mutation | c.1620A>C | p.Leu540Phe | p.L540F | Q9UKF6 | protein_coding | tolerated(0.46) | benign(0.013) | TCGA-BH-A1EN-01 | Breast | breast invasive carcinoma | Female | >=65 | I/II | Unknown | Unknown | SD | |
| CPSF3 | SNV | Missense_Mutation | c.1969N>C | p.Glu657Gln | p.E657Q | Q9UKF6 | protein_coding | tolerated(0.27) | benign(0.097) | TCGA-BH-A1FN-01 | Breast | breast invasive carcinoma | Female | <65 | I/II | Unknown | Unknown | PD | |
| CPSF3 | SNV | Missense_Mutation | novel | c.289N>G | p.His97Asp | p.H97D | Q9UKF6 | protein_coding | deleterious(0) | probably_damaging(0.947) | TCGA-BH-A2L8-01 | Breast | breast invasive carcinoma | Female | <65 | I/II | Chemotherapy | cytoxan | CR |
| CPSF3 | insertion | Frame_Shift_Ins | novel | c.171_172insCCTCAAGCAGTATCTGTCA | p.Leu58ProfsTer9 | p.L58Pfs*9 | Q9UKF6 | protein_coding | TCGA-A8-A09M-01 | Breast | breast invasive carcinoma | Female | >=65 | III/IV | Chemotherapy | paclitaxel | CR | ||
| CPSF3 | insertion | Frame_Shift_Ins | novel | c.173_174insACCTCACGCACCTTCATGTTTTCTG | p.Ile59ProfsTer10 | p.I59Pfs*10 | Q9UKF6 | protein_coding | TCGA-A8-A09M-01 | Breast | breast invasive carcinoma | Female | >=65 | III/IV | Chemotherapy | paclitaxel | CR | ||
| CPSF3 | deletion | Frame_Shift_Del | c.1654delN | p.Asn553IlefsTer4 | p.N553Ifs*4 | Q9UKF6 | protein_coding | TCGA-AN-A0AK-01 | Breast | breast invasive carcinoma | Female | >=65 | I/II | Unknown | Unknown | SD | |||
| CPSF3 | insertion | Frame_Shift_Ins | novel | c.451_452insG | p.Phe151CysfsTer18 | p.F151Cfs*18 | Q9UKF6 | protein_coding | TCGA-AO-A0J5-01 | Breast | breast invasive carcinoma | Female | <65 | III/IV | Other, specify in notesBisphosphonate | zoledronic | PD | ||
| CPSF3 | insertion | Nonsense_Mutation | novel | c.452_453insACATTGTAAAAAAGTGTAAGTTTATTGGAC | p.Phe151delinsLeuHisCysLysLysValTerValTyrTrpThr | p.F151delinsLHCKKV*VYWT | Q9UKF6 | protein_coding | TCGA-AO-A0J5-01 | Breast | breast invasive carcinoma | Female | <65 | III/IV | Other, specify in notesBisphosphonate | zoledronic | PD |
| Page: 1 2 3 4 5 6 7 |
Top |
Related drugs of malignant transformation related genes |
| Identification of chemicals and drugs interact with genes involved in malignant transfromation |
| (DGIdb 4.0) |
| Entrez ID | Symbol | Category | Interaction Types | Drug Claim Name | Drug Name | PMIDs |
| Page: 1 |

Copyright 2023-Present -The University of Texas Health Science Center at Houston |