Schematic overview of the cellular and molecular mechanisms involved in the cancer progression, including the proposed cellular and molecular mechanisms in cancer cells trajectory. AT1: alveolar type 1 cells; AT2: alveolar type 2 cells; AAH: atypical adenomatous hyperplasia; AIS: adenocarcinoma in situ; MIA: minimally invasive adenocarcinoma; IA: invasive adenocarcinoma; EMT: epithelial-mesenchymal transition

Home

Download

Statistics

Help

Contact

Center for Computational Systems Medicine
leaf

Gene summary

leaf

Malignant transformation analysis

leaf

Malignant transformation related pathway analysis

leaf

Cell-cell communication analysis

leaf

Single-cell gene regulatory network inference analysis

leaf

Somatic mutation of malignant transformation related genes

leaf

Related drugs of malignant transformation related genes

Gene: CPQ

Gene summary for CPQ

check button Gene summary.

Gene informationSpeciesHuman
Gene symbol

CPQ

Gene ID

10404

Gene namecarboxypeptidase Q
Gene AliasLDP
Cytomap8q22.1
Gene Typeprotein-coding
GO ID

GO:0006508

UniProtAcc

A0A024R9B8


Top

Malignant transformation analysis

check button Identification of the aberrant gene expression in precancerous and cancerous lesions by comparing the gene expression of stem-like cells in diseased tissues with normal stem cells
check button Malignant transformation involving gene list.
Entrez IDSymbolReplicatesSpeciesOrganTissueAdj P-valueLog2FCMalignancy
10404CPQP75T-EHumanEsophagusESCC2.94e-025.20e-020.1125
10404CPQP76T-EHumanEsophagusESCC6.83e-193.72e-010.1207
10404CPQP79T-EHumanEsophagusESCC2.59e-101.06e-010.1154
10404CPQP80T-EHumanEsophagusESCC1.29e-092.90e-010.155
10404CPQP82T-EHumanEsophagusESCC2.25e-033.27e-010.1072
10404CPQP91T-EHumanEsophagusESCC4.03e-042.12e-010.1828
10404CPQP107T-EHumanEsophagusESCC5.39e-101.52e-010.171
10404CPQP130T-EHumanEsophagusESCC3.44e-02-2.56e-020.1676
10404CPQNAFLD1HumanLiverNAFLD2.83e-057.18e-01-0.04
10404CPQS43HumanLiverCirrhotic2.41e-04-1.37e-01-0.0187
10404CPQHCC1_MengHumanLiverHCC2.16e-941.49e-010.0246
10404CPQHCC2_MengHumanLiverHCC7.07e-312.02e-020.0107
10404CPQcirrhotic2HumanLiverCirrhotic6.10e-042.42e-020.0201
10404CPQHCC2HumanLiverHCC2.77e-042.76e+000.5341
10404CPQPt13.aHumanLiverHCC2.98e-022.19e-010.021
10404CPQPt13.bHumanLiverHCC1.98e-263.69e-010.0251
10404CPQPt14.aHumanLiverHCC1.63e-021.33e-010.0169
10404CPQS014HumanLiverHCC1.56e-231.55e+000.2254
10404CPQS015HumanLiverHCC5.59e-271.87e+000.2375
10404CPQS016HumanLiverHCC9.49e-301.36e+000.2243
Page: 1 2 3 4 5 6 

check button Transcriptomic changes along malignancy continuum.
TissueExpression DynamicsAbbreviation
Colorectum (GSE201348)The image shows the transcriptomic changes along malignancy continuum.log2FC in expression of this searched gene in stem-like cells from each diseased tissue sample relative to stem-like cells in normal samples in each tissue plotted against the malignancy continuum. Samples are colored based on if they are from different disease stage.FAP: Familial adenomatous polyposis
CRC: Colorectal cancer
Colorectum (HTA11)The image shows the transcriptomic changes along malignancy continuum.log2FC in expression of this searched gene in stem-like cells from each diseased tissue sample relative to stem-like cells in normal samples in each tissue plotted against the malignancy continuum. Samples are colored based on if they are from different disease stage.AD: Adenomas
SER: Sessile serrated lesions
MSI-H: Microsatellite-high colorectal cancer
MSS: Microsatellite stable colorectal cancer
EsophagusThe image shows the transcriptomic changes along malignancy continuum.log2FC in expression of this searched gene in stem-like cells from each diseased tissue sample relative to stem-like cells in normal samples in each tissue plotted against the malignancy continuum. Samples are colored based on if they are from different disease stage.ESCC: Esophageal squamous cell carcinoma
HGIN: High-grade intraepithelial neoplasias
LGIN: Low-grade intraepithelial neoplasias
LiverThe image shows the transcriptomic changes along malignancy continuum.log2FC in expression of this searched gene in stem-like cells from each diseased tissue sample relative to stem-like cells in normal samples in each tissue plotted against the malignancy continuum. Samples are colored based on if they are from different disease stage.
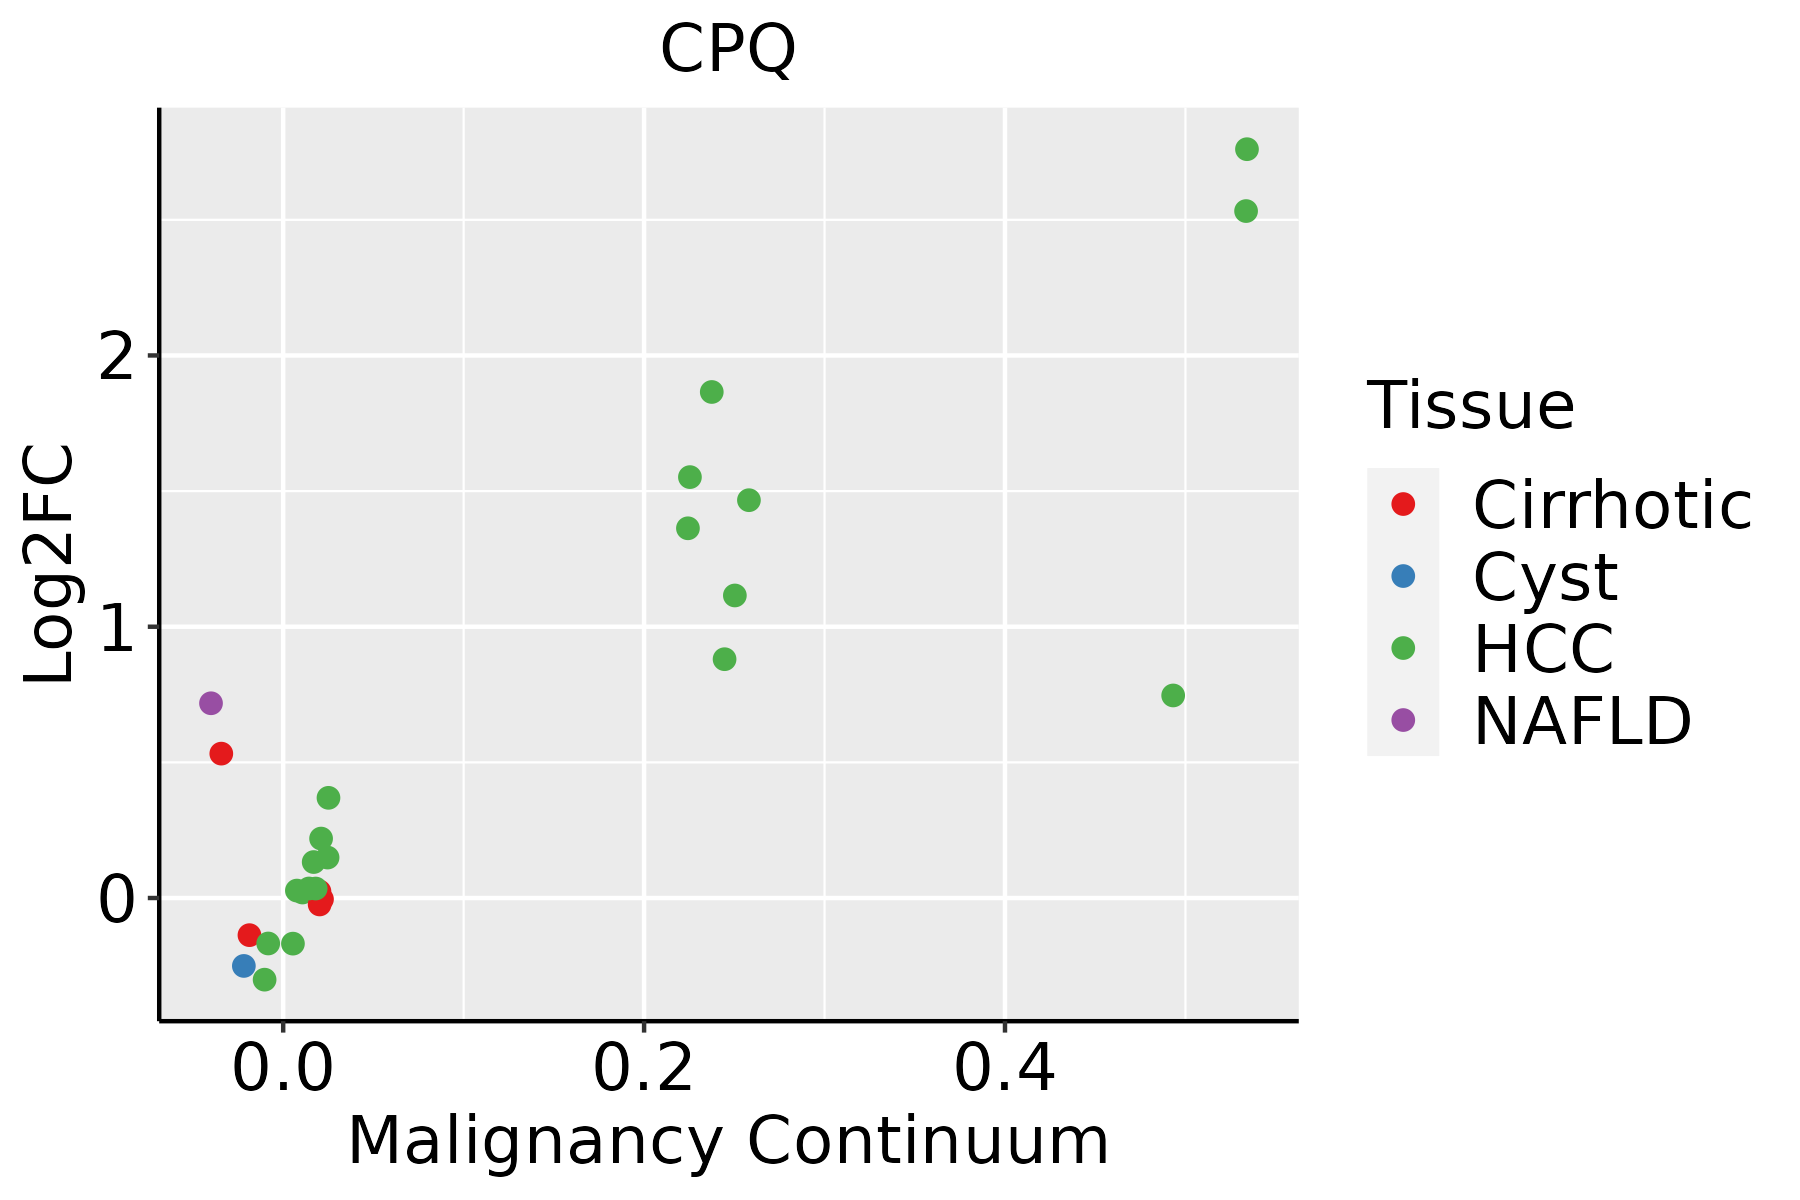
HCC: Hepatocellular carcinoma
NAFLD: Non-alcoholic fatty liver disease
Oral CavityThe image shows the transcriptomic changes along malignancy continuum.log2FC in expression of this searched gene in stem-like cells from each diseased tissue sample relative to stem-like cells in normal samples in each tissue plotted against the malignancy continuum. Samples are colored based on if they are from different disease stage.
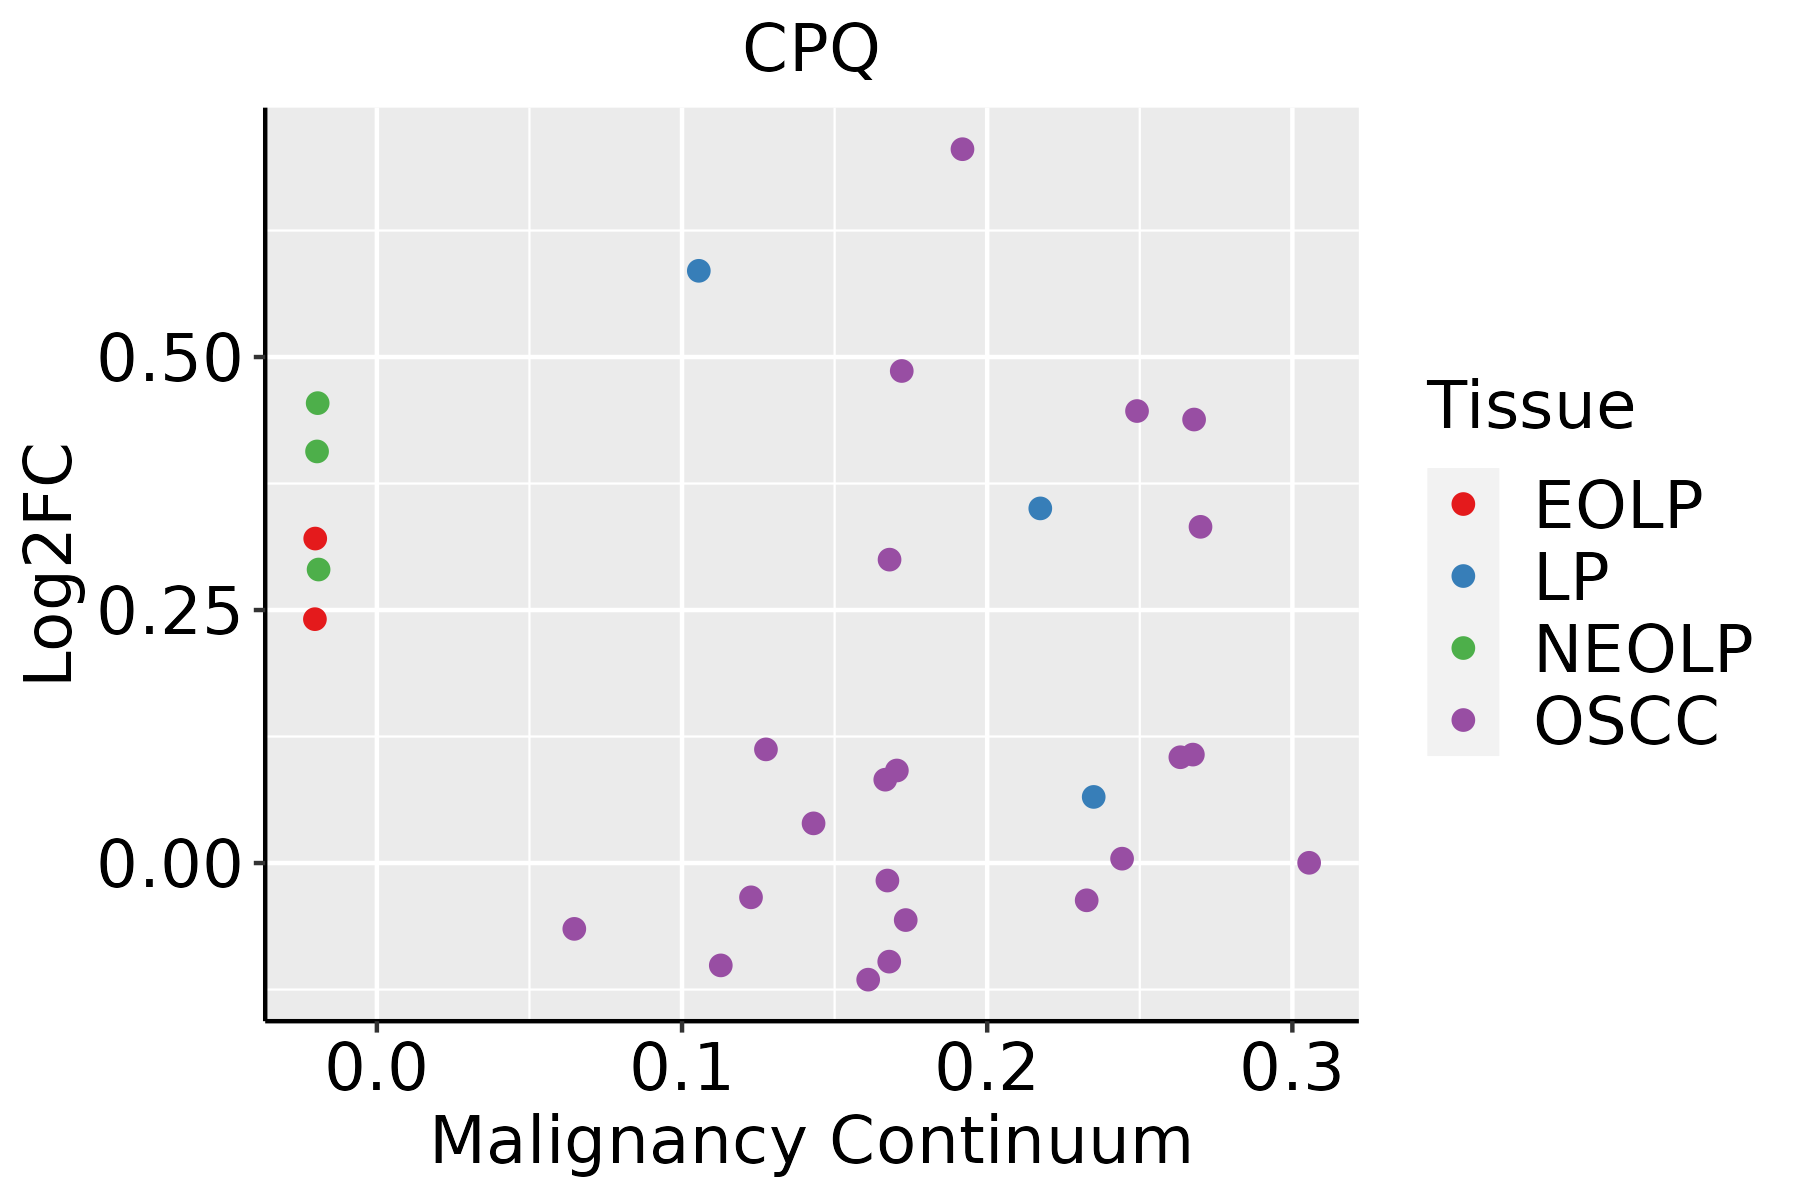
EOLP: Erosive Oral lichen planus
LP: leukoplakia
NEOLP: Non-erosive oral lichen planus
OSCC: Oral squamous cell carcinoma
ThyroidThe image shows the transcriptomic changes along malignancy continuum.log2FC in expression of this searched gene in stem-like cells from each diseased tissue sample relative to stem-like cells in normal samples in each tissue plotted against the malignancy continuum. Samples are colored based on if they are from different disease stage.
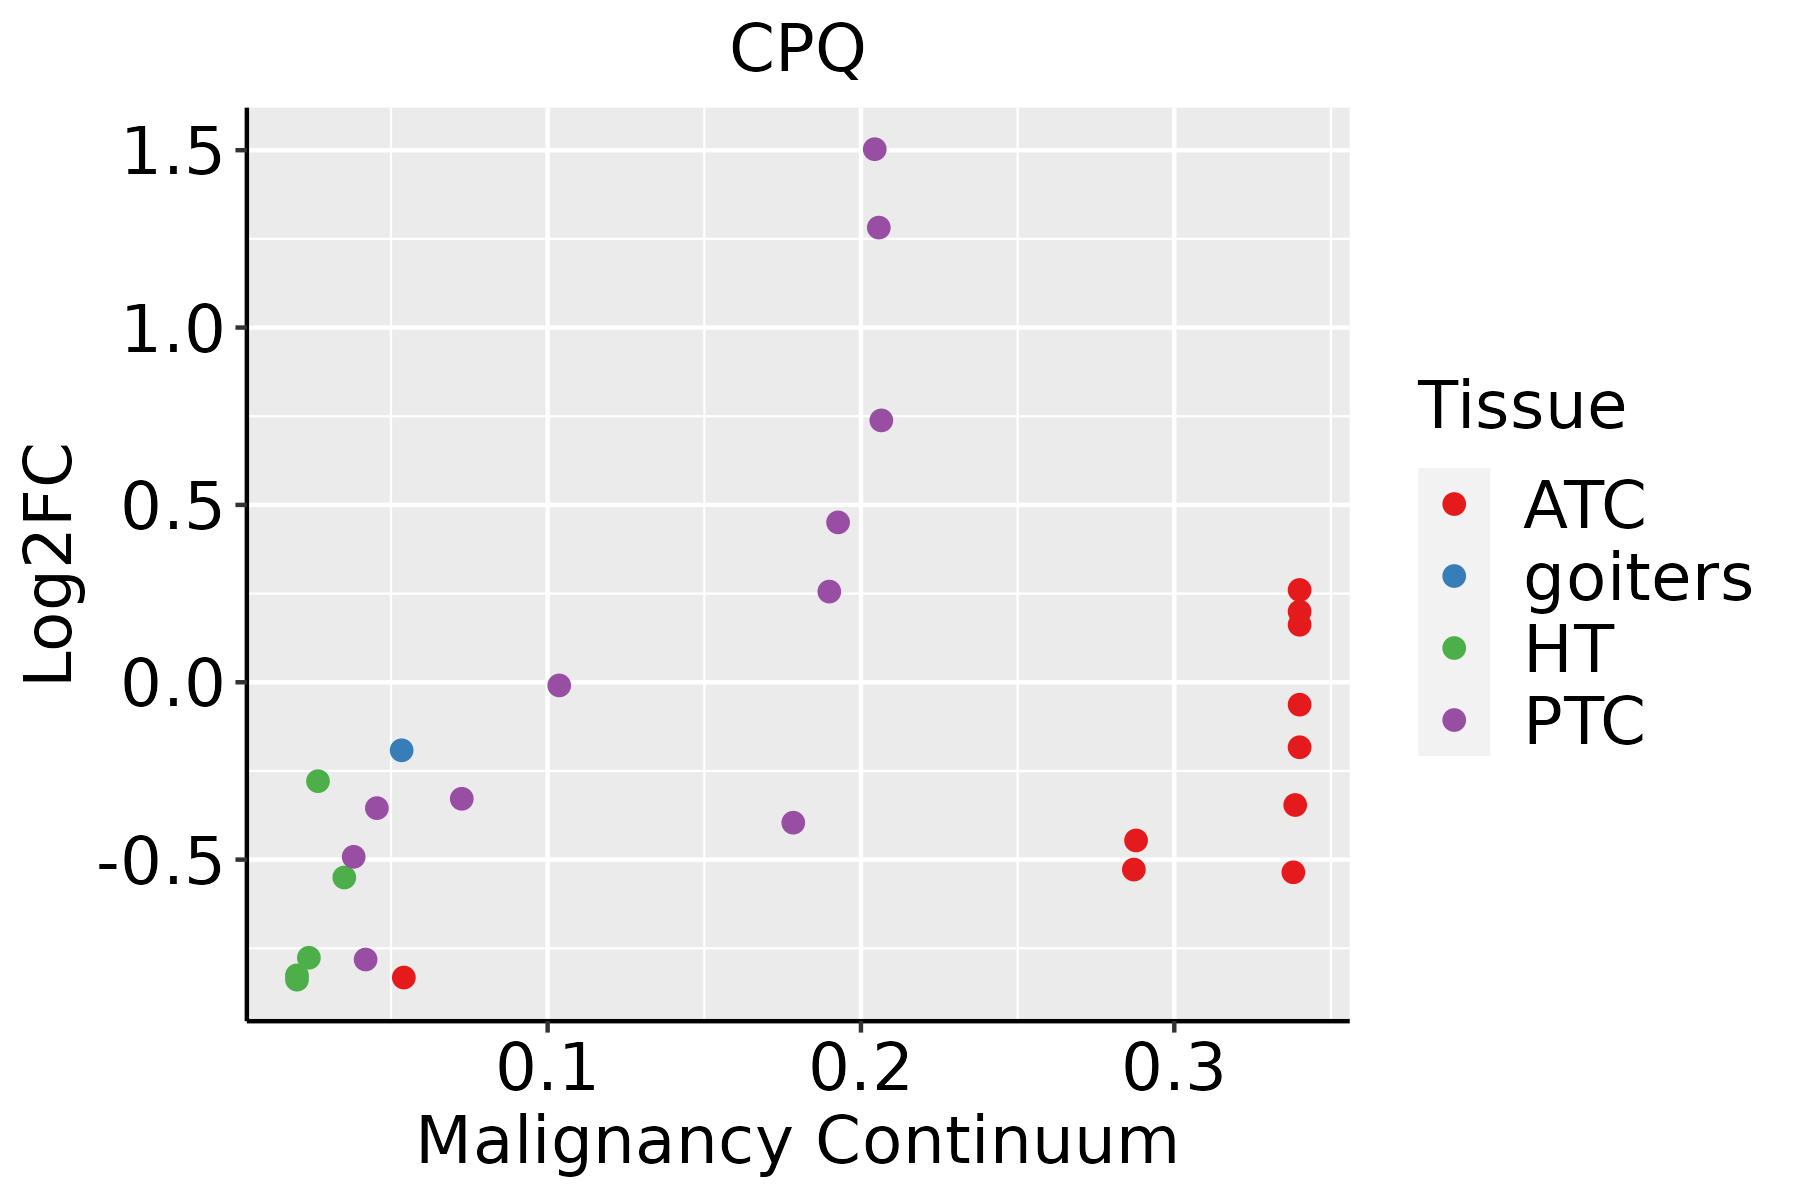
ATC: Anaplastic thyroid cancer
HT: Hashimoto's thyroiditis
PTC: Papillary thyroid cancer
∗log2FC in expression of this searched gene in stem-like cells from each diseased tissue sample relative to stem-like cells in normal samples in each tissue plotted against the malignancy continuum. Samples are colored based on if they are from different disease stage.

Top

Malignant transformation related pathway analysis

check buttonFind out the enriched GO biological processes and KEGG pathways involved in transition from healthy to precancer to cancer
check button Figure of enriched GO biological processes.
TissueDisease StageEnriched GO biological Processes
ColorectumADGO analysis - Figure of enriched GO biological processes: Top 15 enriched GO BP terms are showed in the bar plot of each disease state in each tissue. Each row represents a significant GO biological process which is colored according to the -log10(p.adjust).
ColorectumSERGO analysis - Figure of enriched GO biological processes: Top 15 enriched GO BP terms are showed in the bar plot of each disease state in each tissue. Each row represents a significant GO biological process which is colored according to the -log10(p.adjust).
ColorectumMSSGO analysis - Figure of enriched GO biological processes: Top 15 enriched GO BP terms are showed in the bar plot of each disease state in each tissue. Each row represents a significant GO biological process which is colored according to the -log10(p.adjust).
ColorectumMSI-HGO analysis - Figure of enriched GO biological processes: Top 15 enriched GO BP terms are showed in the bar plot of each disease state in each tissue. Each row represents a significant GO biological process which is colored according to the -log10(p.adjust).
ColorectumFAPGO analysis - Figure of enriched GO biological processes: Top 15 enriched GO BP terms are showed in the bar plot of each disease state in each tissue. Each row represents a significant GO biological process which is colored according to the -log10(p.adjust).
∗Top 15 enriched GO BP terms are showed in the bar plot of each disease state in each tissue. Each row represents a significant GO biological process which is colored according to the -log10(p.adjust).
Page: 1 2 3 4 5 6 7 8 9 

check button Enriched GO biological processes.
GO IDTissueDisease StageDescriptionGene RatioBg Ratiopvaluep.adjustCount
GO:0006575ColorectumADcellular modified amino acid metabolic process59/3918188/187234.80e-045.27e-0359
GO:00065751ColorectumMSScellular modified amino acid metabolic process55/3467188/187232.16e-043.01e-0355
GO:0031099ColorectumMSSregeneration51/3467198/187236.99e-034.49e-0251
GO:003109910EsophagusESCCregeneration122/8552198/187234.26e-064.57e-05122
GO:00065757EsophagusESCCcellular modified amino acid metabolic process112/8552188/187238.31e-056.06e-04112
GO:00310993LiverNAFLDregeneration35/1882198/187236.67e-048.61e-0335
GO:00424452LiverNAFLDhormone metabolic process36/1882218/187231.98e-031.98e-0236
GO:00065754LiverNAFLDcellular modified amino acid metabolic process31/1882188/187233.98e-033.34e-0231
GO:000657511LiverCirrhoticcellular modified amino acid metabolic process70/4634188/187239.04e-059.69e-0470
GO:003109911LiverCirrhoticregeneration71/4634198/187233.02e-042.65e-0371
GO:004244511LiverCirrhotichormone metabolic process73/4634218/187232.22e-031.36e-0273
GO:000657521LiverHCCcellular modified amino acid metabolic process119/7958188/187236.47e-091.67e-07119
GO:00310992LiverHCCregeneration107/7958198/187236.67e-044.12e-03107
GO:00310999Oral cavityOSCCregeneration114/7305198/187238.54e-081.50e-06114
GO:00422464Oral cavityOSCCtissue regeneration42/730572/187236.89e-043.84e-0342
GO:00065756Oral cavityOSCCcellular modified amino acid metabolic process91/7305188/187235.33e-032.07e-0291
GO:003109916Oral cavityLPregeneration76/4623198/187231.25e-052.24e-0476
GO:00422461Oral cavityLPtissue regeneration30/462372/187231.13e-039.27e-0330
GO:000657512Oral cavityLPcellular modified amino acid metabolic process64/4623188/187232.43e-031.73e-0264
GO:003109923Oral cavityEOLPregeneration50/2218198/187231.30e-074.25e-0650
Page: 1 2 

check button Enriched KEGG pathways.
Pathway IDTissueDisease StageDescriptionGene RatioBg Ratiopvaluep.adjustqvalueCount
Page: 1 

Top

Cell-cell communication analysis

check buttonIdentification of potential cell-cell interactions between two cell types and their ligand-receptor pairs for different disease states
LigandReceptorLRpairPathwayTissueDisease Stage
Page: 1 

Top

Single-cell gene regulatory network inference analysis

check buttonFind out the significant the regulons (TFs) and the target genes of each regulon across cell types for different disease states
TFCell TypeTissueDisease StageTarget GeneRSSRegulon Activity
∗The dot plots of a searched regulon are shown for all cell subpopulations in each disease state of each tissue based on the regulon specific score inferred using pySCENIC and by calculating the average expression.
Page: 1 

Top

Somatic mutation of malignant transformation related genes

check buttonAnnotation of somatic variants for genes involved in malignant transformation
Hugo SymbolVariant ClassVariant ClassificationdbSNP RSHGVScHGVSpHGVSp ShortSWISSPROTBIOTYPESIFTPolyPhenTumor Sample BarcodeTissueHistologySexAgeStageTherapy TypesDrugsOutcome
CPQSNVMissense_Mutationc.1327N>Gp.Met443Valp.M443VQ9Y646protein_codingtolerated(0.17)benign(0.001)TCGA-AO-A128-01Breastbreast invasive carcinomaFemale<65I/IIChemotherapydoxorubicinSD
CPQSNVMissense_Mutationc.40N>Tp.Leu14Phep.L14FQ9Y646protein_codingtolerated_low_confidence(0.17)benign(0.005)TCGA-B6-A0RQ-01Breastbreast invasive carcinomaFemale>=65I/IIUnknownUnknownSD
CPQSNVMissense_Mutationc.185N>Cp.Arg62Thrp.R62TQ9Y646protein_codingtolerated(0.21)benign(0.035)TCGA-BH-A0AW-01Breastbreast invasive carcinomaFemale<65I/IIChemotherapycarboplatinSD
CPQSNVMissense_Mutationnovelc.1009N>Ap.Glu337Lysp.E337KQ9Y646protein_codingdeleterious(0)probably_damaging(1)TCGA-BH-A18P-01Breastbreast invasive carcinomaFemale<65I/IIUnknownUnknownPD
CPQSNVMissense_Mutationc.1297C>Gp.His433Aspp.H433DQ9Y646protein_codingdeleterious(0)probably_damaging(1)TCGA-BH-A1FN-01Breastbreast invasive carcinomaFemale<65I/IIUnknownUnknownPD
CPQSNVMissense_Mutationrs753340797c.967N>Tp.Arg323Cysp.R323CQ9Y646protein_codingdeleterious(0)probably_damaging(0.956)TCGA-C8-A12L-01Breastbreast invasive carcinomaFemale>=65I/IIUnknownUnknownSD
CPQSNVMissense_Mutationrs767066651c.1256N>Ap.Gly419Glup.G419EQ9Y646protein_codingdeleterious(0)probably_damaging(0.973)TCGA-C8-A1HM-01Breastbreast invasive carcinomaFemale>=65I/IIChemotherapydoxorubicinCR
CPQSNVMissense_Mutationrs577356141c.548N>Tp.Thr183Metp.T183MQ9Y646protein_codingdeleterious(0.01)possibly_damaging(0.849)TCGA-E2-A2P5-01Breastbreast invasive carcinomaFemale>=65III/IVHormone TherapyarimidexPD
CPQSNVMissense_Mutationnovelc.482N>Tp.Arg161Ilep.R161IQ9Y646protein_codingtolerated(0.06)benign(0.122)TCGA-2W-A8YY-01Cervixcervical & endocervical cancerFemale<65I/IIChemotherapycisplatinCR
CPQSNVMissense_Mutationrs757303134c.563C>Tp.Thr188Metp.T188MQ9Y646protein_codingtolerated(0.24)benign(0.018)TCGA-EK-A2R8-01Cervixcervical & endocervical cancerFemale<65I/IIUnknownUnknownSD
Page: 1 2 3 4 5 6 7 8 9 

Top

Related drugs of malignant transformation related genes

check buttonIdentification of chemicals and drugs interact with genes involved in malignant transfromation
(DGIdb 4.0)
Entrez IDSymbolCategoryInteraction TypesDrug Claim NameDrug NamePMIDs
Page: 1