
|
|||||
|
 | |
| |
| |
| |
| |
| |
|
Gene: CORO2A |
Gene summary for CORO2A |
| Gene information | Species | Human | Gene symbol | CORO2A | Gene ID | 7464 |
| Gene name | coronin 2A | |
| Gene Alias | CLIPINB | |
| Cytomap | 9q22.33 | |
| Gene Type | protein-coding | GO ID | GO:0007154 | UniProtAcc | A0A024R150 |
Top |
Malignant transformation analysis |
| Identification of the aberrant gene expression in precancerous and cancerous lesions by comparing the gene expression of stem-like cells in diseased tissues with normal stem cells |
| Entrez ID | Symbol | Replicates | Species | Organ | Tissue | Adj P-value | Log2FC | Malignancy |
| 7464 | CORO2A | P47T-E | Human | Esophagus | ESCC | 1.20e-11 | 2.41e-01 | 0.1067 |
| 7464 | CORO2A | P48T-E | Human | Esophagus | ESCC | 7.18e-26 | 4.99e-01 | 0.0959 |
| 7464 | CORO2A | P49T-E | Human | Esophagus | ESCC | 1.86e-05 | 6.53e-01 | 0.1768 |
| 7464 | CORO2A | P52T-E | Human | Esophagus | ESCC | 1.11e-23 | 5.76e-01 | 0.1555 |
| 7464 | CORO2A | P54T-E | Human | Esophagus | ESCC | 1.26e-10 | 3.71e-01 | 0.0975 |
| 7464 | CORO2A | P57T-E | Human | Esophagus | ESCC | 3.40e-22 | 3.11e-01 | 0.0926 |
| 7464 | CORO2A | P61T-E | Human | Esophagus | ESCC | 1.23e-10 | 3.27e-01 | 0.099 |
| 7464 | CORO2A | P62T-E | Human | Esophagus | ESCC | 4.81e-30 | 6.46e-01 | 0.1302 |
| 7464 | CORO2A | P65T-E | Human | Esophagus | ESCC | 6.20e-12 | 2.71e-01 | 0.0978 |
| 7464 | CORO2A | P74T-E | Human | Esophagus | ESCC | 6.82e-24 | 6.39e-01 | 0.1479 |
| 7464 | CORO2A | P75T-E | Human | Esophagus | ESCC | 1.42e-28 | 5.41e-01 | 0.1125 |
| 7464 | CORO2A | P76T-E | Human | Esophagus | ESCC | 7.03e-16 | 1.92e-01 | 0.1207 |
| 7464 | CORO2A | P79T-E | Human | Esophagus | ESCC | 3.03e-16 | 3.26e-01 | 0.1154 |
| 7464 | CORO2A | P80T-E | Human | Esophagus | ESCC | 9.01e-24 | 9.62e-01 | 0.155 |
| 7464 | CORO2A | P82T-E | Human | Esophagus | ESCC | 5.77e-10 | 6.77e-01 | 0.1072 |
| 7464 | CORO2A | P83T-E | Human | Esophagus | ESCC | 6.97e-20 | 5.49e-01 | 0.1738 |
| 7464 | CORO2A | P84T-E | Human | Esophagus | ESCC | 3.09e-08 | 4.43e-01 | 0.0933 |
| 7464 | CORO2A | P89T-E | Human | Esophagus | ESCC | 2.68e-07 | 6.13e-01 | 0.1752 |
| 7464 | CORO2A | P91T-E | Human | Esophagus | ESCC | 4.30e-03 | 6.16e-01 | 0.1828 |
| 7464 | CORO2A | P94T-E | Human | Esophagus | ESCC | 1.20e-04 | 5.16e-01 | 0.0879 |
| Page: 1 2 3 4 5 6 |
| Tissue | Expression Dynamics | Abbreviation |
| Cervix | 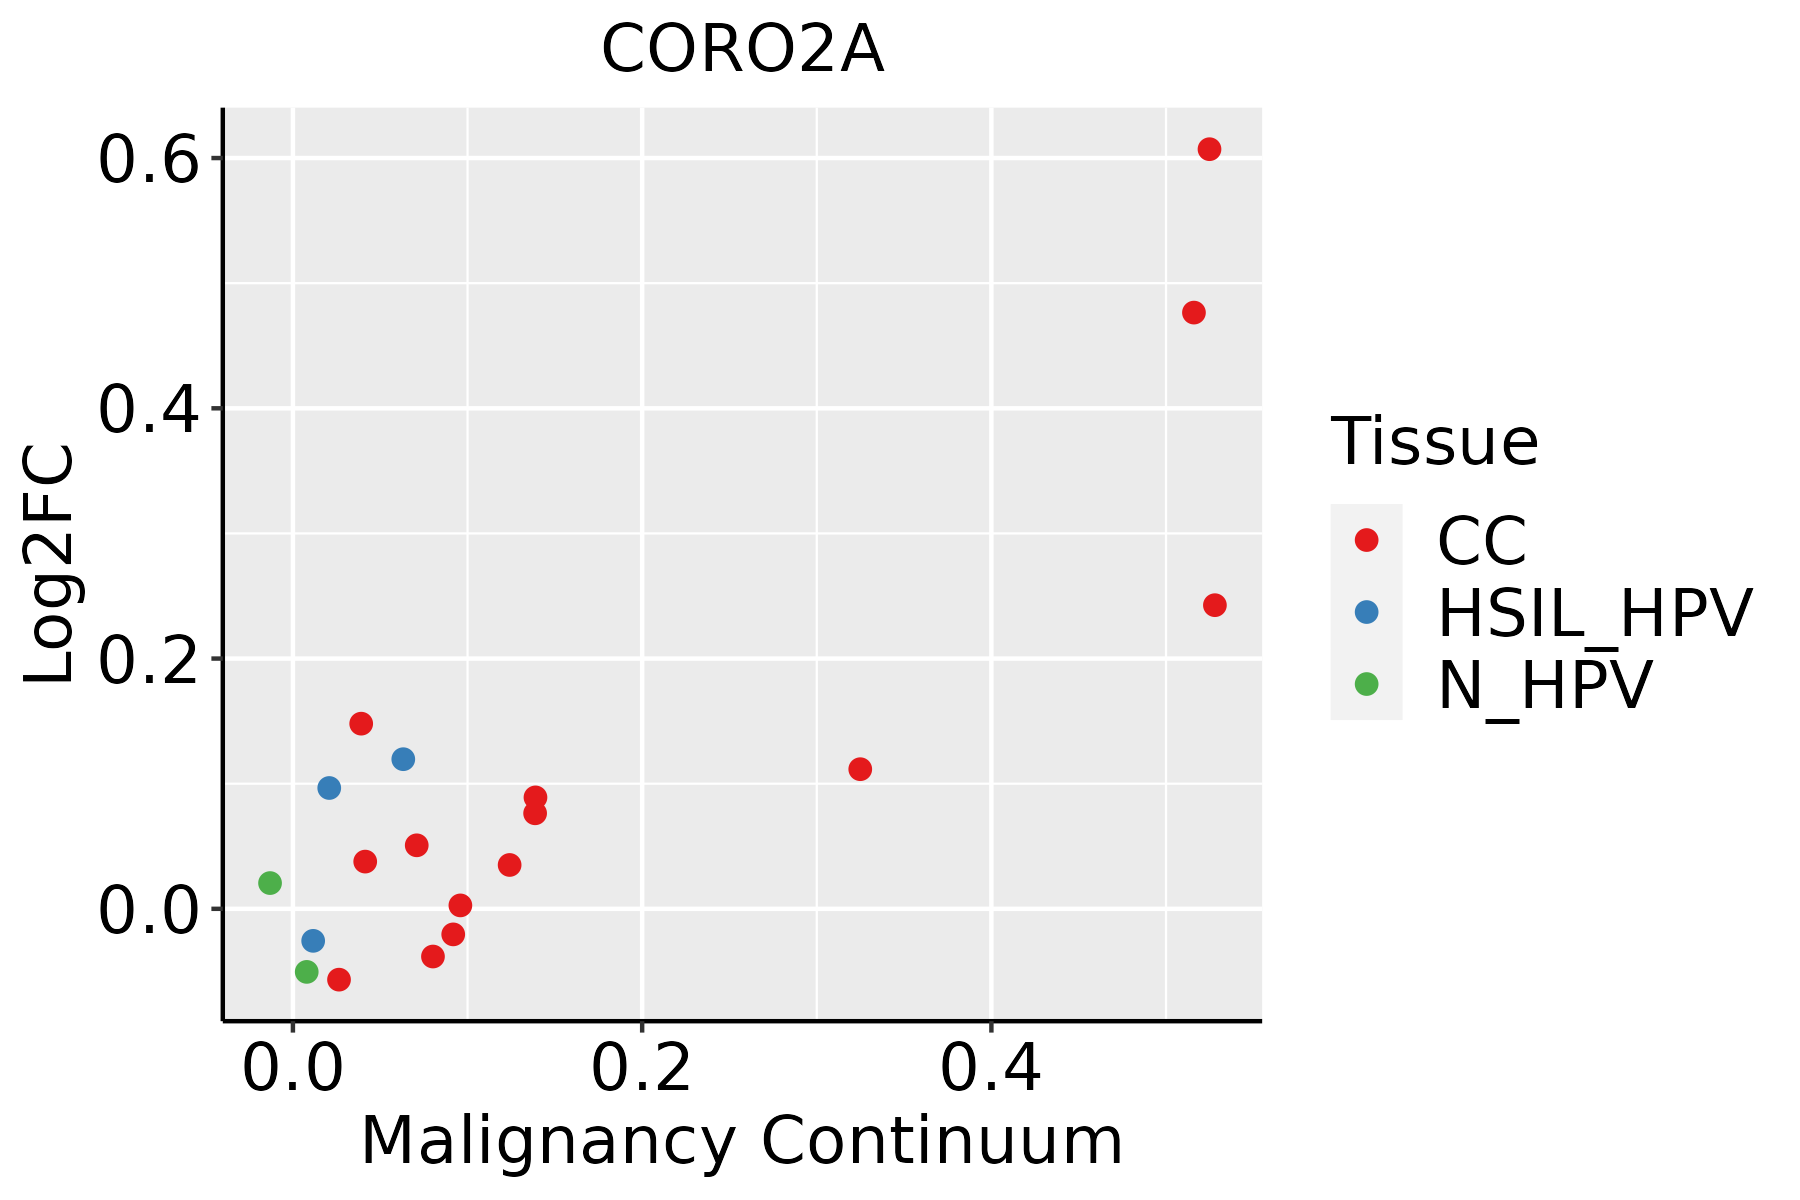 | CC: Cervix cancer |
| HSIL_HPV: HPV-infected high-grade squamous intraepithelial lesions | ||
| N_HPV: HPV-infected normal cervix | ||
| Colorectum (GSE201348) |  | FAP: Familial adenomatous polyposis |
| CRC: Colorectal cancer | ||
| Colorectum (HTA11) |  | AD: Adenomas |
| SER: Sessile serrated lesions | ||
| MSI-H: Microsatellite-high colorectal cancer | ||
| MSS: Microsatellite stable colorectal cancer | ||
| Esophagus |  | ESCC: Esophageal squamous cell carcinoma |
| HGIN: High-grade intraepithelial neoplasias | ||
| LGIN: Low-grade intraepithelial neoplasias | ||
| Liver | 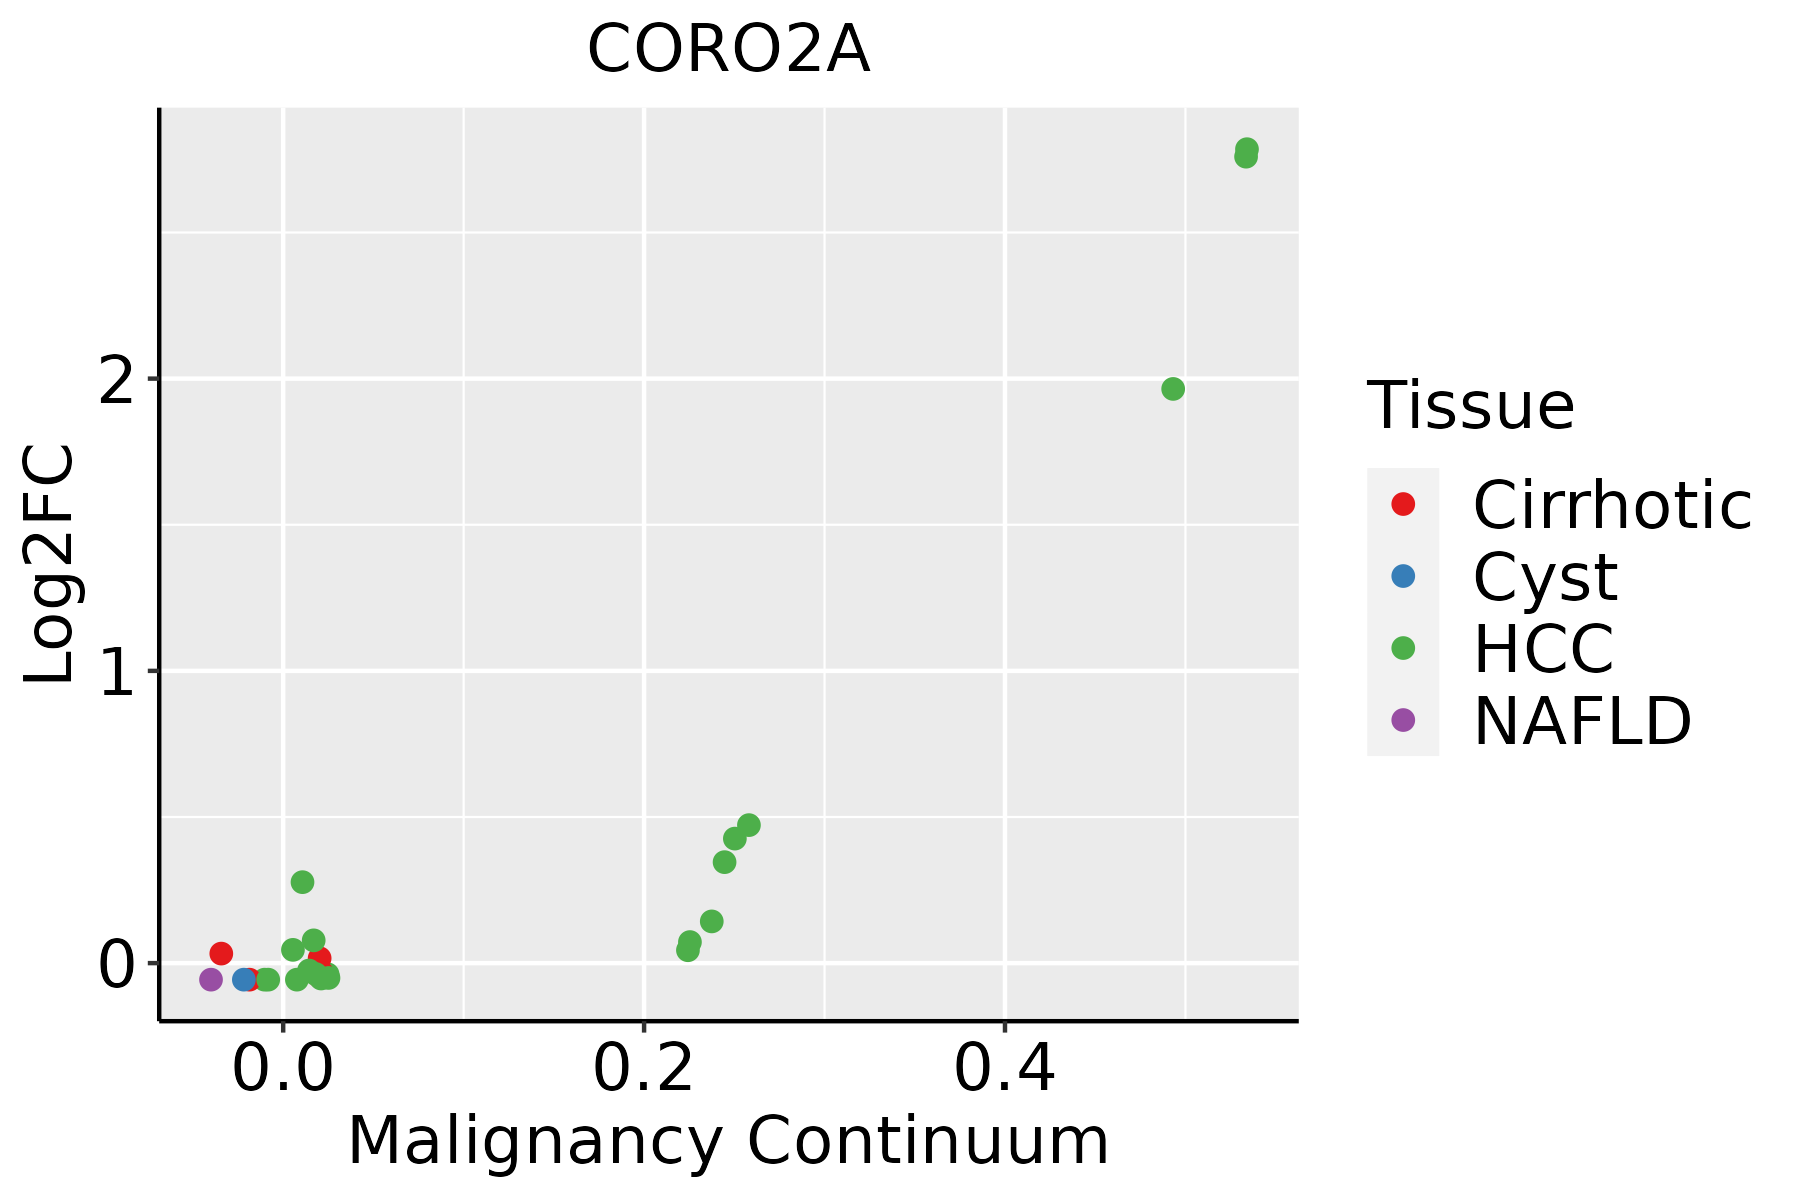 | HCC: Hepatocellular carcinoma |
| NAFLD: Non-alcoholic fatty liver disease | ||
| Oral Cavity | 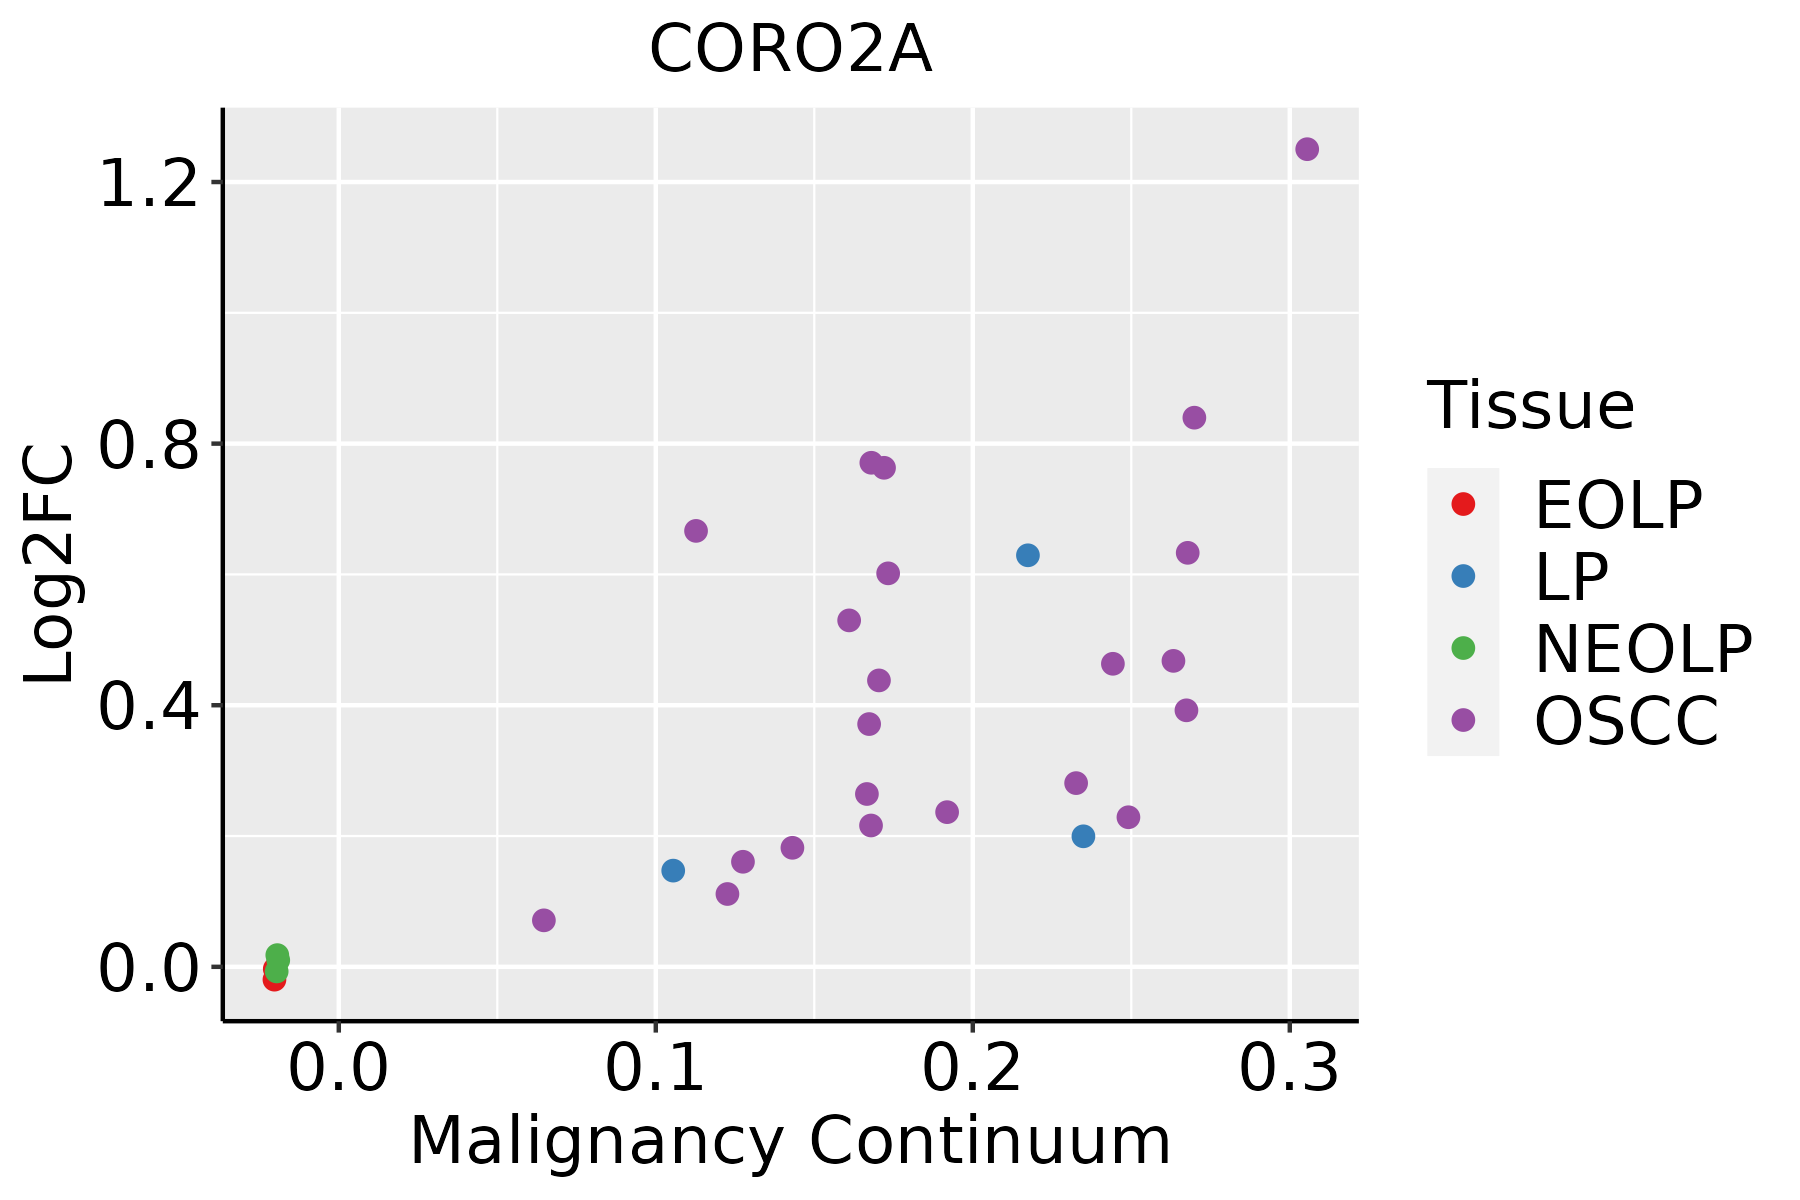 | EOLP: Erosive Oral lichen planus |
| LP: leukoplakia | ||
| NEOLP: Non-erosive oral lichen planus | ||
| OSCC: Oral squamous cell carcinoma |
| ∗log2FC in expression of this searched gene in stem-like cells from each diseased tissue sample relative to stem-like cells in normal samples in each tissue plotted against the malignancy continuum. Samples are colored based on if they are from different disease stage. |
Top |
Malignant transformation related pathway analysis |
| Find out the enriched GO biological processes and KEGG pathways involved in transition from healthy to precancer to cancer |
| Tissue | Disease Stage | Enriched GO biological Processes |
| Colorectum | AD |  |
| Colorectum | SER |  |
| Colorectum | MSS |  |
| Colorectum | MSI-H |  |
| Colorectum | FAP |  |
| ∗Top 15 enriched GO BP terms are showed in the bar plot of each disease state in each tissue. Each row represents a significant GO biological process which is colored according to the -log10(p.adjust). |
| Page: 1 2 3 4 5 6 7 8 9 |
| GO ID | Tissue | Disease Stage | Description | Gene Ratio | Bg Ratio | pvalue | p.adjust | Count |
| Page: 1 |
| Pathway ID | Tissue | Disease Stage | Description | Gene Ratio | Bg Ratio | pvalue | p.adjust | qvalue | Count |
| Page: 1 |
Top |
Cell-cell communication analysis |
| Identification of potential cell-cell interactions between two cell types and their ligand-receptor pairs for different disease states |
| Ligand | Receptor | LRpair | Pathway | Tissue | Disease Stage |
| Page: 1 |
Top |
Single-cell gene regulatory network inference analysis |
| Find out the significant the regulons (TFs) and the target genes of each regulon across cell types for different disease states |
| TF | Cell Type | Tissue | Disease Stage | Target Gene | RSS | Regulon Activity |
| ∗The dot plots of a searched regulon are shown for all cell subpopulations in each disease state of each tissue based on the regulon specific score inferred using pySCENIC and by calculating the average expression. |
| Page: 1 |
Top |
Somatic mutation of malignant transformation related genes |
| Annotation of somatic variants for genes involved in malignant transformation |
| Hugo Symbol | Variant Class | Variant Classification | dbSNP RS | HGVSc | HGVSp | HGVSp Short | SWISSPROT | BIOTYPE | SIFT | PolyPhen | Tumor Sample Barcode | Tissue | Histology | Sex | Age | Stage | Therapy Types | Drugs | Outcome |
| CORO2A | SNV | Missense_Mutation | c.1367N>C | p.His456Pro | p.H456P | Q92828 | protein_coding | tolerated(0.23) | benign(0) | TCGA-A2-A1G1-01 | Breast | breast invasive carcinoma | Female | >=65 | I/II | Unknown | Unknown | SD | |
| CORO2A | SNV | Missense_Mutation | c.541N>C | p.Asp181His | p.D181H | Q92828 | protein_coding | deleterious(0) | probably_damaging(0.995) | TCGA-AN-A0FL-01 | Breast | breast invasive carcinoma | Female | <65 | I/II | Unknown | Unknown | SD | |
| CORO2A | SNV | Missense_Mutation | c.236G>T | p.Cys79Phe | p.C79F | Q92828 | protein_coding | deleterious(0.01) | probably_damaging(0.962) | TCGA-BH-A0B7-01 | Breast | breast invasive carcinoma | Female | <65 | I/II | Chemotherapy | adriamycin | CR | |
| CORO2A | SNV | Missense_Mutation | c.245N>A | p.Arg82Lys | p.R82K | Q92828 | protein_coding | tolerated(1) | benign(0.013) | TCGA-BH-A0BA-01 | Breast | breast invasive carcinoma | Female | <65 | III/IV | Chemotherapy | cytoxan | SD | |
| CORO2A | SNV | Missense_Mutation | c.1516N>A | p.Val506Ile | p.V506I | Q92828 | protein_coding | tolerated(0.4) | benign(0.134) | TCGA-E2-A14Q-01 | Breast | breast invasive carcinoma | Female | <65 | I/II | Hormone Therapy | tamoxiphen | SD | |
| CORO2A | SNV | Missense_Mutation | c.1096G>A | p.Glu366Lys | p.E366K | Q92828 | protein_coding | deleterious(0) | probably_damaging(0.924) | TCGA-E2-A159-01 | Breast | breast invasive carcinoma | Female | <65 | I/II | Chemotherapy | cyclophosphamide | SD | |
| CORO2A | SNV | Missense_Mutation | novel | c.722G>A | p.Gly241Asp | p.G241D | Q92828 | protein_coding | deleterious(0) | probably_damaging(0.997) | TCGA-LL-A9Q3-01 | Breast | breast invasive carcinoma | Female | >=65 | III/IV | Immunotherapy | herceptin | CR |
| CORO2A | insertion | Frame_Shift_Ins | novel | c.664_665insCTAGAGGAGGGGAGGTAGCT | p.Gly222AlafsTer20 | p.G222Afs*20 | Q92828 | protein_coding | TCGA-BH-A0BA-01 | Breast | breast invasive carcinoma | Female | <65 | III/IV | Chemotherapy | cytoxan | SD | ||
| CORO2A | SNV | Missense_Mutation | novel | c.781N>T | p.Pro261Ser | p.P261S | Q92828 | protein_coding | deleterious(0.02) | probably_damaging(0.913) | TCGA-2W-A8YY-01 | Cervix | cervical & endocervical cancer | Female | <65 | I/II | Chemotherapy | cisplatin | CR |
| CORO2A | SNV | Missense_Mutation | novel | c.1358N>A | p.Ala453Glu | p.A453E | Q92828 | protein_coding | tolerated(0.63) | benign(0.024) | TCGA-C5-A8YR-01 | Cervix | cervical & endocervical cancer | Female | <65 | I/II | Unknown | Unknown | PD |
| Page: 1 2 3 4 5 6 |
Top |
Related drugs of malignant transformation related genes |
| Identification of chemicals and drugs interact with genes involved in malignant transfromation |
| (DGIdb 4.0) |
| Entrez ID | Symbol | Category | Interaction Types | Drug Claim Name | Drug Name | PMIDs |
| Page: 1 |

Copyright 2023-Present -The University of Texas Health Science Center at Houston |