
|
|||||
|
 | |
| |
| |
| |
| |
| |
|
Gene: COQ4 |
Gene summary for COQ4 |
| Gene information | Species | Human | Gene symbol | COQ4 | Gene ID | 51117 |
| Gene name | coenzyme Q4 | |
| Gene Alias | CGI-92 | |
| Cytomap | 9q34.11 | |
| Gene Type | protein-coding | GO ID | GO:0006743 | UniProtAcc | A0A024R890 |
Top |
Malignant transformation analysis |
| Identification of the aberrant gene expression in precancerous and cancerous lesions by comparing the gene expression of stem-like cells in diseased tissues with normal stem cells |
| Entrez ID | Symbol | Replicates | Species | Organ | Tissue | Adj P-value | Log2FC | Malignancy |
| 51117 | COQ4 | P84T-E | Human | Esophagus | ESCC | 7.69e-12 | 7.12e-01 | 0.0933 |
| 51117 | COQ4 | P89T-E | Human | Esophagus | ESCC | 2.69e-20 | 1.44e+00 | 0.1752 |
| 51117 | COQ4 | P91T-E | Human | Esophagus | ESCC | 3.74e-26 | 2.03e+00 | 0.1828 |
| 51117 | COQ4 | P94T-E | Human | Esophagus | ESCC | 1.63e-04 | 1.08e+00 | 0.0879 |
| 51117 | COQ4 | P104T-E | Human | Esophagus | ESCC | 1.21e-08 | 6.85e-01 | 0.0931 |
| 51117 | COQ4 | P107T-E | Human | Esophagus | ESCC | 4.51e-75 | 1.70e+00 | 0.171 |
| 51117 | COQ4 | P126T-E | Human | Esophagus | ESCC | 5.52e-10 | 1.08e+00 | 0.1125 |
| 51117 | COQ4 | P127T-E | Human | Esophagus | ESCC | 6.71e-36 | 5.90e-01 | 0.0826 |
| 51117 | COQ4 | P128T-E | Human | Esophagus | ESCC | 6.23e-36 | 1.01e+00 | 0.1241 |
| 51117 | COQ4 | P130T-E | Human | Esophagus | ESCC | 9.43e-45 | 9.80e-01 | 0.1676 |
| 51117 | COQ4 | S43 | Human | Liver | Cirrhotic | 1.69e-05 | -1.97e-01 | -0.0187 |
| 51117 | COQ4 | HCC1_Meng | Human | Liver | HCC | 4.22e-59 | -7.23e-02 | 0.0246 |
| 51117 | COQ4 | HCC2_Meng | Human | Liver | HCC | 2.29e-26 | 1.83e-03 | 0.0107 |
| 51117 | COQ4 | cirrhotic1 | Human | Liver | Cirrhotic | 1.11e-07 | 2.22e-01 | 0.0202 |
| 51117 | COQ4 | cirrhotic2 | Human | Liver | Cirrhotic | 1.25e-06 | 2.48e-01 | 0.0201 |
| 51117 | COQ4 | cirrhotic3 | Human | Liver | Cirrhotic | 6.63e-05 | 1.38e-01 | 0.0215 |
| 51117 | COQ4 | Pt13.b | Human | Liver | HCC | 2.42e-06 | 2.98e-02 | 0.0251 |
| 51117 | COQ4 | S014 | Human | Liver | HCC | 6.03e-11 | 6.57e-01 | 0.2254 |
| 51117 | COQ4 | S015 | Human | Liver | HCC | 4.22e-08 | 6.48e-01 | 0.2375 |
| 51117 | COQ4 | S016 | Human | Liver | HCC | 7.60e-09 | 5.67e-01 | 0.2243 |
| Page: 1 2 3 4 5 6 7 |
| Tissue | Expression Dynamics | Abbreviation |
| Esophagus |  | ESCC: Esophageal squamous cell carcinoma |
| HGIN: High-grade intraepithelial neoplasias | ||
| LGIN: Low-grade intraepithelial neoplasias | ||
| Liver |  | HCC: Hepatocellular carcinoma |
| NAFLD: Non-alcoholic fatty liver disease | ||
| Oral Cavity | 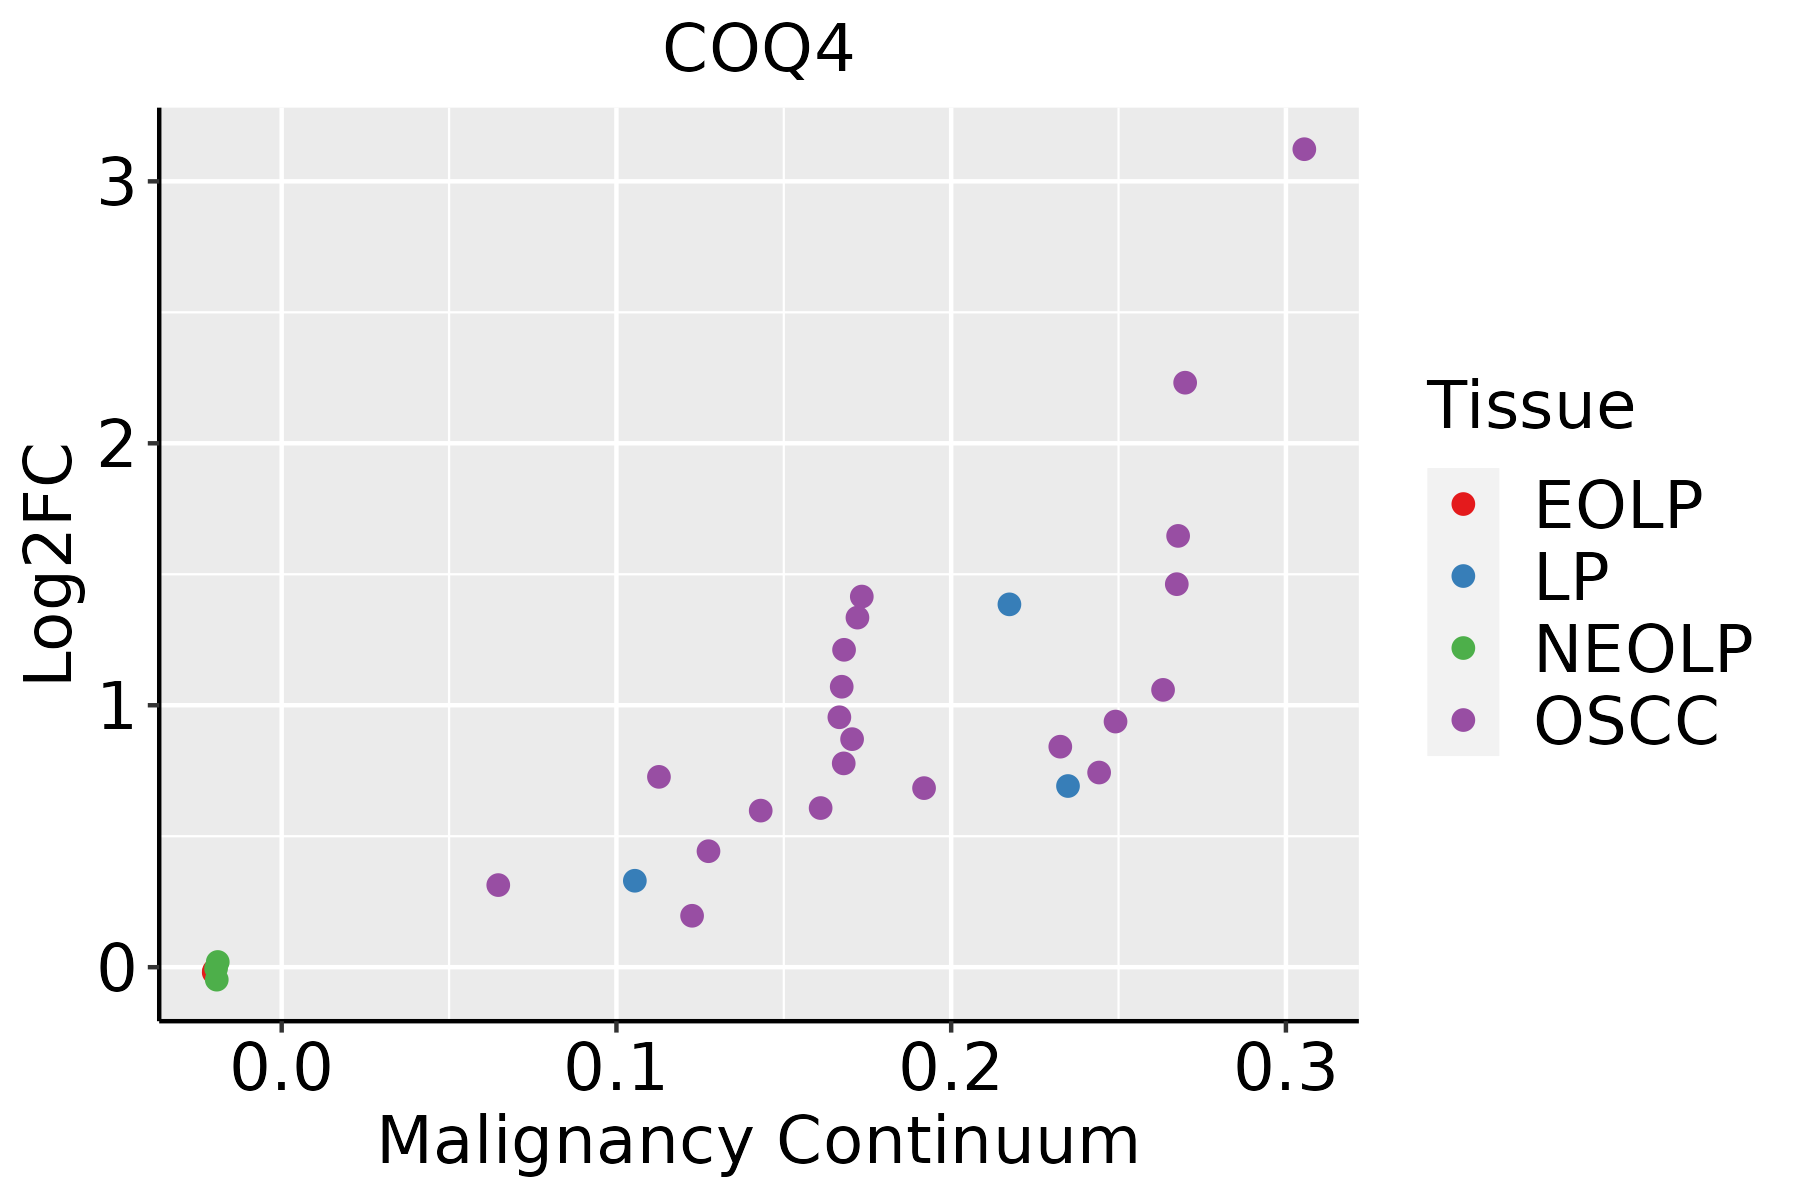 | EOLP: Erosive Oral lichen planus |
| LP: leukoplakia | ||
| NEOLP: Non-erosive oral lichen planus | ||
| OSCC: Oral squamous cell carcinoma | ||
| Prostate | 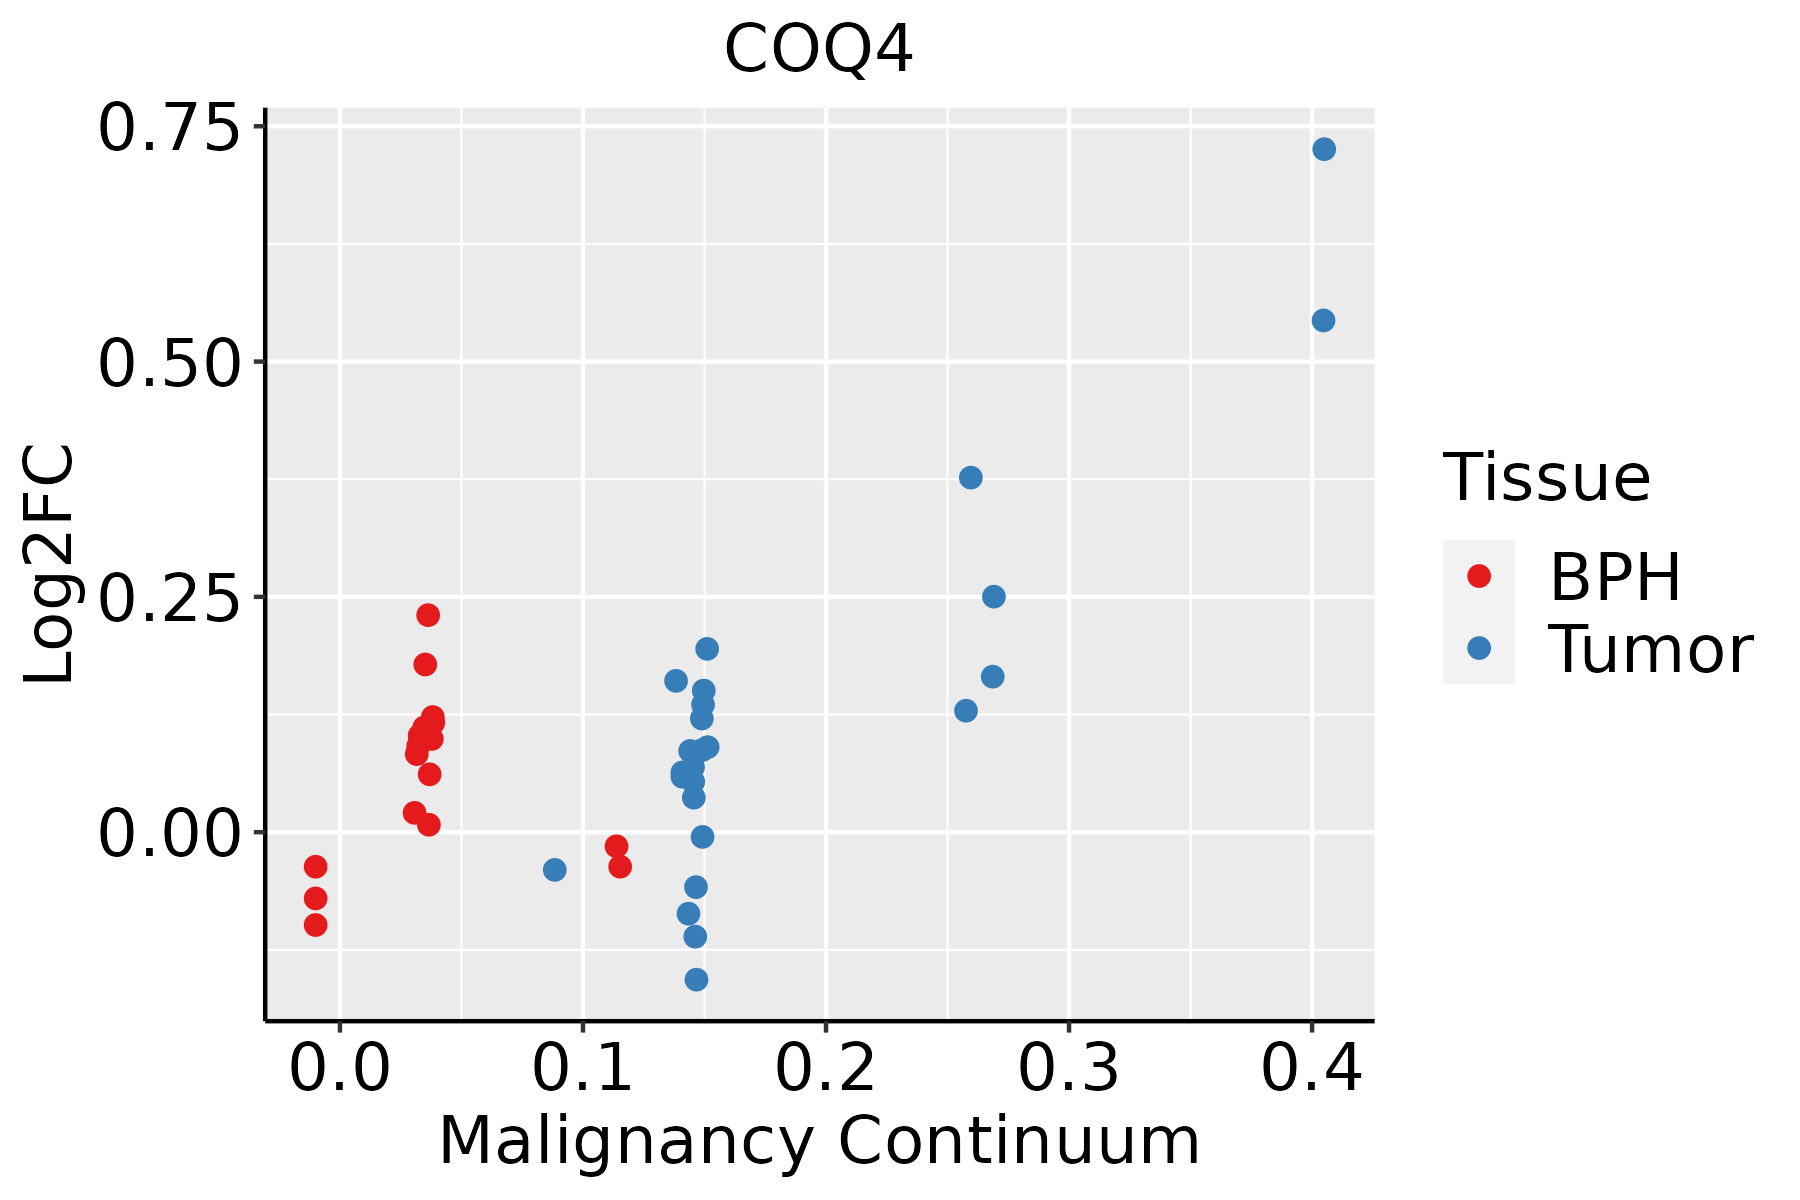 | BPH: Benign Prostatic Hyperplasia |
| Skin |  | AK: Actinic keratosis |
| cSCC: Cutaneous squamous cell carcinoma | ||
| SCCIS:squamous cell carcinoma in situ | ||
| Thyroid |  | ATC: Anaplastic thyroid cancer |
| HT: Hashimoto's thyroiditis | ||
| PTC: Papillary thyroid cancer |
| ∗log2FC in expression of this searched gene in stem-like cells from each diseased tissue sample relative to stem-like cells in normal samples in each tissue plotted against the malignancy continuum. Samples are colored based on if they are from different disease stage. |
Top |
Malignant transformation related pathway analysis |
| Find out the enriched GO biological processes and KEGG pathways involved in transition from healthy to precancer to cancer |
| Tissue | Disease Stage | Enriched GO biological Processes |
| Colorectum | AD |  |
| Colorectum | SER |  |
| Colorectum | MSS |  |
| Colorectum | MSI-H |  |
| Colorectum | FAP |  |
| ∗Top 15 enriched GO BP terms are showed in the bar plot of each disease state in each tissue. Each row represents a significant GO biological process which is colored according to the -log10(p.adjust). |
| Page: 1 2 3 4 5 6 7 8 9 |
| GO ID | Tissue | Disease Stage | Description | Gene Ratio | Bg Ratio | pvalue | p.adjust | Count |
| GO:19016614 | Esophagus | HGIN | quinone metabolic process | 13/2587 | 40/18723 | 2.04e-03 | 2.13e-02 | 13 |
| GO:190166112 | Esophagus | ESCC | quinone metabolic process | 34/8552 | 40/18723 | 3.00e-07 | 4.27e-06 | 34 |
| GO:00067432 | Esophagus | ESCC | ubiquinone metabolic process | 17/8552 | 19/18723 | 9.02e-05 | 6.50e-04 | 17 |
| GO:00067442 | Esophagus | ESCC | ubiquinone biosynthetic process | 15/8552 | 17/18723 | 3.48e-04 | 2.03e-03 | 15 |
| GO:19016632 | Esophagus | ESCC | quinone biosynthetic process | 15/8552 | 17/18723 | 3.48e-04 | 2.03e-03 | 15 |
| GO:00421805 | Esophagus | ESCC | cellular ketone metabolic process | 120/8552 | 211/18723 | 6.70e-04 | 3.55e-03 | 120 |
| GO:004218011 | Liver | Cirrhotic | cellular ketone metabolic process | 80/4634 | 211/18723 | 1.40e-05 | 1.95e-04 | 80 |
| GO:19016612 | Liver | Cirrhotic | quinone metabolic process | 18/4634 | 40/18723 | 4.11e-03 | 2.20e-02 | 18 |
| GO:004218021 | Liver | HCC | cellular ketone metabolic process | 123/7958 | 211/18723 | 2.52e-06 | 3.37e-05 | 123 |
| GO:19016611 | Liver | HCC | quinone metabolic process | 26/7958 | 40/18723 | 3.40e-03 | 1.55e-02 | 26 |
| GO:19016613 | Oral cavity | OSCC | quinone metabolic process | 32/7305 | 40/18723 | 1.40e-07 | 2.34e-06 | 32 |
| GO:00421804 | Oral cavity | OSCC | cellular ketone metabolic process | 111/7305 | 211/18723 | 3.94e-05 | 3.45e-04 | 111 |
| GO:0006743 | Oral cavity | OSCC | ubiquinone metabolic process | 16/7305 | 19/18723 | 7.05e-05 | 5.60e-04 | 16 |
| GO:0006744 | Oral cavity | OSCC | ubiquinone biosynthetic process | 14/7305 | 17/18723 | 3.31e-04 | 2.04e-03 | 14 |
| GO:1901663 | Oral cavity | OSCC | quinone biosynthetic process | 14/7305 | 17/18723 | 3.31e-04 | 2.04e-03 | 14 |
| GO:0042181 | Oral cavity | OSCC | ketone biosynthetic process | 26/7305 | 43/18723 | 3.55e-03 | 1.49e-02 | 26 |
| GO:190166111 | Oral cavity | LP | quinone metabolic process | 24/4623 | 40/18723 | 2.17e-06 | 4.85e-05 | 24 |
| GO:00067441 | Oral cavity | LP | ubiquinone biosynthetic process | 10/4623 | 17/18723 | 2.80e-03 | 1.95e-02 | 10 |
| GO:19016631 | Oral cavity | LP | quinone biosynthetic process | 10/4623 | 17/18723 | 2.80e-03 | 1.95e-02 | 10 |
| GO:004218012 | Oral cavity | LP | cellular ketone metabolic process | 70/4623 | 211/18723 | 3.29e-03 | 2.21e-02 | 70 |
| Page: 1 2 |
| Pathway ID | Tissue | Disease Stage | Description | Gene Ratio | Bg Ratio | pvalue | p.adjust | qvalue | Count |
| Page: 1 |
Top |
Cell-cell communication analysis |
| Identification of potential cell-cell interactions between two cell types and their ligand-receptor pairs for different disease states |
| Ligand | Receptor | LRpair | Pathway | Tissue | Disease Stage |
| Page: 1 |
Top |
Single-cell gene regulatory network inference analysis |
| Find out the significant the regulons (TFs) and the target genes of each regulon across cell types for different disease states |
| TF | Cell Type | Tissue | Disease Stage | Target Gene | RSS | Regulon Activity |
| ∗The dot plots of a searched regulon are shown for all cell subpopulations in each disease state of each tissue based on the regulon specific score inferred using pySCENIC and by calculating the average expression. |
| Page: 1 |
Top |
Somatic mutation of malignant transformation related genes |
| Annotation of somatic variants for genes involved in malignant transformation |
| Hugo Symbol | Variant Class | Variant Classification | dbSNP RS | HGVSc | HGVSp | HGVSp Short | SWISSPROT | BIOTYPE | SIFT | PolyPhen | Tumor Sample Barcode | Tissue | Histology | Sex | Age | Stage | Therapy Types | Drugs | Outcome |
| COQ4 | SNV | Missense_Mutation | rs746503078 | c.712G>A | p.Glu238Lys | p.E238K | Q9Y3A0 | protein_coding | deleterious(0) | probably_damaging(0.998) | TCGA-C8-A26Y-01 | Breast | breast invasive carcinoma | Female | >=65 | I/II | Unknown | Unknown | SD |
| COQ4 | SNV | Missense_Mutation | rs773943371 | c.356N>T | p.Pro119Leu | p.P119L | Q9Y3A0 | protein_coding | deleterious(0) | probably_damaging(0.975) | TCGA-2W-A8YY-01 | Cervix | cervical & endocervical cancer | Female | <65 | I/II | Chemotherapy | cisplatin | CR |
| COQ4 | SNV | Missense_Mutation | rs200009624 | c.490N>A | p.Asp164Asn | p.D164N | Q9Y3A0 | protein_coding | deleterious(0) | probably_damaging(0.999) | TCGA-CM-6171-01 | Colorectum | colon adenocarcinoma | Female | >=65 | I/II | Unknown | Unknown | SD |
| COQ4 | SNV | Missense_Mutation | rs774395996 | c.433C>T | p.Arg145Cys | p.R145C | Q9Y3A0 | protein_coding | deleterious(0) | probably_damaging(0.963) | TCGA-D5-6920-01 | Colorectum | colon adenocarcinoma | Female | >=65 | I/II | Unknown | Unknown | SD |
| COQ4 | SNV | Missense_Mutation | c.746G>T | p.Arg249Leu | p.R249L | Q9Y3A0 | protein_coding | deleterious(0) | possibly_damaging(0.716) | TCGA-WS-AB45-01 | Colorectum | colon adenocarcinoma | Female | <65 | I/II | Unknown | Unknown | SD | |
| COQ4 | SNV | Missense_Mutation | rs752897625 | c.374N>A | p.Arg125His | p.R125H | Q9Y3A0 | protein_coding | tolerated(0.22) | possibly_damaging(0.766) | TCGA-A5-A0G1-01 | Endometrium | uterine corpus endometrioid carcinoma | Female | >=65 | I/II | Unknown | Unknown | SD |
| COQ4 | SNV | Missense_Mutation | novel | c.295N>A | p.Leu99Met | p.L99M | Q9Y3A0 | protein_coding | tolerated(0.07) | probably_damaging(0.995) | TCGA-A5-A2K5-01 | Endometrium | uterine corpus endometrioid carcinoma | Female | >=65 | I/II | Unknown | Unknown | SD |
| COQ4 | SNV | Missense_Mutation | rs762170679 | c.434N>A | p.Arg145His | p.R145H | Q9Y3A0 | protein_coding | tolerated(0.11) | probably_damaging(0.963) | TCGA-AJ-A3BH-01 | Endometrium | uterine corpus endometrioid carcinoma | Female | Unknown | I/II | Unknown | Unknown | SD |
| COQ4 | SNV | Missense_Mutation | c.640N>A | p.Leu214Met | p.L214M | Q9Y3A0 | protein_coding | deleterious(0.01) | probably_damaging(1) | TCGA-AP-A0LG-01 | Endometrium | uterine corpus endometrioid carcinoma | Female | <65 | I/II | Unknown | Unknown | SD | |
| COQ4 | SNV | Missense_Mutation | rs762170679 | c.434G>A | p.Arg145His | p.R145H | Q9Y3A0 | protein_coding | tolerated(0.11) | probably_damaging(0.963) | TCGA-B5-A3FC-01 | Endometrium | uterine corpus endometrioid carcinoma | Female | <65 | I/II | Unknown | Unknown | SD |
| Page: 1 2 |
Top |
Related drugs of malignant transformation related genes |
| Identification of chemicals and drugs interact with genes involved in malignant transfromation |
| (DGIdb 4.0) |
| Entrez ID | Symbol | Category | Interaction Types | Drug Claim Name | Drug Name | PMIDs |
| Page: 1 |

Copyright 2023-Present -The University of Texas Health Science Center at Houston |