Schematic overview of the cellular and molecular mechanisms involved in the cancer progression, including the proposed cellular and molecular mechanisms in cancer cells trajectory. AT1: alveolar type 1 cells; AT2: alveolar type 2 cells; AAH: atypical adenomatous hyperplasia; AIS: adenocarcinoma in situ; MIA: minimally invasive adenocarcinoma; IA: invasive adenocarcinoma; EMT: epithelial-mesenchymal transition

Home

Download

Statistics

Help

Contact

Center for Computational Systems Medicine
leaf

Gene summary

leaf

Malignant transformation analysis

leaf

Malignant transformation related pathway analysis

leaf

Cell-cell communication analysis

leaf

Single-cell gene regulatory network inference analysis

leaf

Somatic mutation of malignant transformation related genes

leaf

Related drugs of malignant transformation related genes

Gene: COPG1

Gene summary for COPG1

check button Gene summary.

Gene informationSpeciesHuman
Gene symbol

COPG1

Gene ID

22820

Gene nameCOPI coat complex subunit gamma 1
Gene AliasCOPG
Cytomap3q21.3
Gene Typeprotein-coding
GO ID

GO:0006810

UniProtAcc

Q9Y678


Top

Malignant transformation analysis

check button Identification of the aberrant gene expression in precancerous and cancerous lesions by comparing the gene expression of stem-like cells in diseased tissues with normal stem cells
check button Malignant transformation involving gene list.
Entrez IDSymbolReplicatesSpeciesOrganTissueAdj P-valueLog2FCMalignancy
22820COPG1P40T-EHumanEsophagusESCC2.75e-207.21e-010.109
22820COPG1P42T-EHumanEsophagusESCC5.28e-277.01e-010.1175
22820COPG1P44T-EHumanEsophagusESCC1.03e-225.67e-010.1096
22820COPG1P47T-EHumanEsophagusESCC3.41e-417.53e-010.1067
22820COPG1P48T-EHumanEsophagusESCC2.81e-214.07e-010.0959
22820COPG1P49T-EHumanEsophagusESCC2.11e-171.67e+000.1768
22820COPG1P52T-EHumanEsophagusESCC2.92e-408.56e-010.1555
22820COPG1P54T-EHumanEsophagusESCC1.49e-347.61e-010.0975
22820COPG1P56T-EHumanEsophagusESCC3.29e-151.57e+000.1613
22820COPG1P57T-EHumanEsophagusESCC1.05e-234.25e-010.0926
22820COPG1P61T-EHumanEsophagusESCC4.74e-451.13e+000.099
22820COPG1P62T-EHumanEsophagusESCC7.99e-641.06e+000.1302
22820COPG1P65T-EHumanEsophagusESCC8.08e-378.10e-010.0978
22820COPG1P74T-EHumanEsophagusESCC1.75e-591.36e+000.1479
22820COPG1P75T-EHumanEsophagusESCC2.34e-348.27e-010.1125
22820COPG1P76T-EHumanEsophagusESCC3.41e-548.43e-010.1207
22820COPG1P79T-EHumanEsophagusESCC1.27e-519.46e-010.1154
22820COPG1P80T-EHumanEsophagusESCC9.79e-451.12e+000.155
22820COPG1P82T-EHumanEsophagusESCC3.07e-271.01e+000.1072
22820COPG1P83T-EHumanEsophagusESCC1.54e-389.94e-010.1738
Page: 1 2 3 4 5 6 7 8 

check button Transcriptomic changes along malignancy continuum.
TissueExpression DynamicsAbbreviation
Colorectum (GSE201348)The image shows the transcriptomic changes along malignancy continuum.log2FC in expression of this searched gene in stem-like cells from each diseased tissue sample relative to stem-like cells in normal samples in each tissue plotted against the malignancy continuum. Samples are colored based on if they are from different disease stage.FAP: Familial adenomatous polyposis
CRC: Colorectal cancer
Colorectum (HTA11)The image shows the transcriptomic changes along malignancy continuum.log2FC in expression of this searched gene in stem-like cells from each diseased tissue sample relative to stem-like cells in normal samples in each tissue plotted against the malignancy continuum. Samples are colored based on if they are from different disease stage.AD: Adenomas
SER: Sessile serrated lesions
MSI-H: Microsatellite-high colorectal cancer
MSS: Microsatellite stable colorectal cancer
EsophagusThe image shows the transcriptomic changes along malignancy continuum.log2FC in expression of this searched gene in stem-like cells from each diseased tissue sample relative to stem-like cells in normal samples in each tissue plotted against the malignancy continuum. Samples are colored based on if they are from different disease stage.
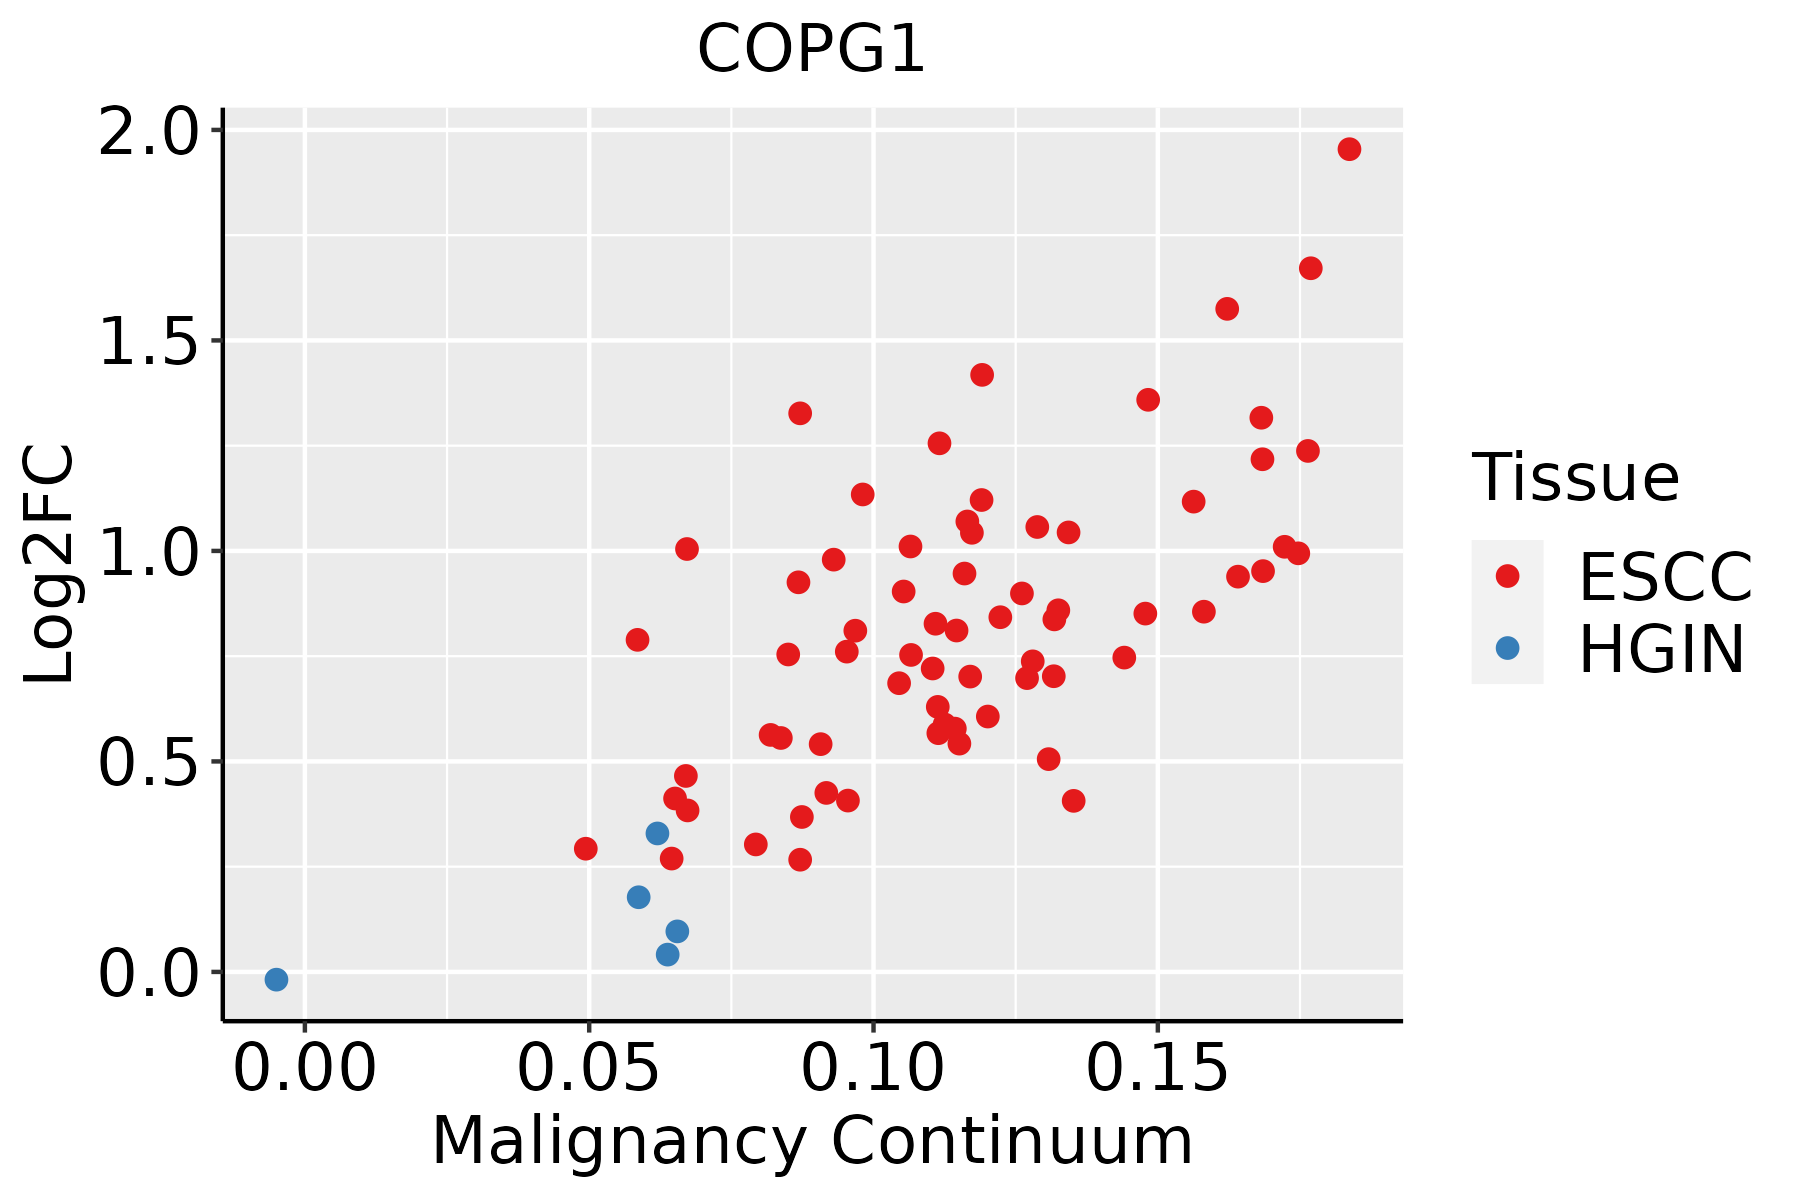
ESCC: Esophageal squamous cell carcinoma
HGIN: High-grade intraepithelial neoplasias
LGIN: Low-grade intraepithelial neoplasias
LiverThe image shows the transcriptomic changes along malignancy continuum.log2FC in expression of this searched gene in stem-like cells from each diseased tissue sample relative to stem-like cells in normal samples in each tissue plotted against the malignancy continuum. Samples are colored based on if they are from different disease stage.
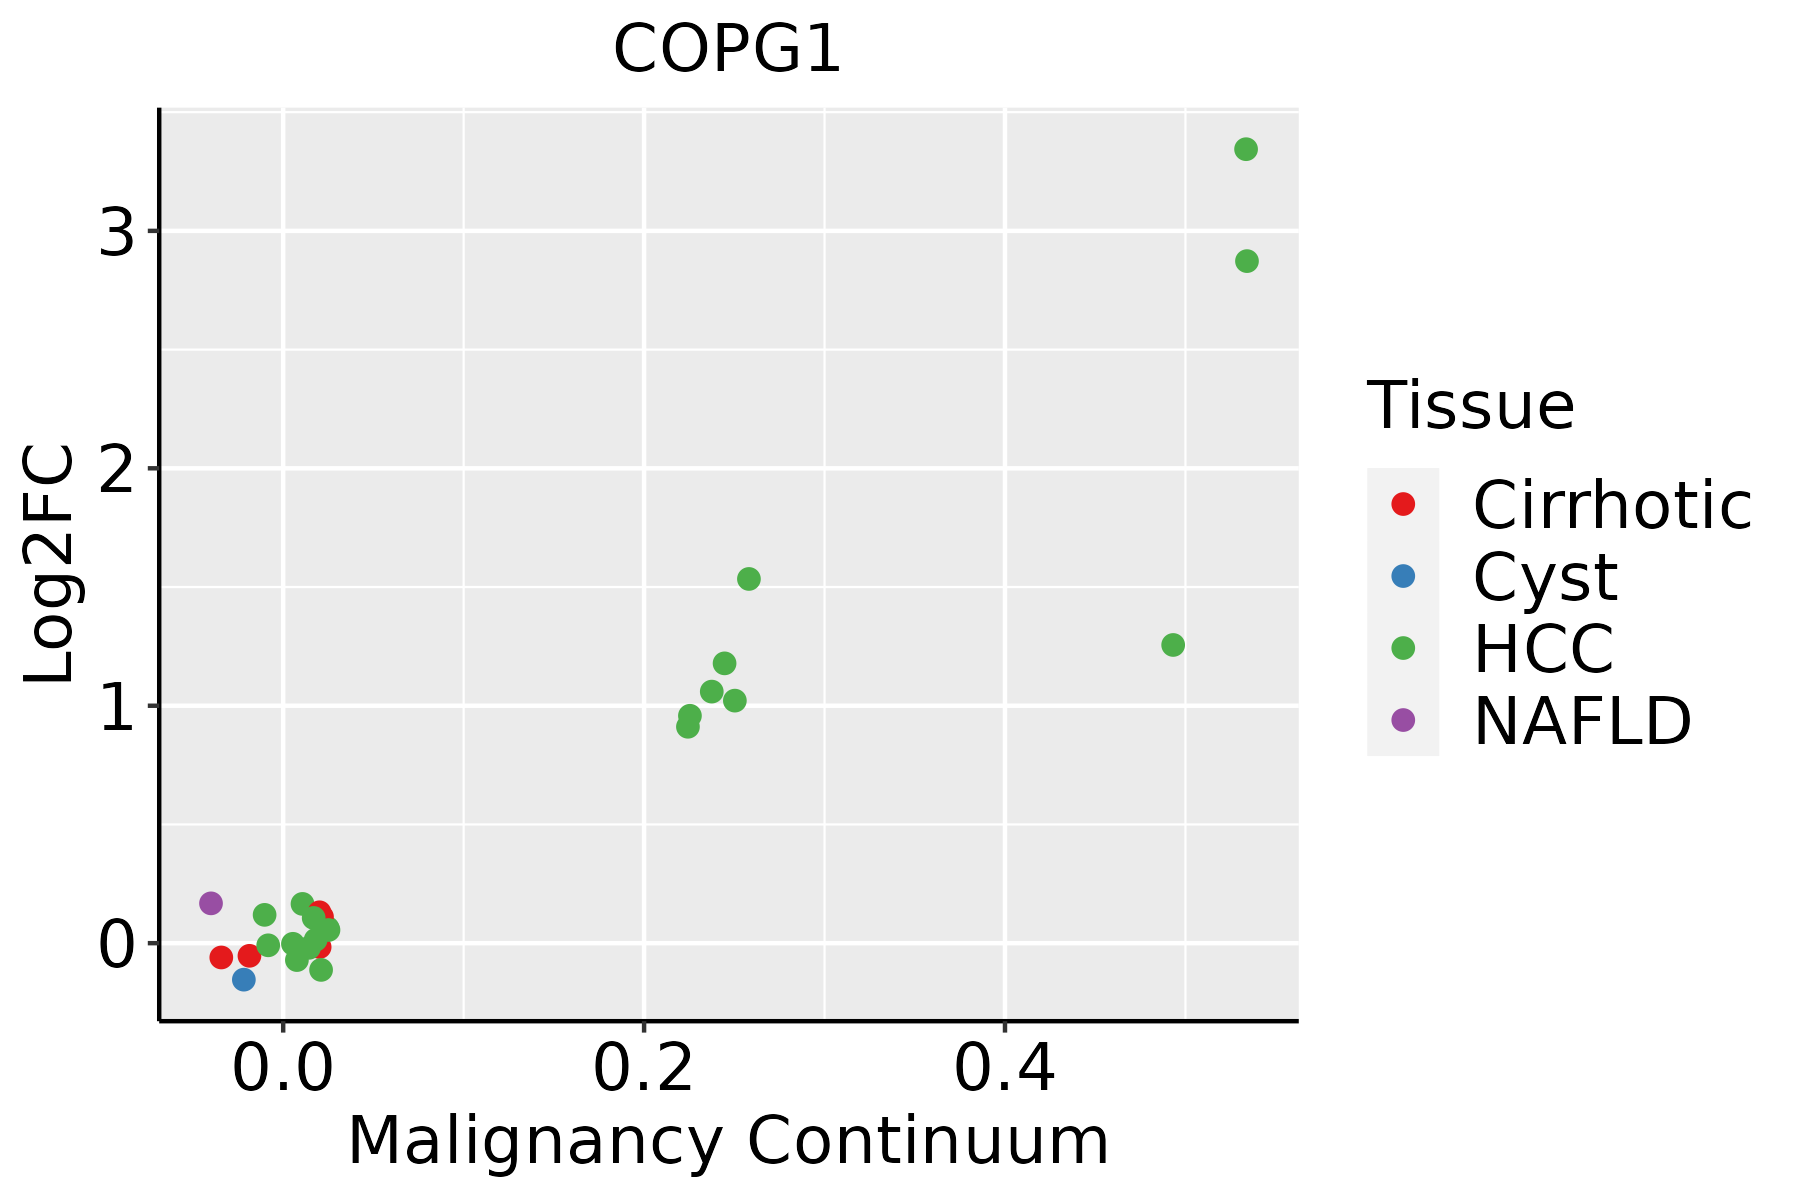
HCC: Hepatocellular carcinoma
NAFLD: Non-alcoholic fatty liver disease
Oral CavityThe image shows the transcriptomic changes along malignancy continuum.log2FC in expression of this searched gene in stem-like cells from each diseased tissue sample relative to stem-like cells in normal samples in each tissue plotted against the malignancy continuum. Samples are colored based on if they are from different disease stage.
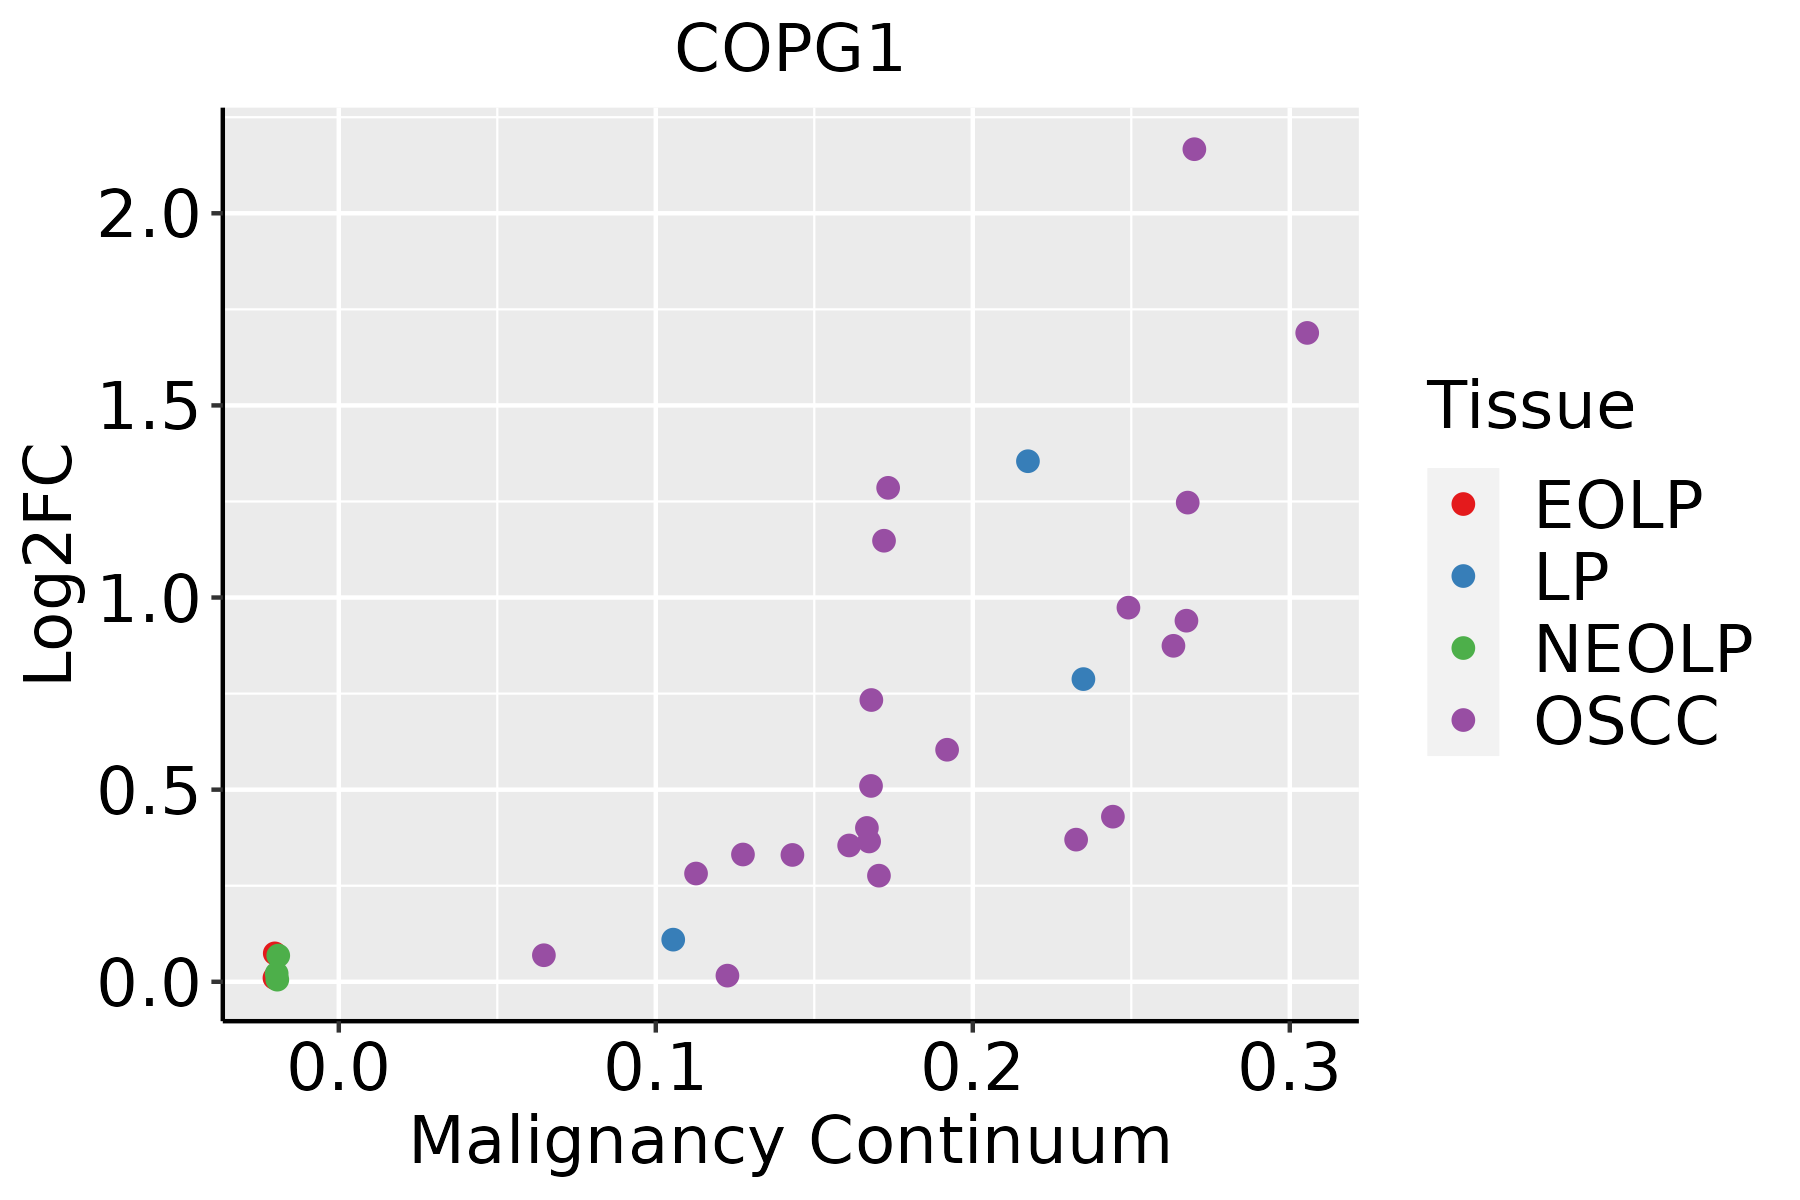
EOLP: Erosive Oral lichen planus
LP: leukoplakia
NEOLP: Non-erosive oral lichen planus
OSCC: Oral squamous cell carcinoma
ProstateThe image shows the transcriptomic changes along malignancy continuum.log2FC in expression of this searched gene in stem-like cells from each diseased tissue sample relative to stem-like cells in normal samples in each tissue plotted against the malignancy continuum. Samples are colored based on if they are from different disease stage.BPH: Benign Prostatic Hyperplasia
SkinThe image shows the transcriptomic changes along malignancy continuum.log2FC in expression of this searched gene in stem-like cells from each diseased tissue sample relative to stem-like cells in normal samples in each tissue plotted against the malignancy continuum. Samples are colored based on if they are from different disease stage.AK: Actinic keratosis
cSCC: Cutaneous squamous cell carcinoma
SCCIS:squamous cell carcinoma in situ
ThyroidThe image shows the transcriptomic changes along malignancy continuum.log2FC in expression of this searched gene in stem-like cells from each diseased tissue sample relative to stem-like cells in normal samples in each tissue plotted against the malignancy continuum. Samples are colored based on if they are from different disease stage.
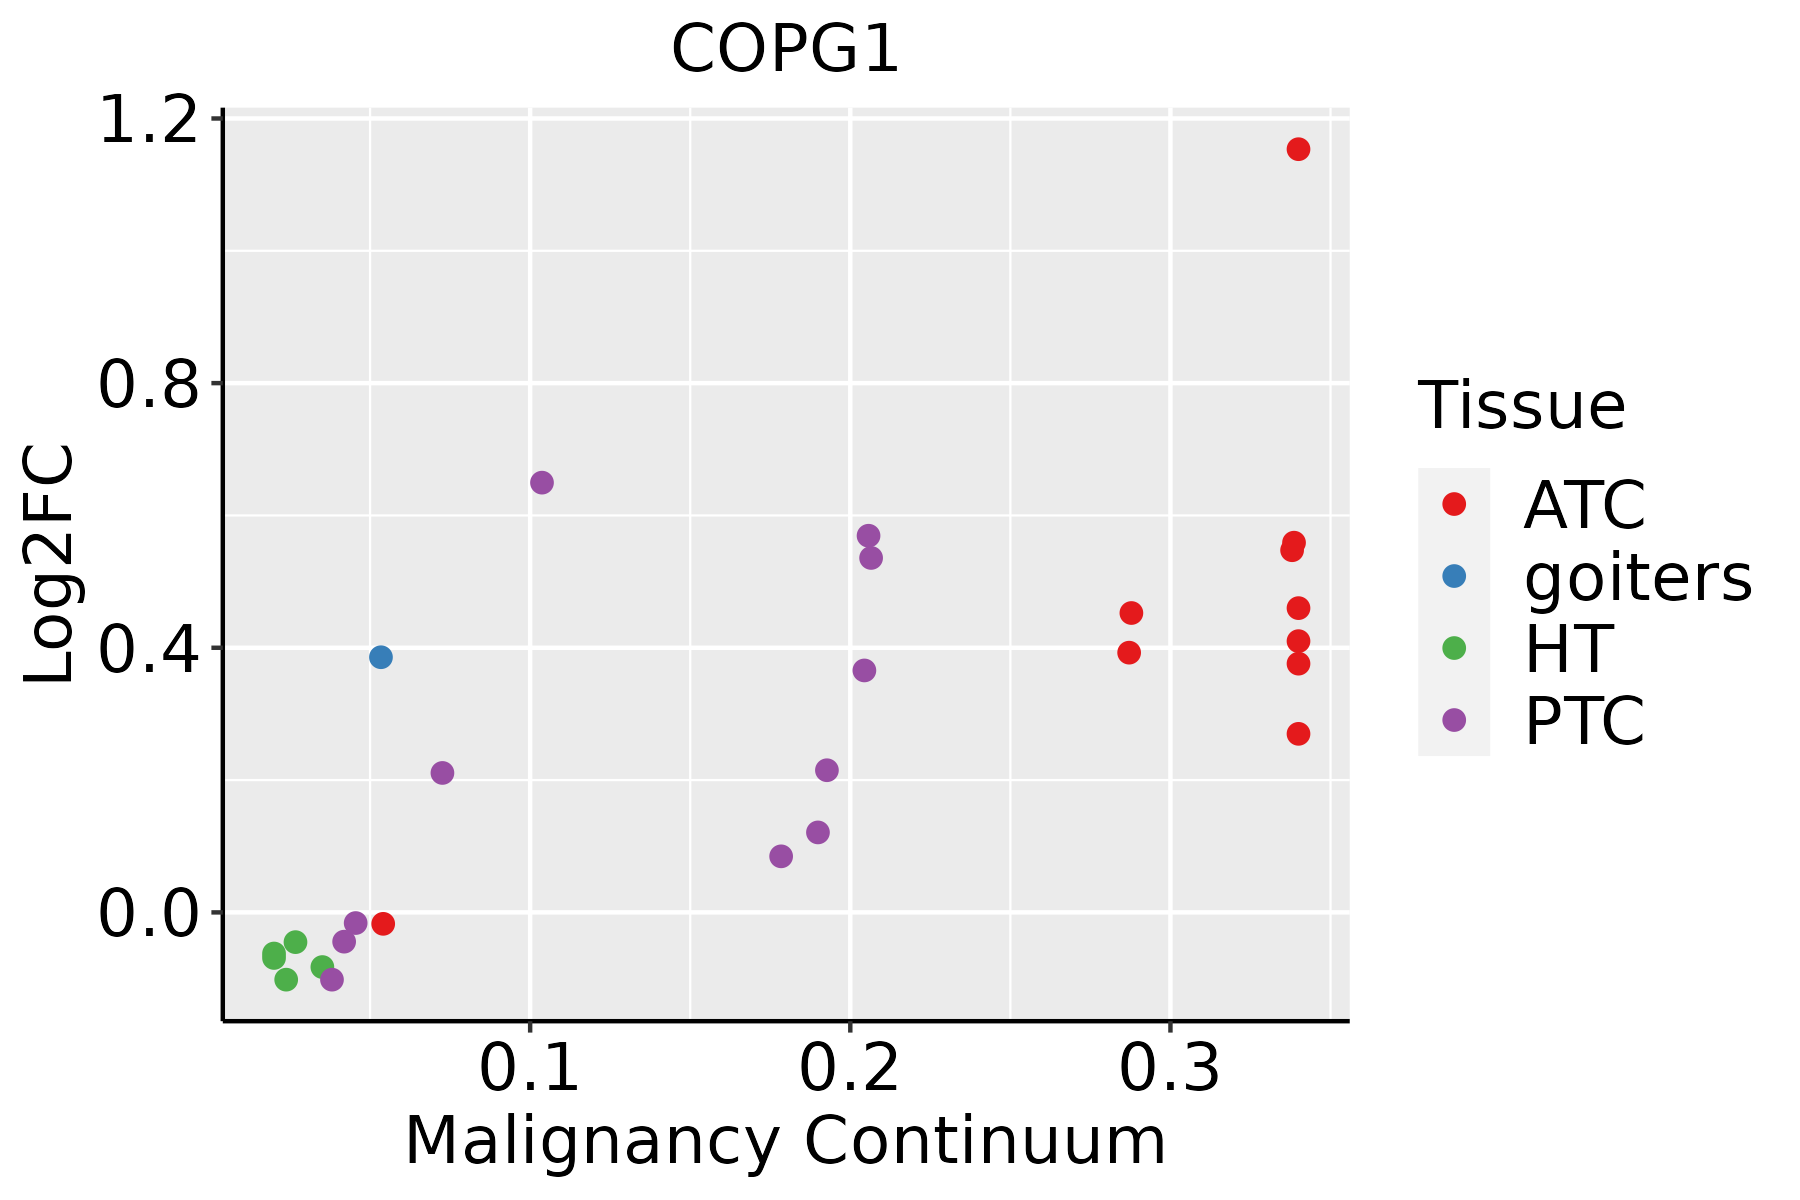
ATC: Anaplastic thyroid cancer
HT: Hashimoto's thyroiditis
PTC: Papillary thyroid cancer
∗log2FC in expression of this searched gene in stem-like cells from each diseased tissue sample relative to stem-like cells in normal samples in each tissue plotted against the malignancy continuum. Samples are colored based on if they are from different disease stage.

Top

Malignant transformation related pathway analysis

check buttonFind out the enriched GO biological processes and KEGG pathways involved in transition from healthy to precancer to cancer
check button Figure of enriched GO biological processes.
TissueDisease StageEnriched GO biological Processes
ColorectumADGO analysis - Figure of enriched GO biological processes: Top 15 enriched GO BP terms are showed in the bar plot of each disease state in each tissue. Each row represents a significant GO biological process which is colored according to the -log10(p.adjust).
ColorectumSERGO analysis - Figure of enriched GO biological processes: Top 15 enriched GO BP terms are showed in the bar plot of each disease state in each tissue. Each row represents a significant GO biological process which is colored according to the -log10(p.adjust).
ColorectumMSSGO analysis - Figure of enriched GO biological processes: Top 15 enriched GO BP terms are showed in the bar plot of each disease state in each tissue. Each row represents a significant GO biological process which is colored according to the -log10(p.adjust).
ColorectumMSI-HGO analysis - Figure of enriched GO biological processes: Top 15 enriched GO BP terms are showed in the bar plot of each disease state in each tissue. Each row represents a significant GO biological process which is colored according to the -log10(p.adjust).
ColorectumFAPGO analysis - Figure of enriched GO biological processes: Top 15 enriched GO BP terms are showed in the bar plot of each disease state in each tissue. Each row represents a significant GO biological process which is colored according to the -log10(p.adjust).
∗Top 15 enriched GO BP terms are showed in the bar plot of each disease state in each tissue. Each row represents a significant GO biological process which is colored according to the -log10(p.adjust).
Page: 1 2 3 4 5 6 7 8 9 

check button Enriched GO biological processes.
GO IDTissueDisease StageDescriptionGene RatioBg Ratiopvaluep.adjustCount
GO:0048193ColorectumADGolgi vesicle transport109/3918296/187231.80e-101.68e-08109
GO:0051656ColorectumADestablishment of organelle localization131/3918390/187233.00e-092.06e-07131
GO:0009306ColorectumADprotein secretion105/3918359/187231.05e-041.57e-03105
GO:0035592ColorectumADestablishment of protein localization to extracellular region105/3918360/187231.18e-041.73e-03105
GO:0071692ColorectumADprotein localization to extracellular region106/3918368/187231.86e-042.49e-03106
GO:0006888ColorectumADendoplasmic reticulum to Golgi vesicle-mediated transport44/3918130/187234.13e-044.68e-0344
GO:0030705ColorectumADcytoskeleton-dependent intracellular transport60/3918195/187237.56e-047.59e-0360
GO:0072384ColorectumADorganelle transport along microtubule28/391885/187236.55e-034.07e-0228
GO:00516561ColorectumSERestablishment of organelle localization100/2897390/187231.11e-076.79e-06100
GO:00481931ColorectumSERGolgi vesicle transport79/2897296/187234.20e-072.15e-0579
GO:00093061ColorectumSERprotein secretion79/2897359/187235.99e-048.19e-0379
GO:00355921ColorectumSERestablishment of protein localization to extracellular region79/2897360/187236.54e-048.77e-0379
GO:00716921ColorectumSERprotein localization to extracellular region80/2897368/187238.13e-041.01e-0280
GO:00068881ColorectumSERendoplasmic reticulum to Golgi vesicle-mediated transport34/2897130/187231.13e-031.29e-0234
GO:00307051ColorectumSERcytoskeleton-dependent intracellular transport44/2897195/187235.53e-034.09e-0244
GO:00481932ColorectumMSSGolgi vesicle transport101/3467296/187239.09e-119.77e-09101
GO:00516562ColorectumMSSestablishment of organelle localization115/3467390/187237.30e-083.67e-06115
GO:00068882ColorectumMSSendoplasmic reticulum to Golgi vesicle-mediated transport44/3467130/187232.17e-054.60e-0444
GO:00093062ColorectumMSSprotein secretion98/3467359/187232.43e-055.09e-0498
GO:00355922ColorectumMSSestablishment of protein localization to extracellular region98/3467360/187232.75e-055.58e-0498
Page: 1 2 3 4 5 6 7 8 

check button Enriched KEGG pathways.
Pathway IDTissueDisease StageDescriptionGene RatioBg Ratiopvaluep.adjustqvalueCount
Page: 1 

Top

Cell-cell communication analysis

check buttonIdentification of potential cell-cell interactions between two cell types and their ligand-receptor pairs for different disease states
LigandReceptorLRpairPathwayTissueDisease Stage
Page: 1 

Top

Single-cell gene regulatory network inference analysis

check buttonFind out the significant the regulons (TFs) and the target genes of each regulon across cell types for different disease states
TFCell TypeTissueDisease StageTarget GeneRSSRegulon Activity
∗The dot plots of a searched regulon are shown for all cell subpopulations in each disease state of each tissue based on the regulon specific score inferred using pySCENIC and by calculating the average expression.
Page: 1 

Top

Somatic mutation of malignant transformation related genes

check buttonAnnotation of somatic variants for genes involved in malignant transformation
Hugo SymbolVariant ClassVariant ClassificationdbSNP RSHGVScHGVSpHGVSp ShortSWISSPROTBIOTYPESIFTPolyPhenTumor Sample BarcodeTissueHistologySexAgeStageTherapy TypesDrugsOutcome
COPG1SNVMissense_Mutationnovelc.1942N>Tp.Ile648Phep.I648FQ9Y678protein_codingdeleterious(0)benign(0.415)TCGA-A7-A3J0-01Breastbreast invasive carcinomaFemale<65I/IIHormone TherapyanastrazoleSD
COPG1SNVMissense_Mutationc.1339N>Ap.Glu447Lysp.E447KQ9Y678protein_codingdeleterious(0.02)probably_damaging(0.983)TCGA-AN-A046-01Breastbreast invasive carcinomaFemale>=65I/IIUnknownUnknownSD
COPG1SNVMissense_Mutationnovelc.706N>Ap.Ala236Thrp.A236TQ9Y678protein_codingtolerated(0.21)benign(0.078)TCGA-AN-A0AK-01Breastbreast invasive carcinomaFemale>=65I/IIUnknownUnknownSD
COPG1SNVMissense_Mutationnovelc.1907N>Ap.Pro636Hisp.P636HQ9Y678protein_codingdeleterious(0)possibly_damaging(0.783)TCGA-AN-A0AK-01Breastbreast invasive carcinomaFemale>=65I/IIUnknownUnknownSD
COPG1SNVMissense_Mutationnovelc.425G>Cp.Arg142Prop.R142PQ9Y678protein_codingdeleterious(0)probably_damaging(0.992)TCGA-B6-A0X1-01Breastbreast invasive carcinomaFemale<65I/IIUnknownUnknownPD
COPG1SNVMissense_Mutationrs762136146c.611G>Ap.Arg204Hisp.R204HQ9Y678protein_codingdeleterious(0)probably_damaging(0.991)TCGA-BH-A0B0-01Breastbreast invasive carcinomaFemale<65I/IIChemotherapyadriamycinCR
COPG1SNVMissense_Mutationnovelc.2494N>Tp.Gly832Cysp.G832CQ9Y678protein_codingdeleterious(0)probably_damaging(1)TCGA-D8-A27M-01Breastbreast invasive carcinomaFemale<65I/IIChemotherapymethotrexate+5SD
COPG1SNVMissense_Mutationnovelc.510N>Ap.Ser170Argp.S170RQ9Y678protein_codingdeleterious(0.01)probably_damaging(0.985)TCGA-E2-A1L6-01Breastbreast invasive carcinomaFemale<65I/IIChemotherapycyclophosphamideSD
COPG1SNVMissense_Mutationnovelc.1582G>Tp.Ala528Serp.A528SQ9Y678protein_codingdeleterious(0.02)benign(0.033)TCGA-E9-A247-01Breastbreast invasive carcinomaFemale<65I/IIHormone TherapytamoxiphenSD
COPG1insertionNonsense_Mutationnovelc.2555_2556insAAATAAGACAGATATATAAATAGAGAAAATAACTp.Thr853AsnfsTer6p.T853Nfs*6Q9Y678protein_codingTCGA-A7-A0CJ-01Breastbreast invasive carcinomaFemale<65I/IIChemotherapycytoxanSD
Page: 1 2 3 4 5 6 7 8 9 

Top

Related drugs of malignant transformation related genes

check buttonIdentification of chemicals and drugs interact with genes involved in malignant transfromation
(DGIdb 4.0)
Entrez IDSymbolCategoryInteraction TypesDrug Claim NameDrug NamePMIDs
Page: 1