
|
|||||
|
 | |
| |
| |
| |
| |
| |
|
Gene: CMTM3 |
Gene summary for CMTM3 |
| Gene information | Species | Human | Gene symbol | CMTM3 | Gene ID | 123920 |
| Gene name | CKLF like MARVEL transmembrane domain containing 3 | |
| Gene Alias | BNAS2 | |
| Cytomap | 16q22.1 | |
| Gene Type | protein-coding | GO ID | GO:0001701 | UniProtAcc | A0A024R6Y8 |
Top |
Malignant transformation analysis |
| Identification of the aberrant gene expression in precancerous and cancerous lesions by comparing the gene expression of stem-like cells in diseased tissues with normal stem cells |
| Entrez ID | Symbol | Replicates | Species | Organ | Tissue | Adj P-value | Log2FC | Malignancy |
| 123920 | CMTM3 | C21 | Human | Oral cavity | OSCC | 3.14e-57 | 1.63e+00 | 0.2678 |
| 123920 | CMTM3 | C30 | Human | Oral cavity | OSCC | 7.11e-54 | 2.09e+00 | 0.3055 |
| 123920 | CMTM3 | C38 | Human | Oral cavity | OSCC | 1.67e-04 | 5.85e-01 | 0.172 |
| 123920 | CMTM3 | C51 | Human | Oral cavity | OSCC | 4.91e-15 | 7.70e-01 | 0.2674 |
| 123920 | CMTM3 | C06 | Human | Oral cavity | OSCC | 8.42e-17 | 1.62e+00 | 0.2699 |
| 123920 | CMTM3 | C07 | Human | Oral cavity | OSCC | 8.80e-04 | 7.29e-01 | 0.2491 |
| 123920 | CMTM3 | C08 | Human | Oral cavity | OSCC | 1.41e-27 | 5.64e-01 | 0.1919 |
| 123920 | CMTM3 | C09 | Human | Oral cavity | OSCC | 3.72e-12 | 3.90e-01 | 0.1431 |
| 123920 | CMTM3 | LP15 | Human | Oral cavity | LP | 1.34e-02 | 6.88e-01 | 0.2174 |
| 123920 | CMTM3 | LP17 | Human | Oral cavity | LP | 2.87e-02 | 5.99e-01 | 0.2349 |
| 123920 | CMTM3 | SYSMH2 | Human | Oral cavity | OSCC | 5.80e-09 | 2.55e-01 | 0.2326 |
| 123920 | CMTM3 | SYSMH3 | Human | Oral cavity | OSCC | 1.32e-10 | 2.26e-01 | 0.2442 |
| 123920 | CMTM3 | male-WTA | Human | Thyroid | PTC | 2.41e-14 | 1.27e-01 | 0.1037 |
| 123920 | CMTM3 | PTC01 | Human | Thyroid | PTC | 4.72e-11 | 6.05e-02 | 0.1899 |
| 123920 | CMTM3 | PTC04 | Human | Thyroid | PTC | 4.20e-14 | 2.27e-01 | 0.1927 |
| 123920 | CMTM3 | PTC05 | Human | Thyroid | PTC | 2.49e-02 | 1.58e-01 | 0.2065 |
| 123920 | CMTM3 | PTC06 | Human | Thyroid | PTC | 2.58e-12 | 3.38e-01 | 0.2057 |
| 123920 | CMTM3 | PTC07 | Human | Thyroid | PTC | 5.12e-16 | 2.66e-01 | 0.2044 |
| 123920 | CMTM3 | ATC11 | Human | Thyroid | ATC | 8.28e-08 | 1.01e+00 | 0.3386 |
| 123920 | CMTM3 | ATC12 | Human | Thyroid | ATC | 7.82e-28 | 5.87e-01 | 0.34 |
| Page: 1 2 3 4 5 |
| Tissue | Expression Dynamics | Abbreviation |
| Esophagus |  | ESCC: Esophageal squamous cell carcinoma |
| HGIN: High-grade intraepithelial neoplasias | ||
| LGIN: Low-grade intraepithelial neoplasias | ||
| Liver | 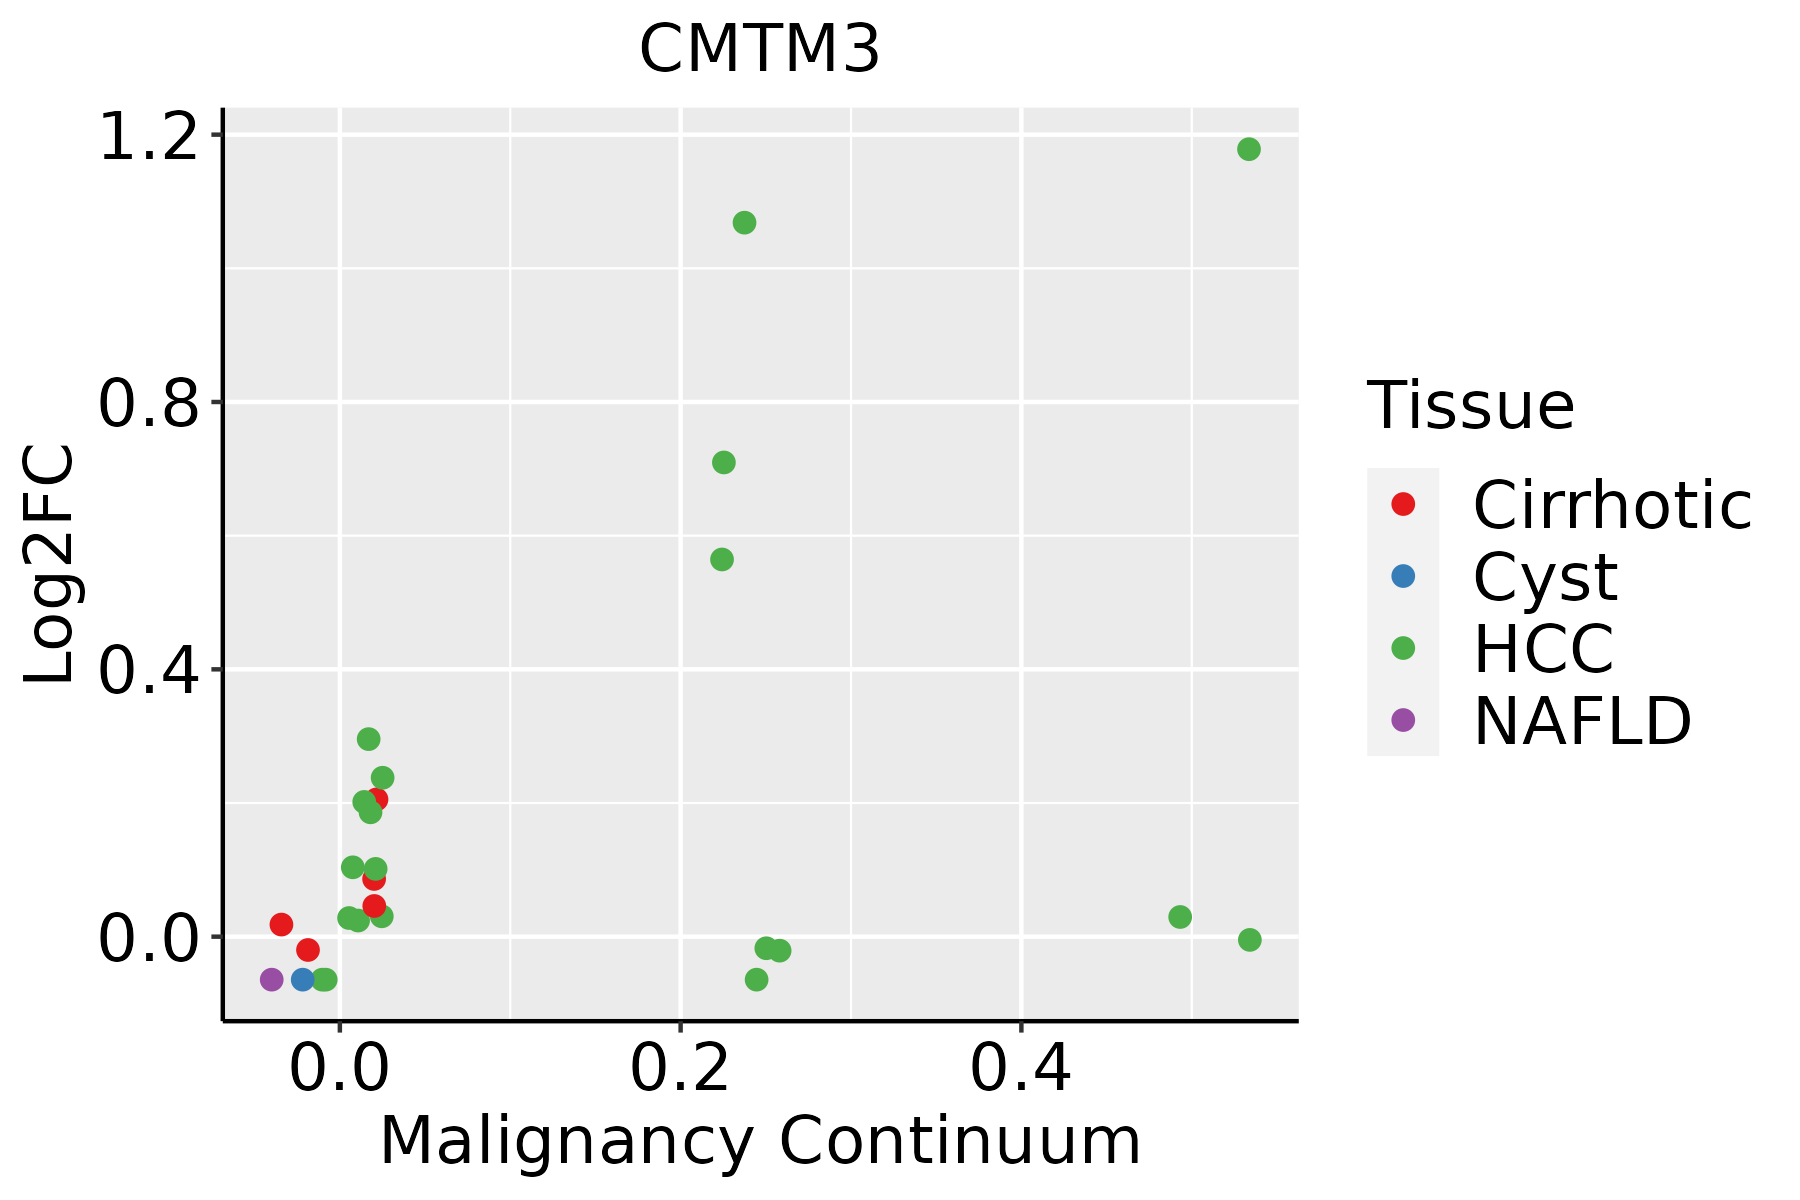 | HCC: Hepatocellular carcinoma |
| NAFLD: Non-alcoholic fatty liver disease | ||
| Oral Cavity | 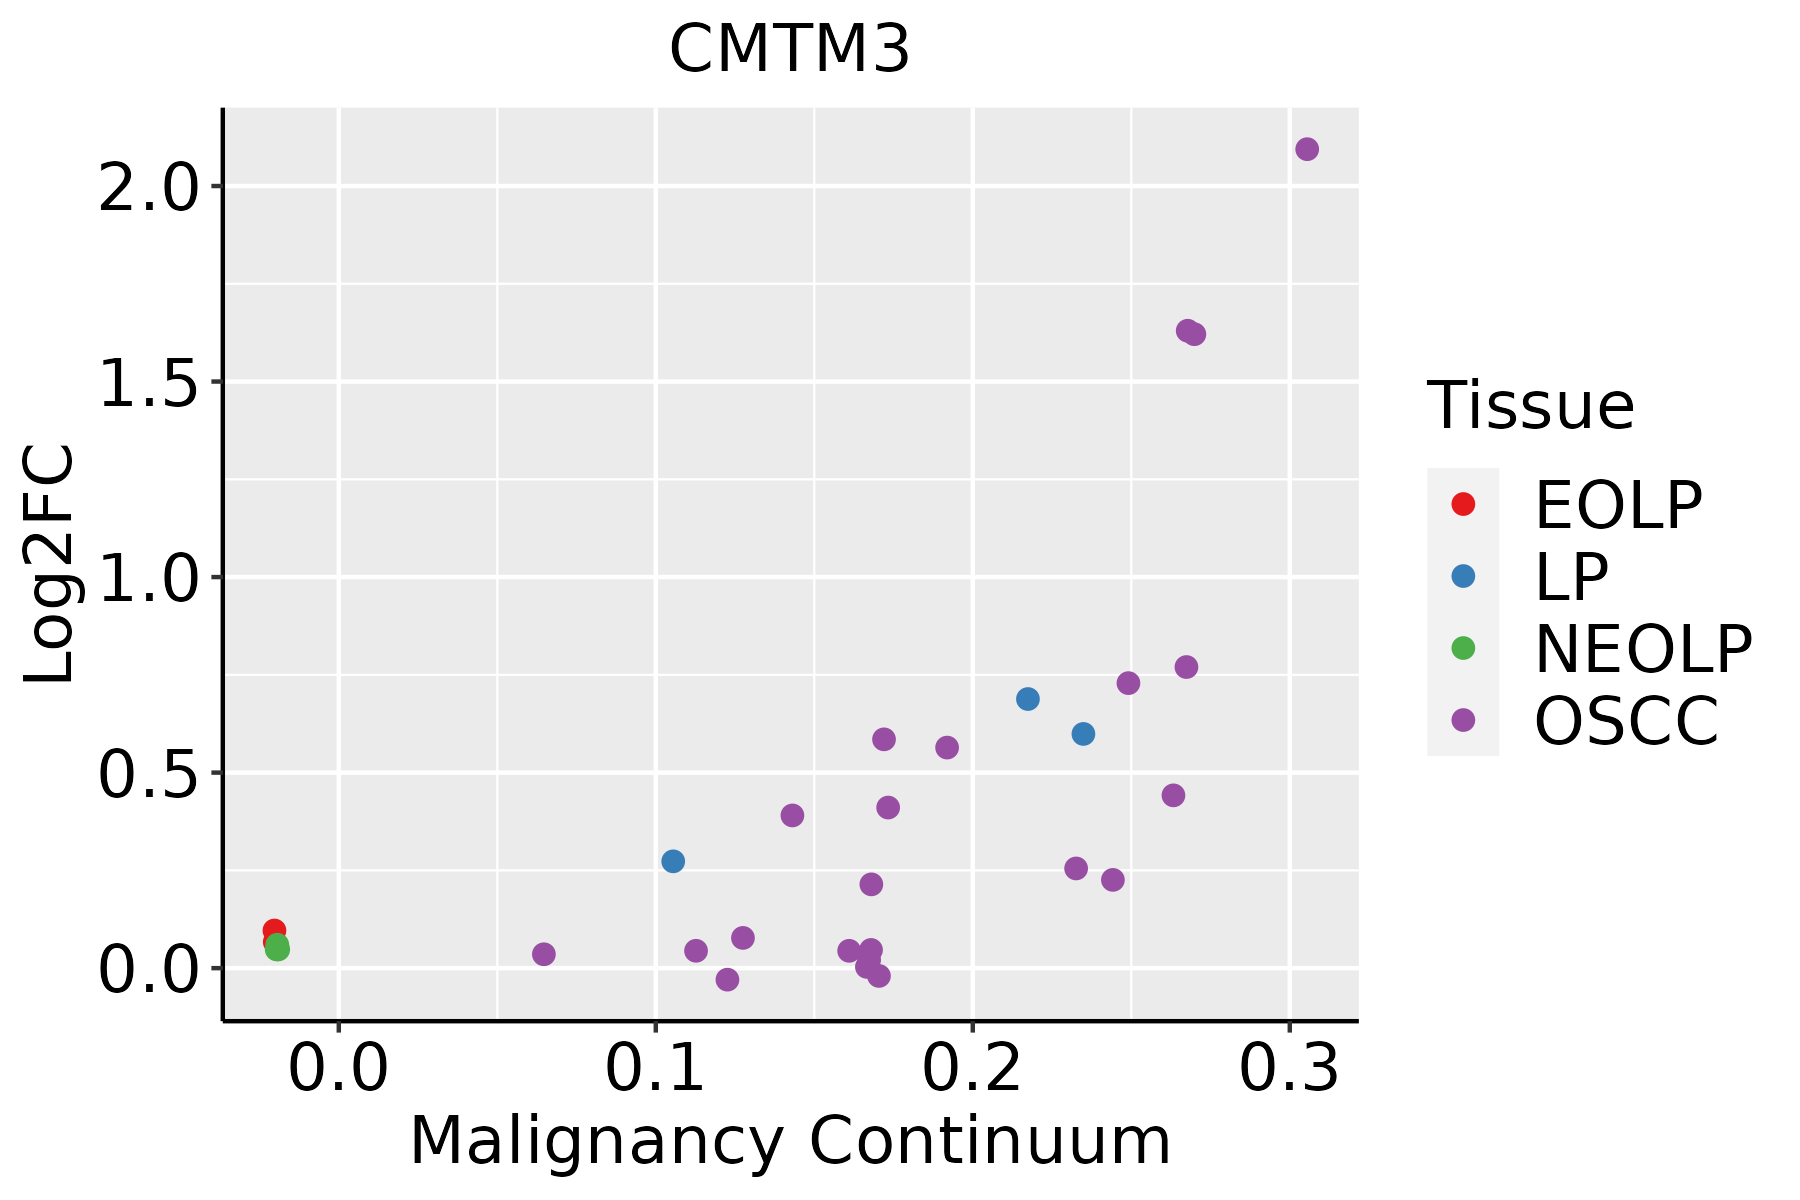 | EOLP: Erosive Oral lichen planus |
| LP: leukoplakia | ||
| NEOLP: Non-erosive oral lichen planus | ||
| OSCC: Oral squamous cell carcinoma | ||
| Thyroid | 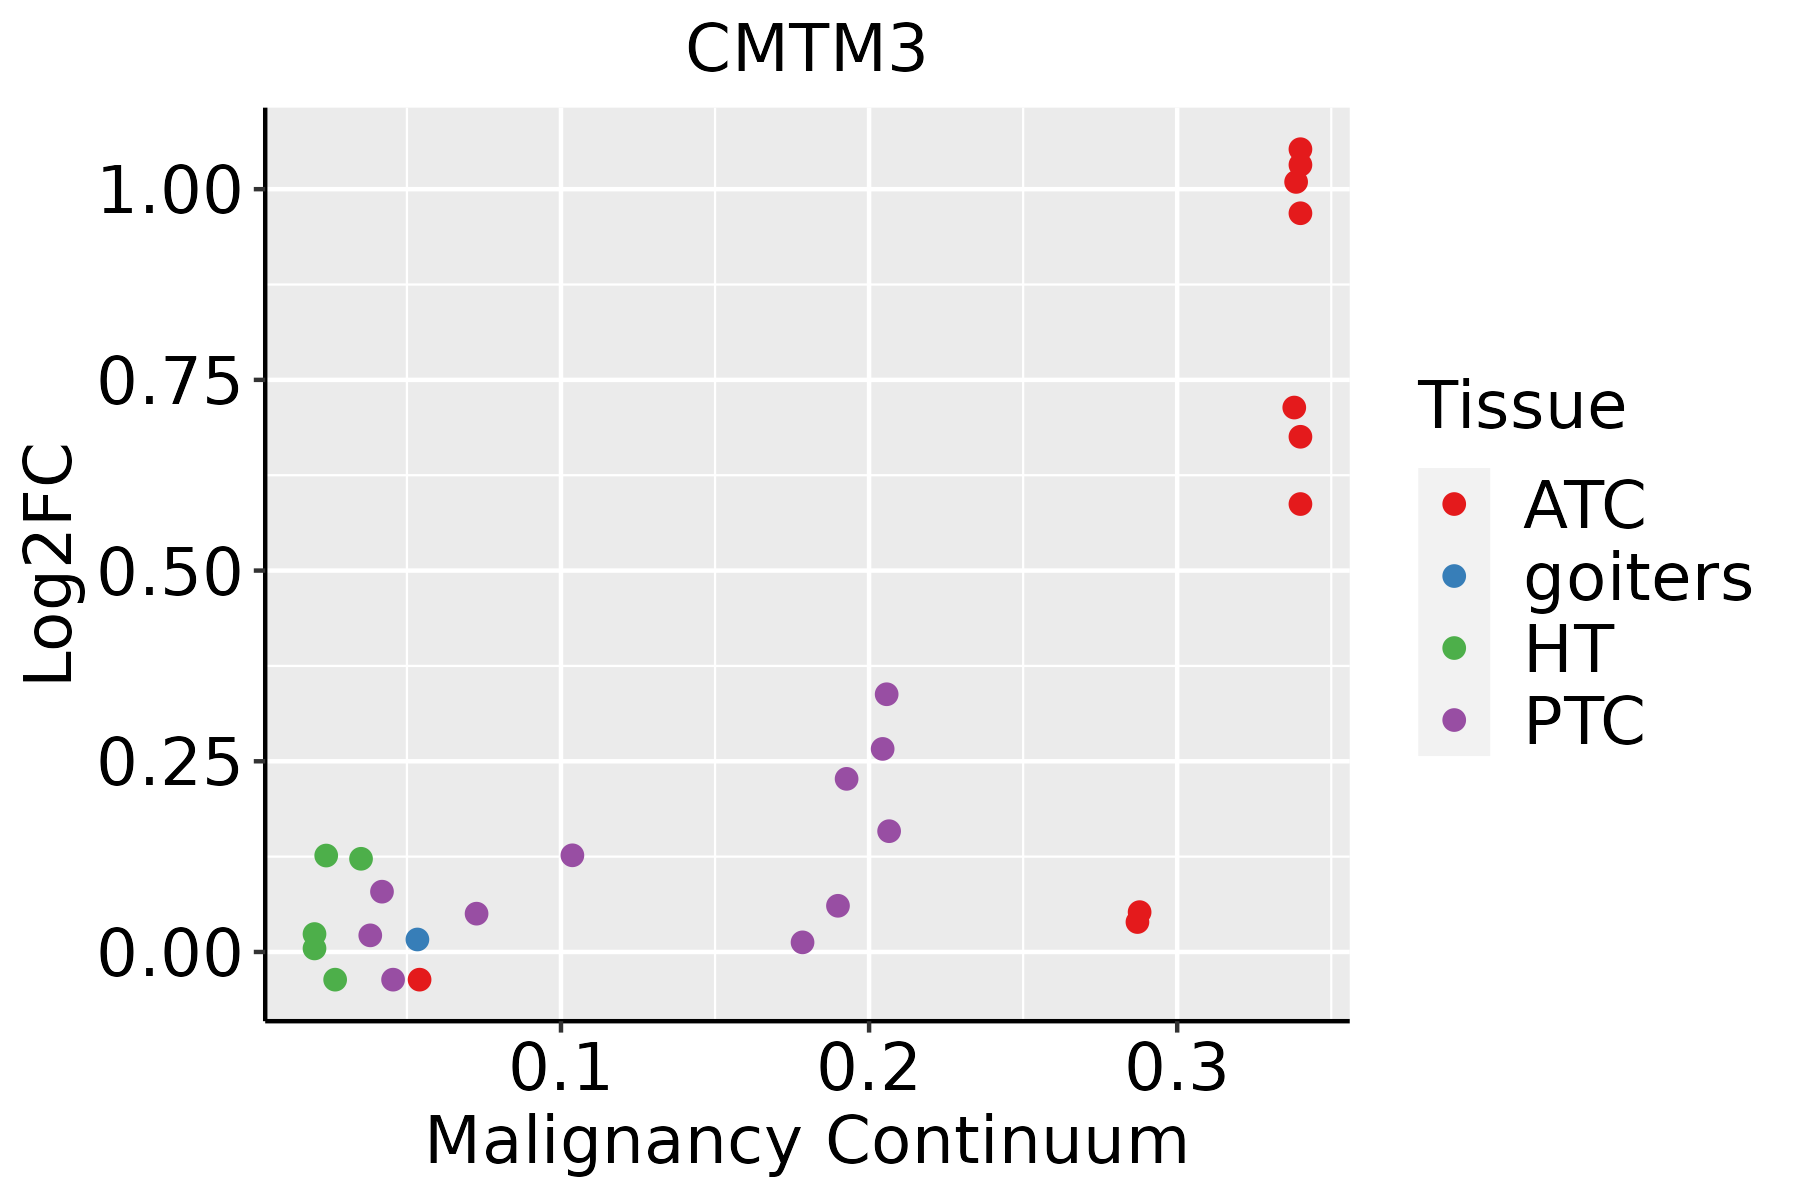 | ATC: Anaplastic thyroid cancer |
| HT: Hashimoto's thyroiditis | ||
| PTC: Papillary thyroid cancer |
| ∗log2FC in expression of this searched gene in stem-like cells from each diseased tissue sample relative to stem-like cells in normal samples in each tissue plotted against the malignancy continuum. Samples are colored based on if they are from different disease stage. |
Top |
Malignant transformation related pathway analysis |
| Find out the enriched GO biological processes and KEGG pathways involved in transition from healthy to precancer to cancer |
| Tissue | Disease Stage | Enriched GO biological Processes |
| Colorectum | AD |  |
| Colorectum | SER |  |
| Colorectum | MSS |  |
| Colorectum | MSI-H |  |
| Colorectum | FAP |  |
| ∗Top 15 enriched GO BP terms are showed in the bar plot of each disease state in each tissue. Each row represents a significant GO biological process which is colored according to the -log10(p.adjust). |
| Page: 1 2 3 4 5 6 7 8 9 |
| GO ID | Tissue | Disease Stage | Description | Gene Ratio | Bg Ratio | pvalue | p.adjust | Count |
| GO:000170119 | Esophagus | ESCC | in utero embryonic development | 243/8552 | 367/18723 | 1.00e-15 | 6.86e-14 | 243 |
| GO:000182412 | Esophagus | ESCC | blastocyst development | 73/8552 | 106/18723 | 1.13e-06 | 1.40e-05 | 73 |
| GO:00017015 | Liver | Cirrhotic | in utero embryonic development | 134/4634 | 367/18723 | 2.78e-07 | 6.86e-06 | 134 |
| GO:000170111 | Liver | HCC | in utero embryonic development | 204/7958 | 367/18723 | 2.44e-07 | 4.30e-06 | 204 |
| GO:000170116 | Oral cavity | OSCC | in utero embryonic development | 207/7305 | 367/18723 | 7.92e-12 | 2.95e-10 | 207 |
| GO:00018243 | Oral cavity | OSCC | blastocyst development | 66/7305 | 106/18723 | 1.04e-06 | 1.40e-05 | 66 |
| GO:00027646 | Oral cavity | OSCC | immune response-regulating signaling pathway | 212/7305 | 468/18723 | 2.93e-03 | 1.27e-02 | 212 |
| GO:000170117 | Oral cavity | LP | in utero embryonic development | 142/4623 | 367/18723 | 1.48e-09 | 6.75e-08 | 142 |
| GO:000182411 | Oral cavity | LP | blastocyst development | 46/4623 | 106/18723 | 1.86e-05 | 3.15e-04 | 46 |
| GO:0001701111 | Thyroid | PTC | in utero embryonic development | 175/5968 | 367/18723 | 1.40e-10 | 4.73e-09 | 175 |
| GO:00018246 | Thyroid | PTC | blastocyst development | 49/5968 | 106/18723 | 1.37e-03 | 7.72e-03 | 49 |
| GO:000170126 | Thyroid | ATC | in utero embryonic development | 183/6293 | 367/18723 | 6.62e-11 | 2.11e-09 | 183 |
| GO:000182414 | Thyroid | ATC | blastocyst development | 53/6293 | 106/18723 | 3.48e-04 | 2.16e-03 | 53 |
| Page: 1 |
| Pathway ID | Tissue | Disease Stage | Description | Gene Ratio | Bg Ratio | pvalue | p.adjust | qvalue | Count |
| Page: 1 |
Top |
Cell-cell communication analysis |
| Identification of potential cell-cell interactions between two cell types and their ligand-receptor pairs for different disease states |
| Ligand | Receptor | LRpair | Pathway | Tissue | Disease Stage |
| Page: 1 |
Top |
Single-cell gene regulatory network inference analysis |
| Find out the significant the regulons (TFs) and the target genes of each regulon across cell types for different disease states |
| TF | Cell Type | Tissue | Disease Stage | Target Gene | RSS | Regulon Activity |
| ∗The dot plots of a searched regulon are shown for all cell subpopulations in each disease state of each tissue based on the regulon specific score inferred using pySCENIC and by calculating the average expression. |
| Page: 1 |
Top |
Somatic mutation of malignant transformation related genes |
| Annotation of somatic variants for genes involved in malignant transformation |
| Hugo Symbol | Variant Class | Variant Classification | dbSNP RS | HGVSc | HGVSp | HGVSp Short | SWISSPROT | BIOTYPE | SIFT | PolyPhen | Tumor Sample Barcode | Tissue | Histology | Sex | Age | Stage | Therapy Types | Drugs | Outcome |
| CMTM3 | SNV | Missense_Mutation | rs545909802 | c.356C>T | p.Thr119Met | p.T119M | Q96MX0 | protein_coding | tolerated(0.21) | benign(0.201) | TCGA-2W-A8YY-01 | Cervix | cervical & endocervical cancer | Female | <65 | I/II | Chemotherapy | cisplatin | CR |
| CMTM3 | SNV | Missense_Mutation | rs778469660 | c.313N>T | p.Arg105Cys | p.R105C | Q96MX0 | protein_coding | deleterious(0.05) | possibly_damaging(0.701) | TCGA-AD-6964-01 | Colorectum | colon adenocarcinoma | Male | <65 | III/IV | Chemotherapy | folfox | PD |
| CMTM3 | SNV | Missense_Mutation | novel | c.382G>C | p.Ala128Pro | p.A128P | Q96MX0 | protein_coding | deleterious(0.03) | probably_damaging(0.968) | TCGA-CK-4951-01 | Colorectum | colon adenocarcinoma | Female | >=65 | I/II | Unknown | Unknown | PD |
| CMTM3 | SNV | Missense_Mutation | c.190G>A | p.Ala64Thr | p.A64T | Q96MX0 | protein_coding | tolerated(0.06) | probably_damaging(0.989) | TCGA-CK-6746-01 | Colorectum | colon adenocarcinoma | Female | >=65 | I/II | Unknown | Unknown | SD | |
| CMTM3 | SNV | Missense_Mutation | rs777705777 | c.460N>A | p.Val154Met | p.V154M | Q96MX0 | protein_coding | tolerated(0.15) | benign(0.127) | TCGA-CM-6162-01 | Colorectum | colon adenocarcinoma | Female | <65 | III/IV | Chemotherapy | oxaliplatin | SD |
| CMTM3 | SNV | Missense_Mutation | rs372483559 | c.364G>A | p.Ala122Thr | p.A122T | Q96MX0 | protein_coding | tolerated(0.59) | benign(0.027) | TCGA-D5-6930-01 | Colorectum | colon adenocarcinoma | Male | >=65 | I/II | Unknown | Unknown | SD |
| CMTM3 | SNV | Missense_Mutation | novel | c.167N>G | p.Phe56Cys | p.F56C | Q96MX0 | protein_coding | deleterious(0) | probably_damaging(0.947) | TCGA-EI-6917-01 | Colorectum | rectum adenocarcinoma | Male | <65 | III/IV | Chemotherapy | 5fluorouracil+oxaciplatina+l-folinian | SD |
| CMTM3 | SNV | Missense_Mutation | c.472N>A | p.Leu158Ile | p.L158I | Q96MX0 | protein_coding | deleterious(0.02) | probably_damaging(0.947) | TCGA-A5-A1OF-01 | Endometrium | uterine corpus endometrioid carcinoma | Female | <65 | I/II | Unknown | Unknown | SD | |
| CMTM3 | SNV | Missense_Mutation | rs777282641 | c.374C>T | p.Ser125Leu | p.S125L | Q96MX0 | protein_coding | tolerated(0.19) | benign(0.146) | TCGA-AJ-A3NE-01 | Endometrium | uterine corpus endometrioid carcinoma | Female | <65 | I/II | Unknown | Unknown | SD |
| CMTM3 | SNV | Missense_Mutation | novel | c.491N>T | p.Ala164Val | p.A164V | Q96MX0 | protein_coding | tolerated(0.08) | benign(0.036) | TCGA-AX-A2HG-01 | Endometrium | uterine corpus endometrioid carcinoma | Female | <65 | I/II | Unknown | Unknown | SD |
| Page: 1 2 |
Top |
Related drugs of malignant transformation related genes |
| Identification of chemicals and drugs interact with genes involved in malignant transfromation |
| (DGIdb 4.0) |
| Entrez ID | Symbol | Category | Interaction Types | Drug Claim Name | Drug Name | PMIDs |
| Page: 1 |

Copyright 2023-Present -The University of Texas Health Science Center at Houston |