
|
|||||
|
 | |
| |
| |
| |
| |
| |
|
Gene: CLIP1 |
Gene summary for CLIP1 |
| Gene information | Species | Human | Gene symbol | CLIP1 | Gene ID | 6249 |
| Gene name | CAP-Gly domain containing linker protein 1 | |
| Gene Alias | CLIP | |
| Cytomap | 12q24.31 | |
| Gene Type | protein-coding | GO ID | GO:0000226 | UniProtAcc | P30622 |
Top |
Malignant transformation analysis |
| Identification of the aberrant gene expression in precancerous and cancerous lesions by comparing the gene expression of stem-like cells in diseased tissues with normal stem cells |
| Entrez ID | Symbol | Replicates | Species | Organ | Tissue | Adj P-value | Log2FC | Malignancy |
| 6249 | CLIP1 | P48T-E | Human | Esophagus | ESCC | 3.04e-24 | 5.51e-01 | 0.0959 |
| 6249 | CLIP1 | P49T-E | Human | Esophagus | ESCC | 1.68e-10 | 1.24e+00 | 0.1768 |
| 6249 | CLIP1 | P52T-E | Human | Esophagus | ESCC | 1.77e-23 | 6.17e-01 | 0.1555 |
| 6249 | CLIP1 | P54T-E | Human | Esophagus | ESCC | 1.25e-27 | 6.78e-01 | 0.0975 |
| 6249 | CLIP1 | P56T-E | Human | Esophagus | ESCC | 1.34e-06 | 6.63e-01 | 0.1613 |
| 6249 | CLIP1 | P57T-E | Human | Esophagus | ESCC | 1.69e-16 | 3.83e-01 | 0.0926 |
| 6249 | CLIP1 | P61T-E | Human | Esophagus | ESCC | 2.75e-17 | 4.39e-01 | 0.099 |
| 6249 | CLIP1 | P62T-E | Human | Esophagus | ESCC | 1.07e-48 | 8.96e-01 | 0.1302 |
| 6249 | CLIP1 | P65T-E | Human | Esophagus | ESCC | 4.80e-31 | 5.00e-01 | 0.0978 |
| 6249 | CLIP1 | P74T-E | Human | Esophagus | ESCC | 7.99e-28 | 7.16e-01 | 0.1479 |
| 6249 | CLIP1 | P75T-E | Human | Esophagus | ESCC | 3.28e-47 | 1.00e+00 | 0.1125 |
| 6249 | CLIP1 | P76T-E | Human | Esophagus | ESCC | 1.68e-23 | 5.33e-01 | 0.1207 |
| 6249 | CLIP1 | P79T-E | Human | Esophagus | ESCC | 4.45e-30 | 6.14e-01 | 0.1154 |
| 6249 | CLIP1 | P80T-E | Human | Esophagus | ESCC | 3.18e-57 | 1.63e+00 | 0.155 |
| 6249 | CLIP1 | P82T-E | Human | Esophagus | ESCC | 6.95e-27 | 1.37e+00 | 0.1072 |
| 6249 | CLIP1 | P83T-E | Human | Esophagus | ESCC | 2.82e-21 | 5.55e-01 | 0.1738 |
| 6249 | CLIP1 | P84T-E | Human | Esophagus | ESCC | 7.60e-09 | 3.82e-01 | 0.0933 |
| 6249 | CLIP1 | P89T-E | Human | Esophagus | ESCC | 2.06e-16 | 1.26e+00 | 0.1752 |
| 6249 | CLIP1 | P91T-E | Human | Esophagus | ESCC | 6.41e-08 | 1.03e+00 | 0.1828 |
| 6249 | CLIP1 | P104T-E | Human | Esophagus | ESCC | 4.66e-07 | 4.11e-01 | 0.0931 |
| Page: 1 2 3 4 5 6 7 8 9 |
| Tissue | Expression Dynamics | Abbreviation |
| Breast | 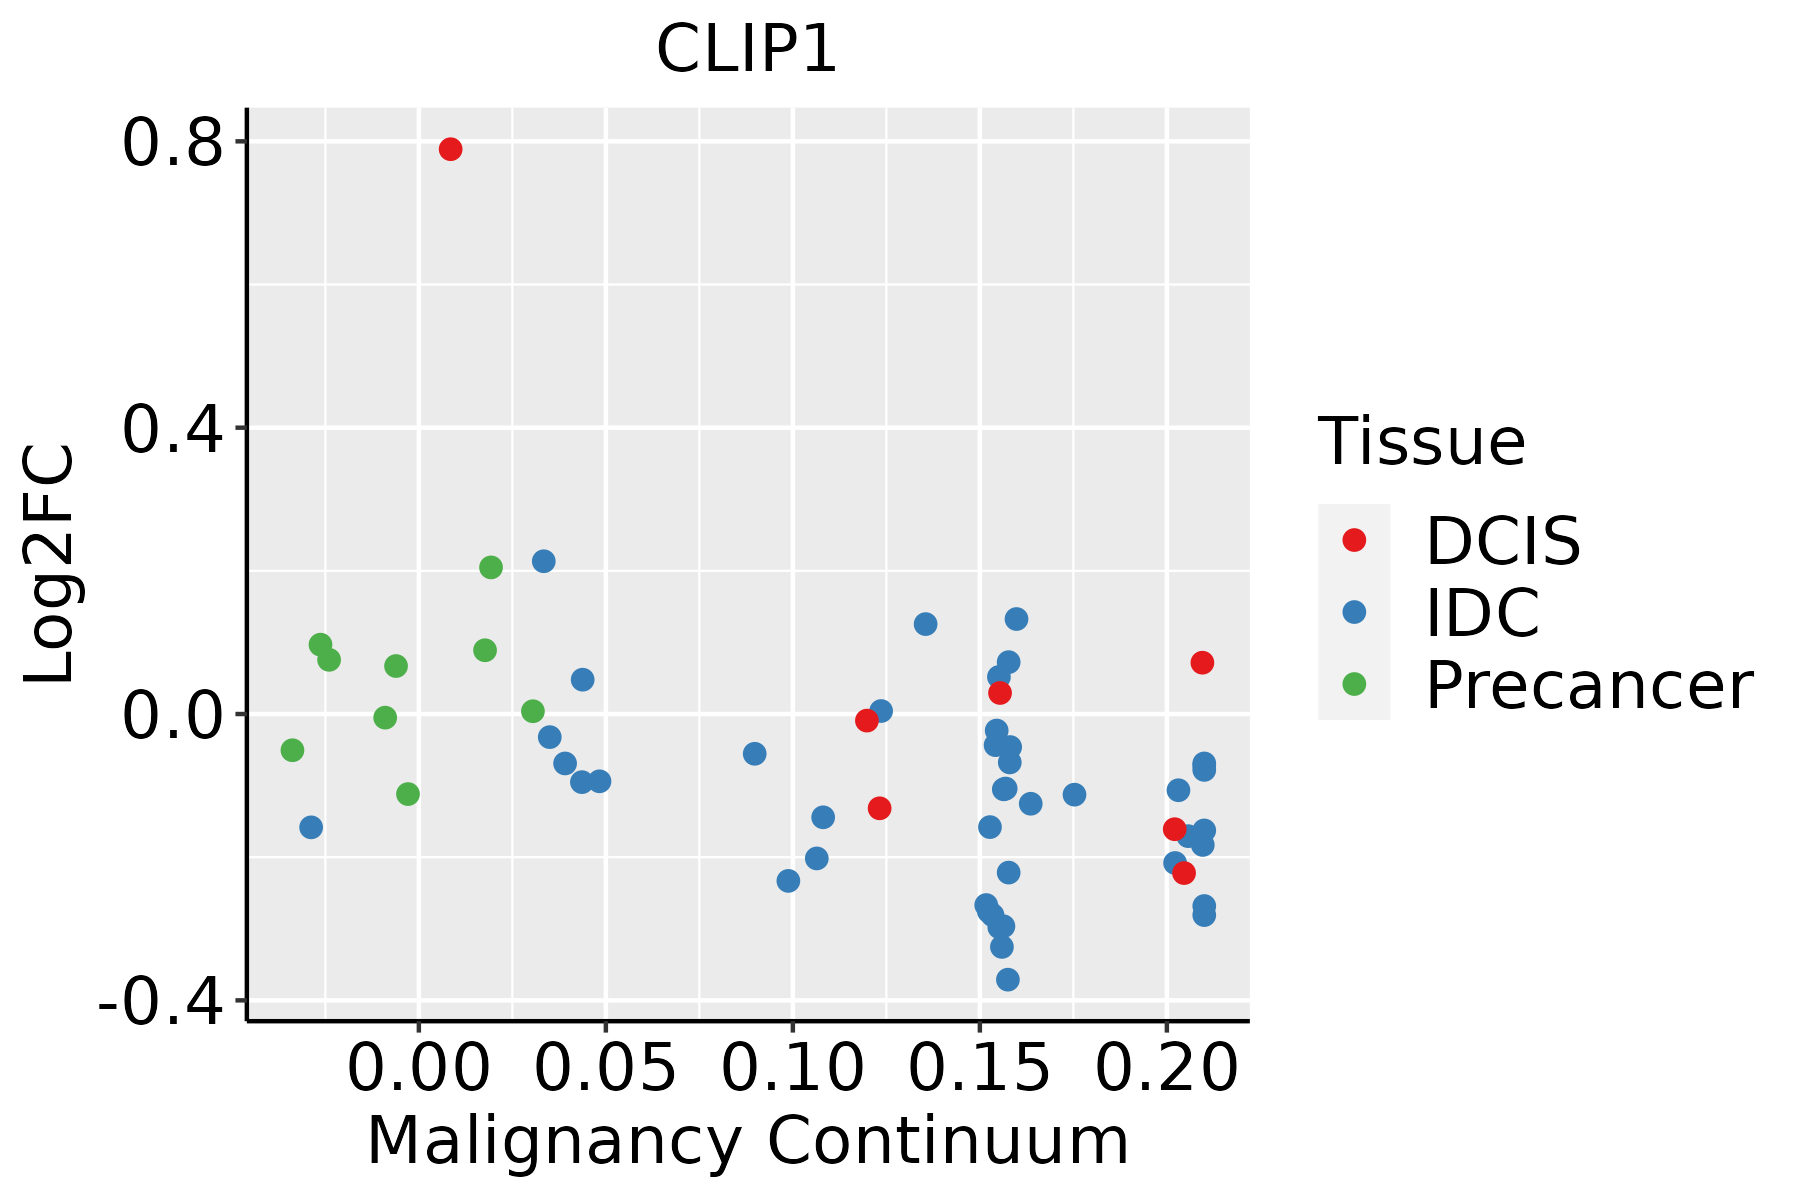 | IDC: Invasive ductal carcinoma |
| DCIS: Ductal carcinoma in situ | ||
| Precancer(BRCA1-mut): Precancerous lesion from BRCA1 mutation carriers | ||
| Cervix |  | CC: Cervix cancer |
| HSIL_HPV: HPV-infected high-grade squamous intraepithelial lesions | ||
| N_HPV: HPV-infected normal cervix | ||
| Esophagus | 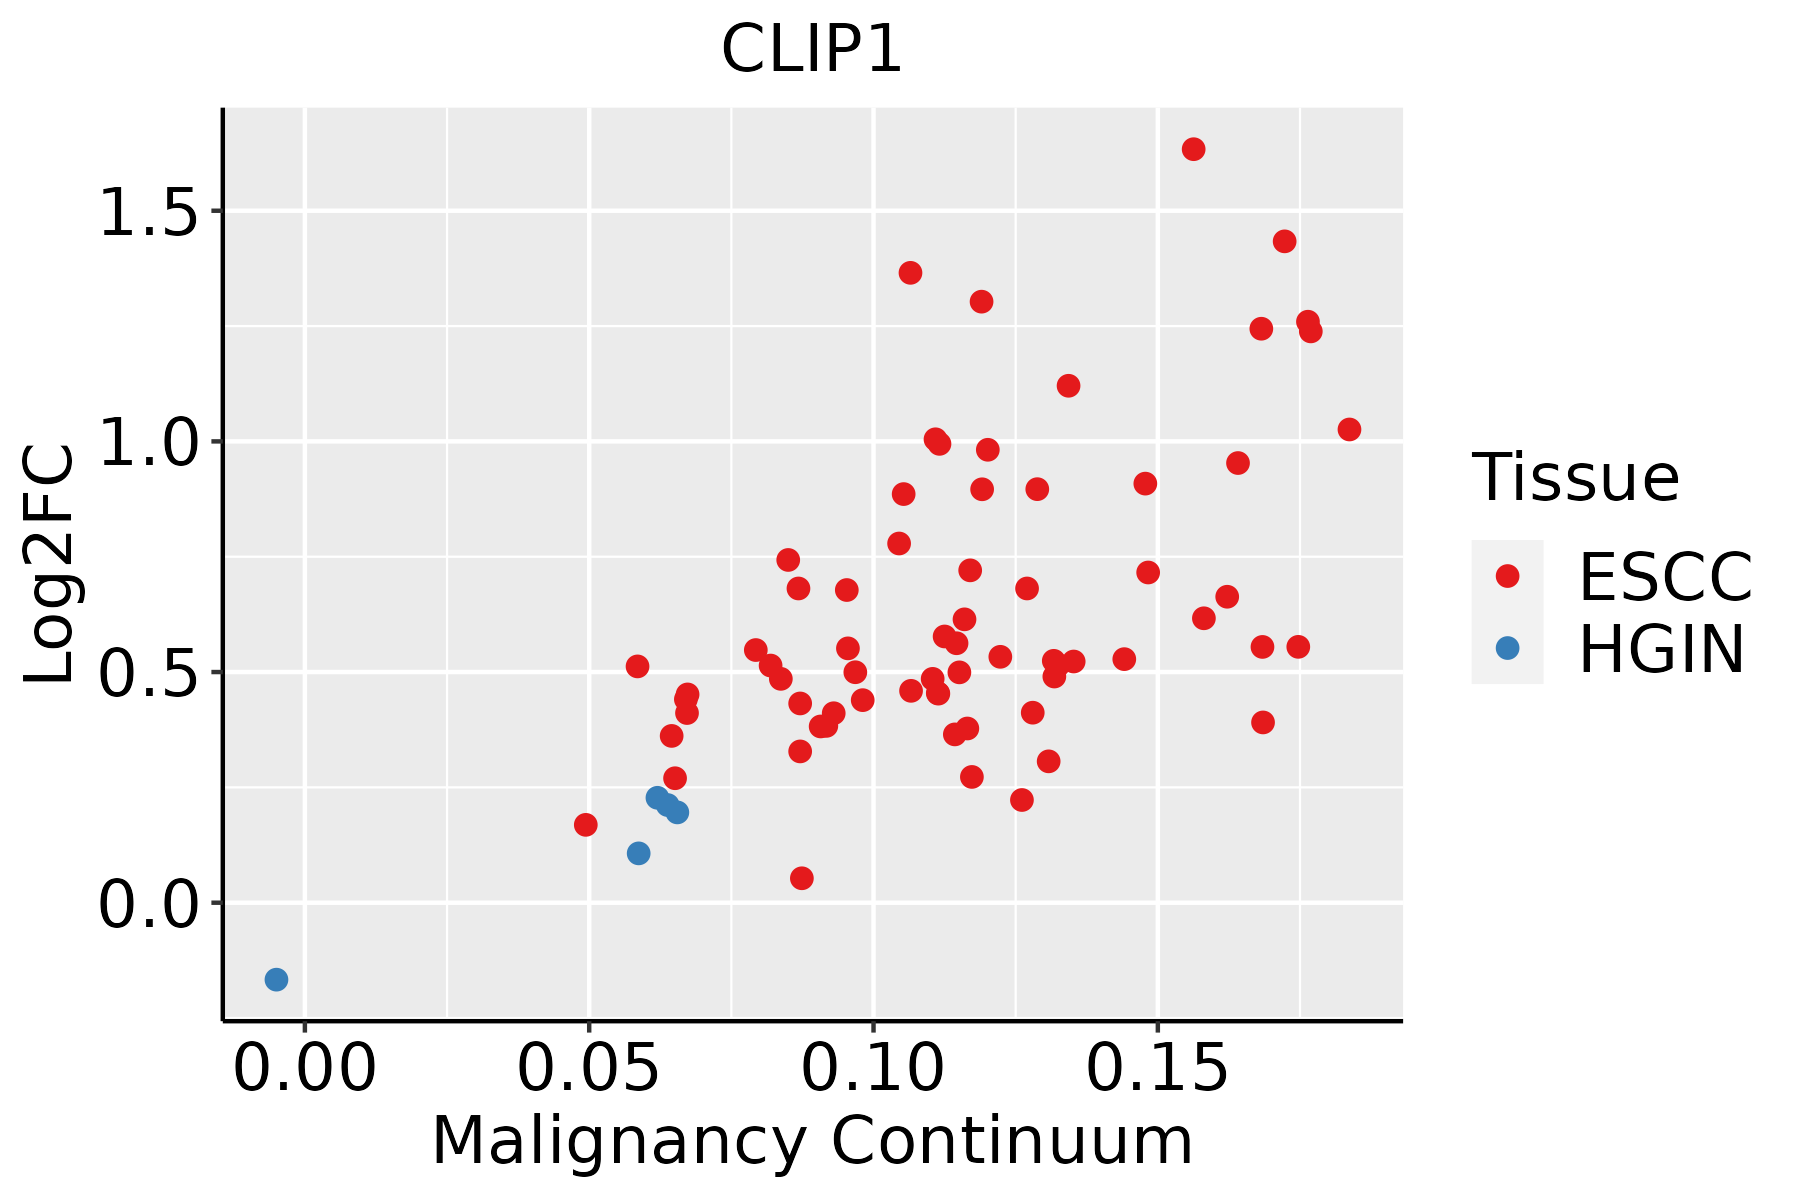 | ESCC: Esophageal squamous cell carcinoma |
| HGIN: High-grade intraepithelial neoplasias | ||
| LGIN: Low-grade intraepithelial neoplasias | ||
| Liver |  | HCC: Hepatocellular carcinoma |
| NAFLD: Non-alcoholic fatty liver disease | ||
| Lung | 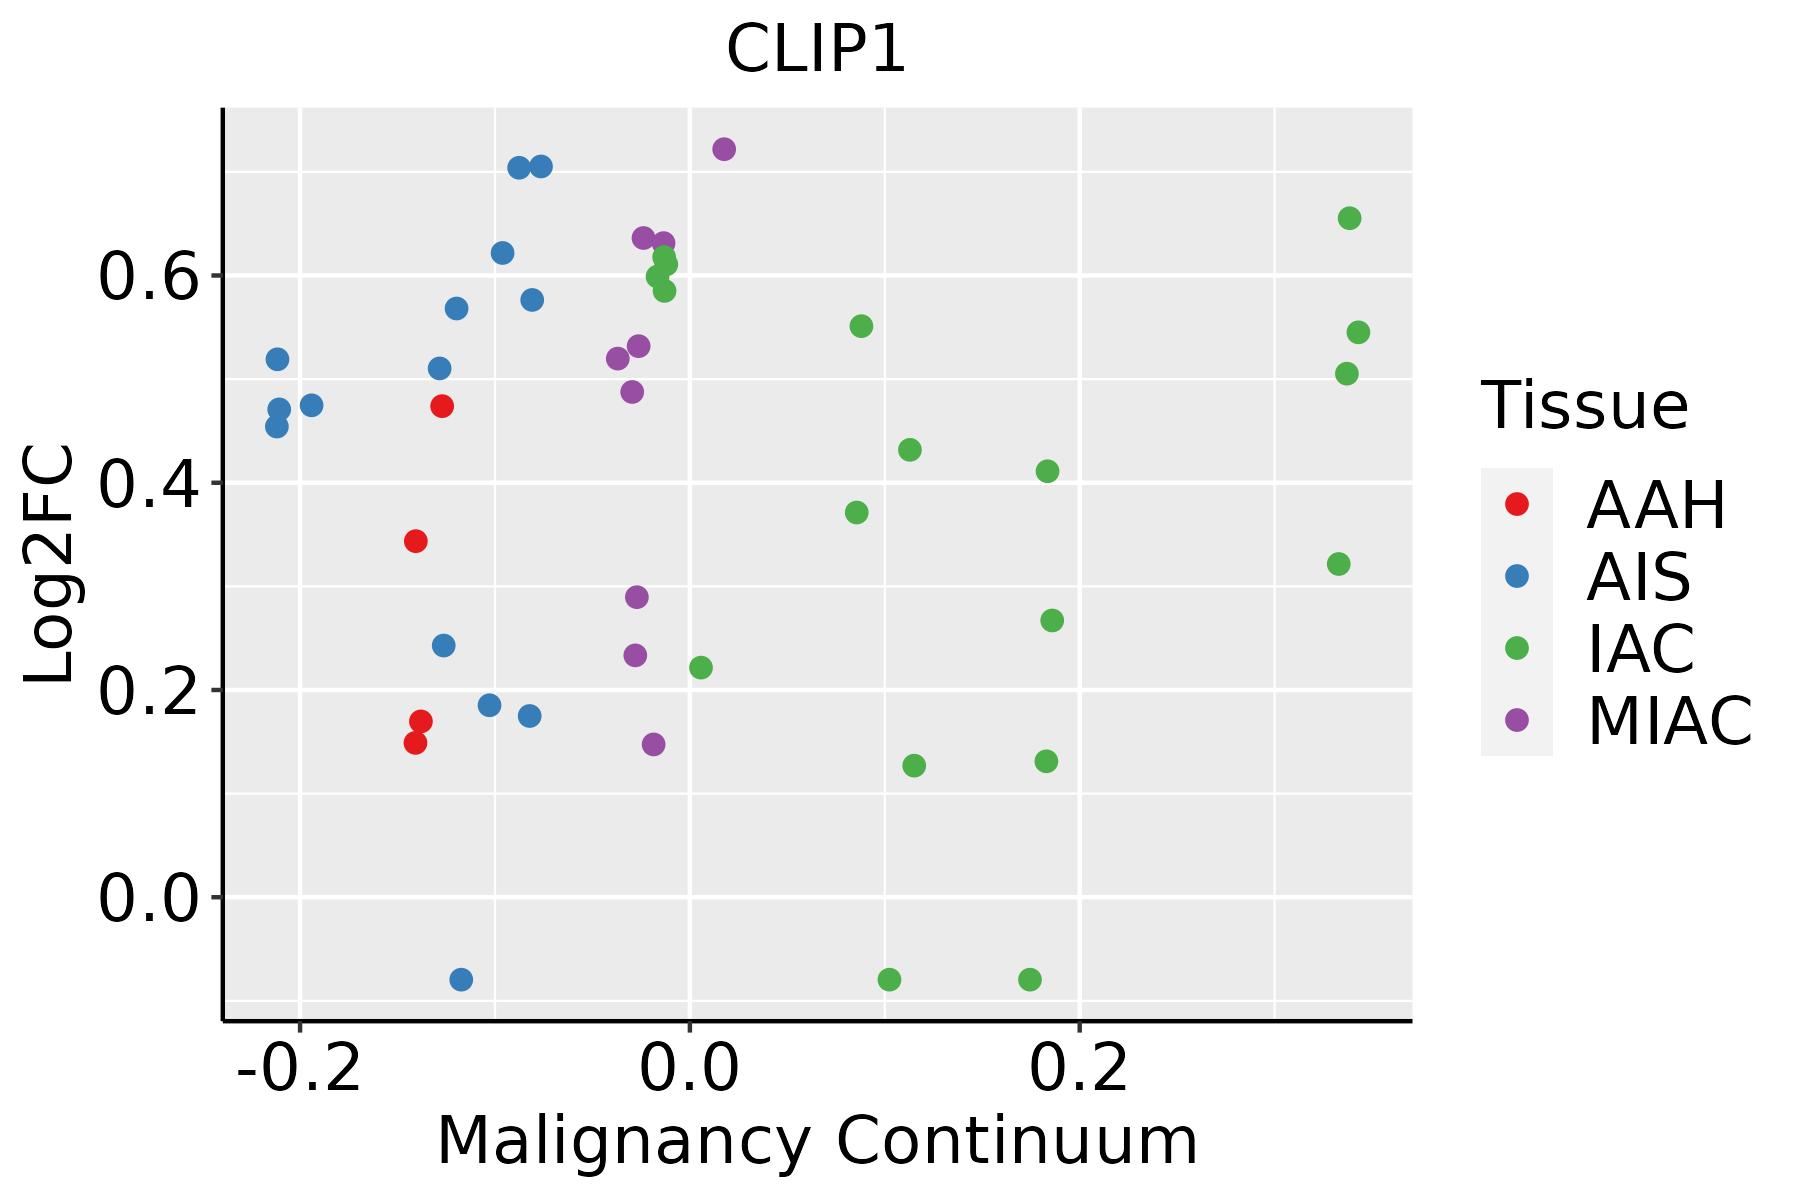 | AAH: Atypical adenomatous hyperplasia |
| AIS: Adenocarcinoma in situ | ||
| IAC: Invasive lung adenocarcinoma | ||
| MIA: Minimally invasive adenocarcinoma | ||
| Oral Cavity | 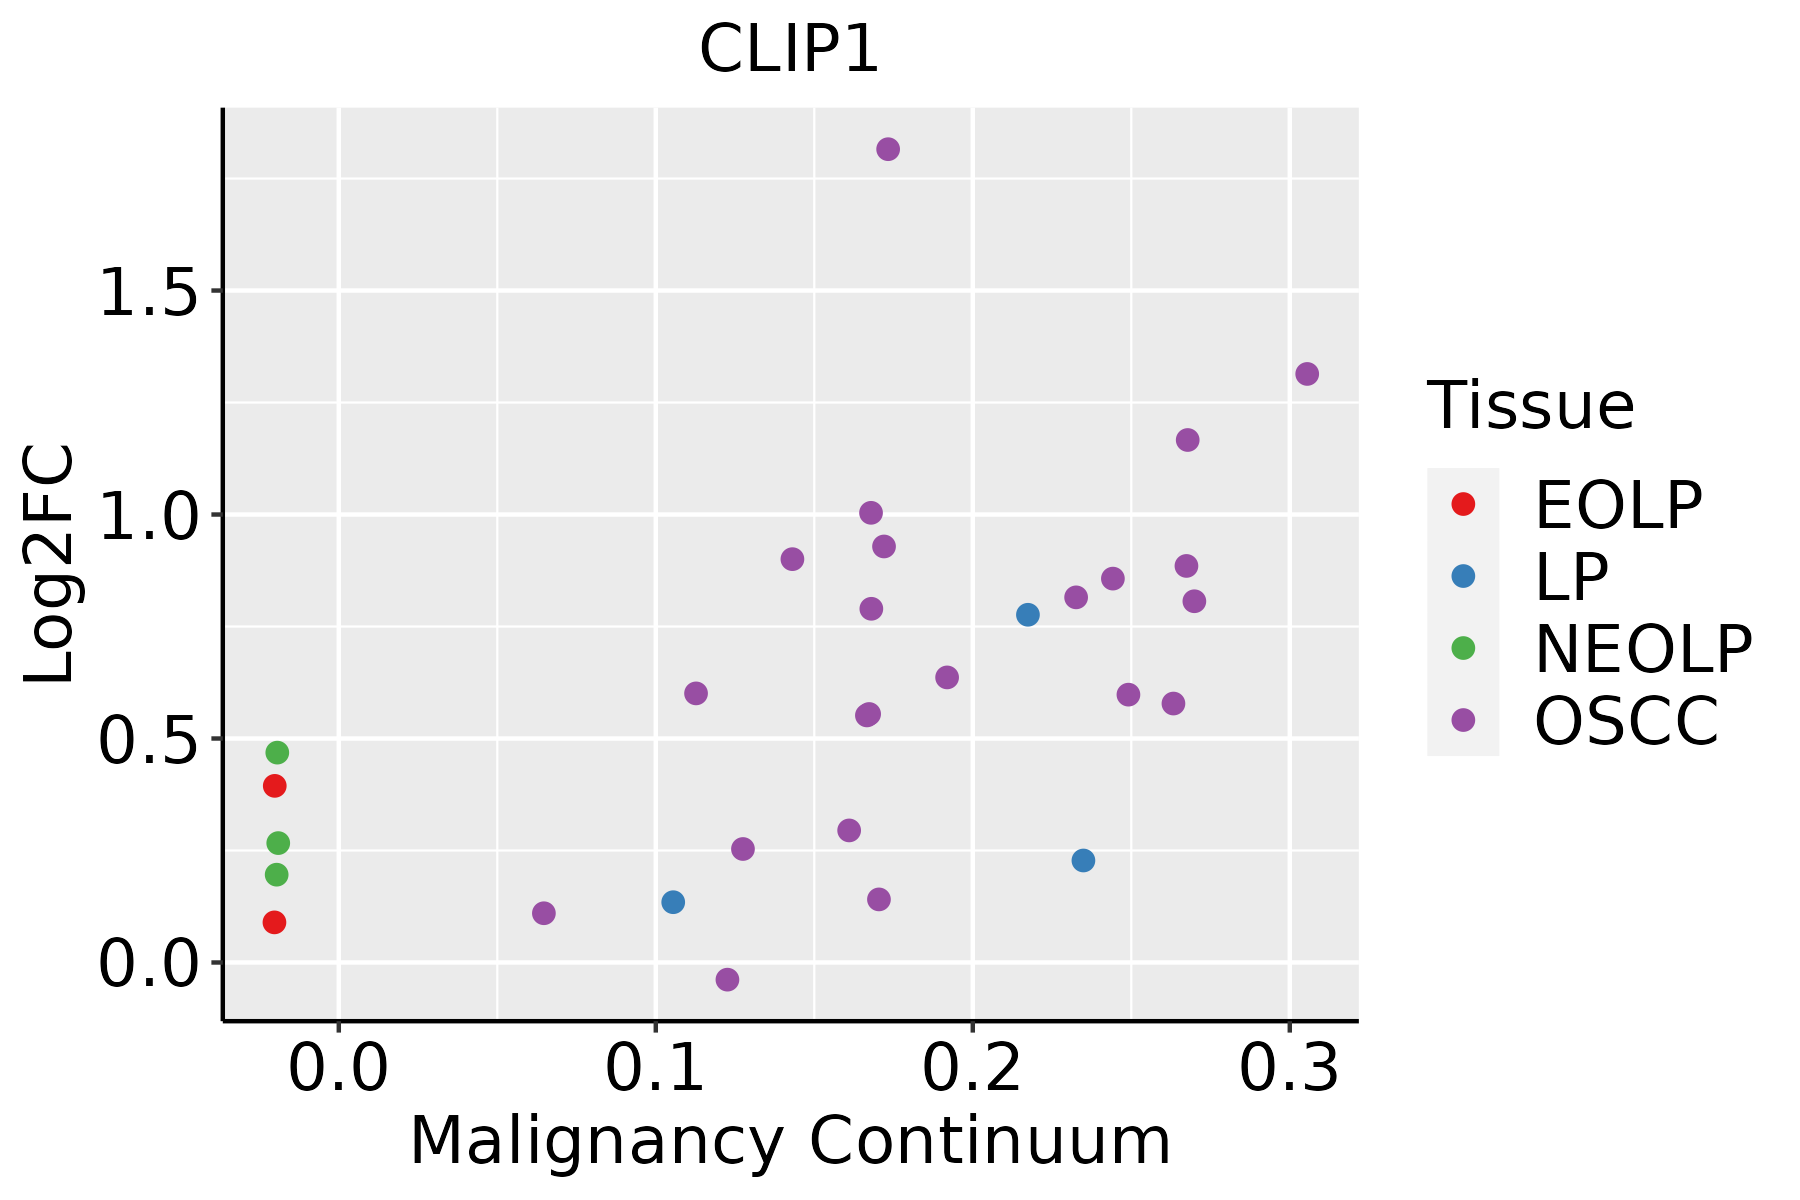 | EOLP: Erosive Oral lichen planus |
| LP: leukoplakia | ||
| NEOLP: Non-erosive oral lichen planus | ||
| OSCC: Oral squamous cell carcinoma | ||
| Prostate | 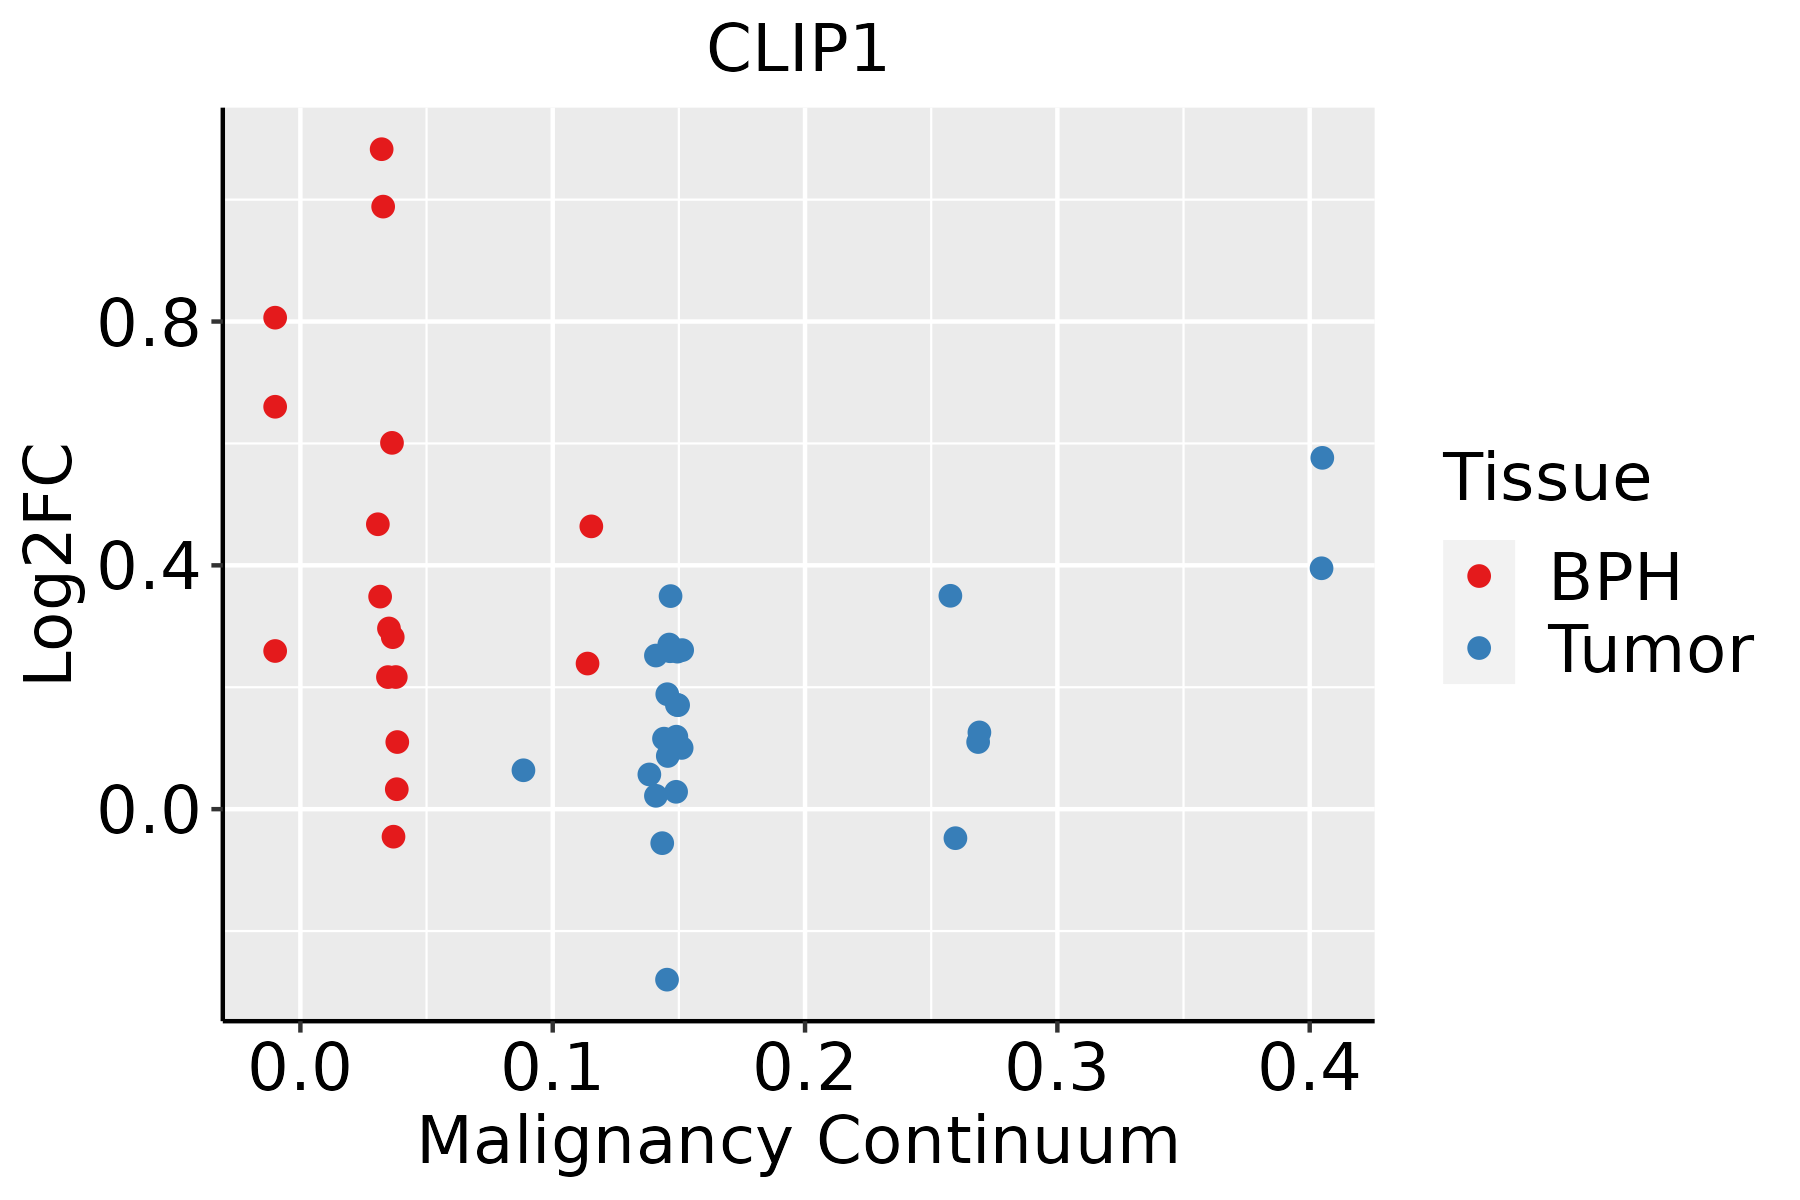 | BPH: Benign Prostatic Hyperplasia |
| Skin | 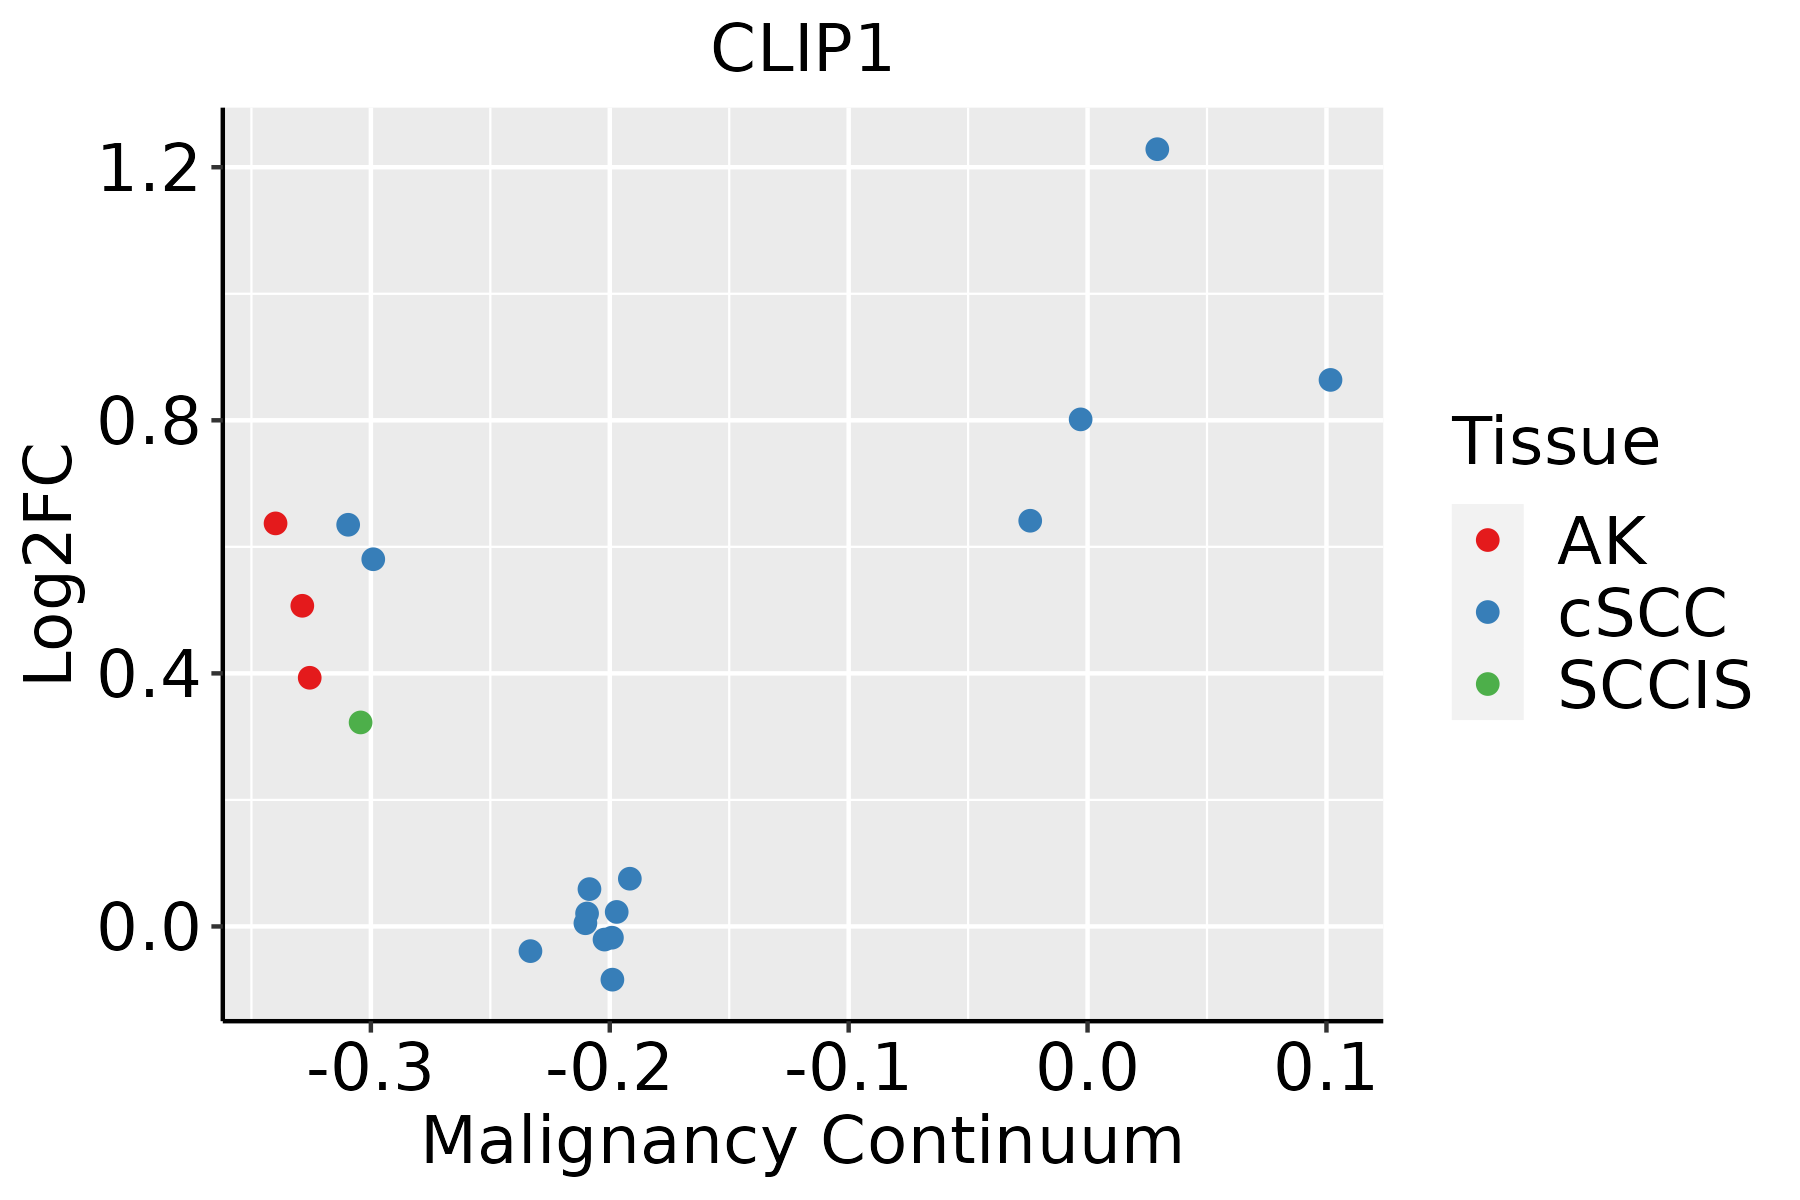 | AK: Actinic keratosis |
| cSCC: Cutaneous squamous cell carcinoma | ||
| SCCIS:squamous cell carcinoma in situ | ||
| Thyroid | 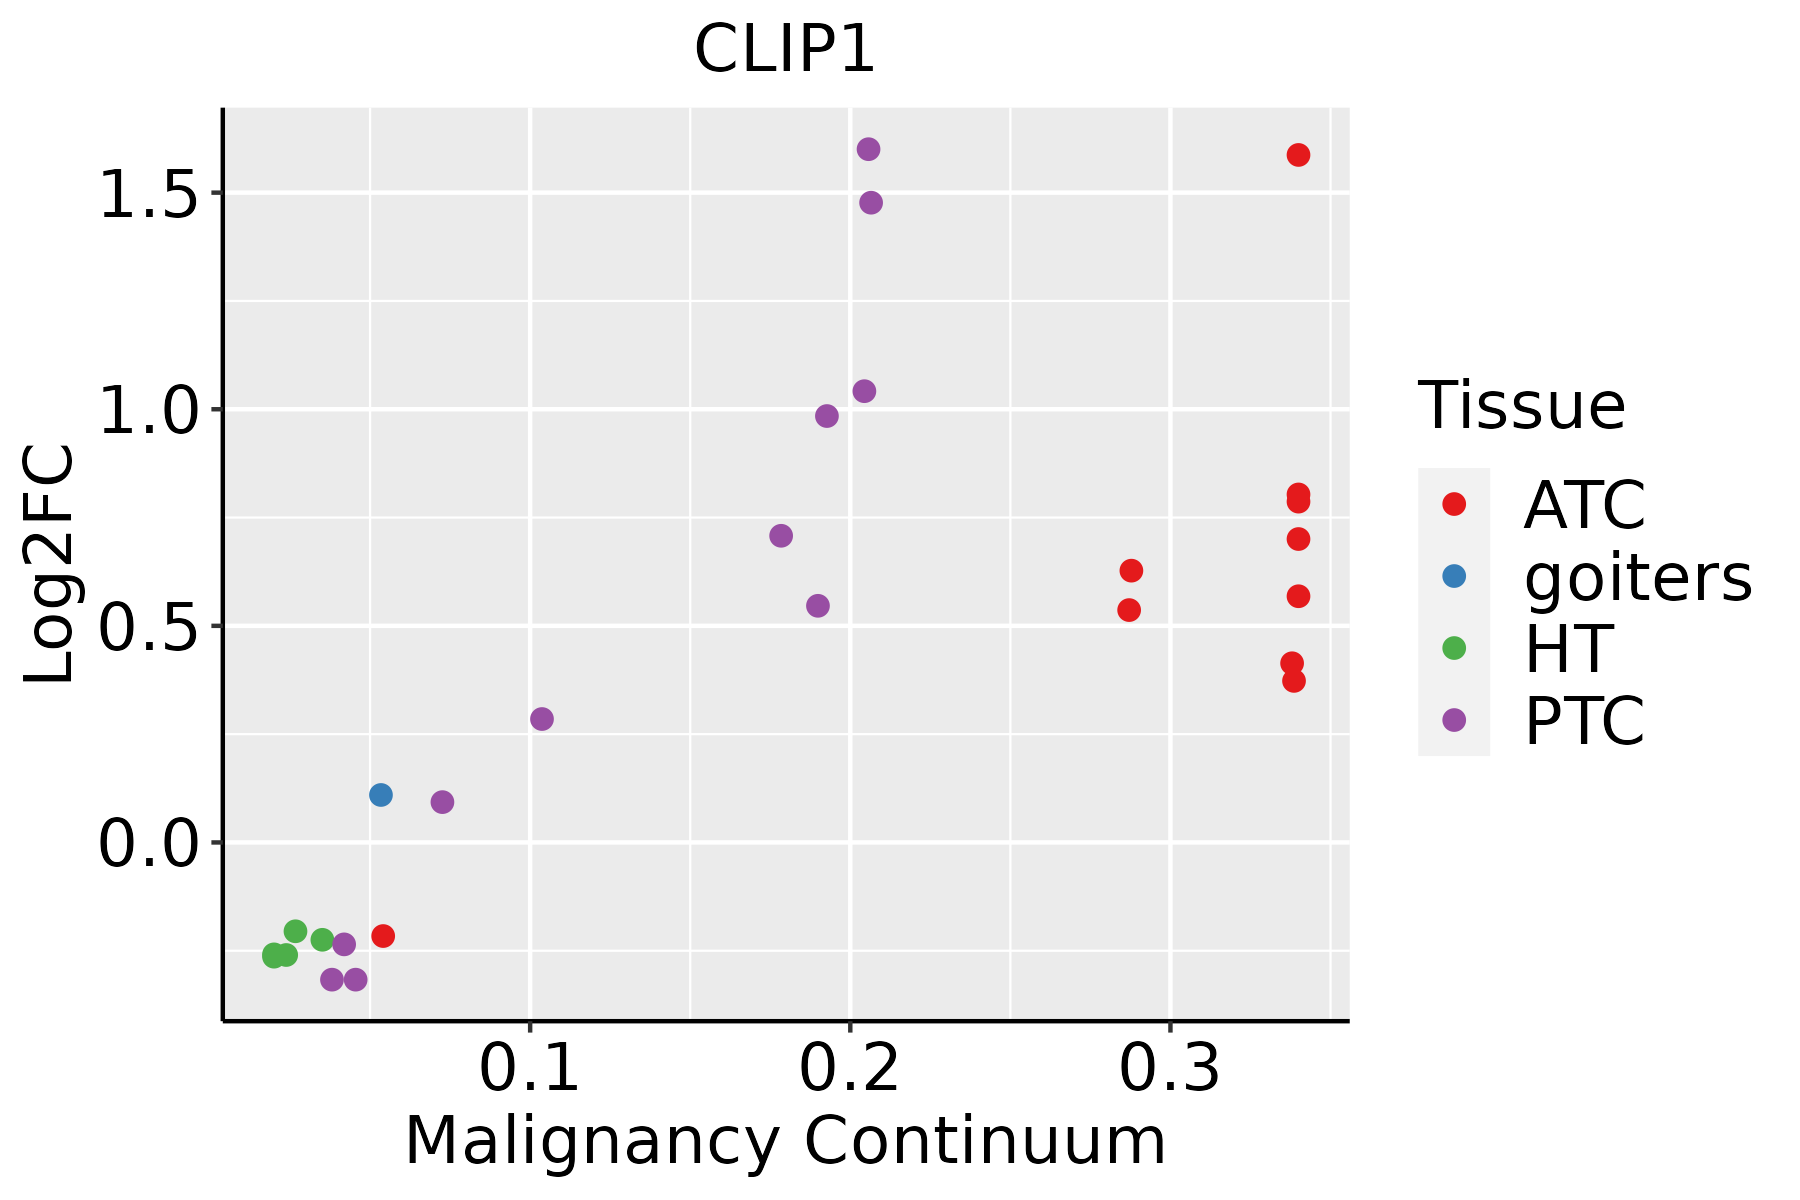 | ATC: Anaplastic thyroid cancer |
| HT: Hashimoto's thyroiditis | ||
| PTC: Papillary thyroid cancer |
| ∗log2FC in expression of this searched gene in stem-like cells from each diseased tissue sample relative to stem-like cells in normal samples in each tissue plotted against the malignancy continuum. Samples are colored based on if they are from different disease stage. |
Top |
Malignant transformation related pathway analysis |
| Find out the enriched GO biological processes and KEGG pathways involved in transition from healthy to precancer to cancer |
| Tissue | Disease Stage | Enriched GO biological Processes |
| Colorectum | AD |  |
| Colorectum | SER |  |
| Colorectum | MSS |  |
| Colorectum | MSI-H |  |
| Colorectum | FAP |  |
| ∗Top 15 enriched GO BP terms are showed in the bar plot of each disease state in each tissue. Each row represents a significant GO biological process which is colored according to the -log10(p.adjust). |
| Page: 1 2 3 4 5 6 7 8 9 |
| GO ID | Tissue | Disease Stage | Description | Gene Ratio | Bg Ratio | pvalue | p.adjust | Count |
| GO:190290514 | Breast | IDC | positive regulation of supramolecular fiber organization | 37/1434 | 209/18723 | 1.33e-06 | 5.75e-05 | 37 |
| GO:004325414 | Breast | IDC | regulation of protein-containing complex assembly | 61/1434 | 428/18723 | 1.77e-06 | 7.31e-05 | 61 |
| GO:003133414 | Breast | IDC | positive regulation of protein-containing complex assembly | 40/1434 | 237/18723 | 1.77e-06 | 7.31e-05 | 40 |
| GO:190290314 | Breast | IDC | regulation of supramolecular fiber organization | 54/1434 | 383/18723 | 9.40e-06 | 2.66e-04 | 54 |
| GO:003227314 | Breast | IDC | positive regulation of protein polymerization | 25/1434 | 138/18723 | 4.46e-05 | 1.01e-03 | 25 |
| GO:005149513 | Breast | IDC | positive regulation of cytoskeleton organization | 35/1434 | 226/18723 | 5.04e-05 | 1.09e-03 | 35 |
| GO:00322719 | Breast | IDC | regulation of protein polymerization | 32/1434 | 233/18723 | 9.19e-04 | 1.05e-02 | 32 |
| GO:00512589 | Breast | IDC | protein polymerization | 38/1434 | 297/18723 | 1.26e-03 | 1.34e-02 | 38 |
| GO:00311164 | Breast | IDC | positive regulation of microtubule polymerization | 8/1434 | 33/18723 | 2.85e-03 | 2.49e-02 | 8 |
| GO:00311124 | Breast | IDC | positive regulation of microtubule polymerization or depolymerization | 8/1434 | 37/18723 | 6.04e-03 | 4.33e-02 | 8 |
| GO:190290524 | Breast | DCIS | positive regulation of supramolecular fiber organization | 37/1390 | 209/18723 | 6.31e-07 | 2.71e-05 | 37 |
| GO:004325424 | Breast | DCIS | regulation of protein-containing complex assembly | 61/1390 | 428/18723 | 6.32e-07 | 2.71e-05 | 61 |
| GO:003133423 | Breast | DCIS | positive regulation of protein-containing complex assembly | 40/1390 | 237/18723 | 8.13e-07 | 3.36e-05 | 40 |
| GO:190290324 | Breast | DCIS | regulation of supramolecular fiber organization | 54/1390 | 383/18723 | 3.82e-06 | 1.16e-04 | 54 |
| GO:005149523 | Breast | DCIS | positive regulation of cytoskeleton organization | 35/1390 | 226/18723 | 2.66e-05 | 6.04e-04 | 35 |
| GO:003227324 | Breast | DCIS | positive regulation of protein polymerization | 25/1390 | 138/18723 | 2.67e-05 | 6.04e-04 | 25 |
| GO:005125814 | Breast | DCIS | protein polymerization | 39/1390 | 297/18723 | 3.64e-04 | 5.15e-03 | 39 |
| GO:003227114 | Breast | DCIS | regulation of protein polymerization | 32/1390 | 233/18723 | 5.44e-04 | 6.98e-03 | 32 |
| GO:003111612 | Breast | DCIS | positive regulation of microtubule polymerization | 8/1390 | 33/18723 | 2.35e-03 | 2.13e-02 | 8 |
| GO:003111212 | Breast | DCIS | positive regulation of microtubule polymerization or depolymerization | 8/1390 | 37/18723 | 5.01e-03 | 3.72e-02 | 8 |
| Page: 1 2 3 4 5 6 7 8 9 10 11 12 13 14 15 |
| Pathway ID | Tissue | Disease Stage | Description | Gene Ratio | Bg Ratio | pvalue | p.adjust | qvalue | Count |
| hsa041505 | Esophagus | ESCC | mTOR signaling pathway | 98/4205 | 156/8465 | 5.81e-04 | 1.95e-03 | 9.97e-04 | 98 |
| hsa0415013 | Esophagus | ESCC | mTOR signaling pathway | 98/4205 | 156/8465 | 5.81e-04 | 1.95e-03 | 9.97e-04 | 98 |
| hsa041502 | Liver | HCC | mTOR signaling pathway | 95/4020 | 156/8465 | 4.70e-04 | 1.99e-03 | 1.11e-03 | 95 |
| hsa0415011 | Liver | HCC | mTOR signaling pathway | 95/4020 | 156/8465 | 4.70e-04 | 1.99e-03 | 1.11e-03 | 95 |
| hsa041504 | Oral cavity | OSCC | mTOR signaling pathway | 90/3704 | 156/8465 | 2.87e-04 | 9.15e-04 | 4.66e-04 | 90 |
| hsa0415012 | Oral cavity | OSCC | mTOR signaling pathway | 90/3704 | 156/8465 | 2.87e-04 | 9.15e-04 | 4.66e-04 | 90 |
| hsa0415021 | Oral cavity | EOLP | mTOR signaling pathway | 34/1218 | 156/8465 | 7.59e-03 | 2.17e-02 | 1.28e-02 | 34 |
| hsa041503 | Oral cavity | EOLP | mTOR signaling pathway | 34/1218 | 156/8465 | 7.59e-03 | 2.17e-02 | 1.28e-02 | 34 |
| Page: 1 |
Top |
Cell-cell communication analysis |
| Identification of potential cell-cell interactions between two cell types and their ligand-receptor pairs for different disease states |
| Ligand | Receptor | LRpair | Pathway | Tissue | Disease Stage |
| Page: 1 |
Top |
Single-cell gene regulatory network inference analysis |
| Find out the significant the regulons (TFs) and the target genes of each regulon across cell types for different disease states |
| TF | Cell Type | Tissue | Disease Stage | Target Gene | RSS | Regulon Activity |
| ∗The dot plots of a searched regulon are shown for all cell subpopulations in each disease state of each tissue based on the regulon specific score inferred using pySCENIC and by calculating the average expression. |
| Page: 1 |
Top |
Somatic mutation of malignant transformation related genes |
| Annotation of somatic variants for genes involved in malignant transformation |
| Hugo Symbol | Variant Class | Variant Classification | dbSNP RS | HGVSc | HGVSp | HGVSp Short | SWISSPROT | BIOTYPE | SIFT | PolyPhen | Tumor Sample Barcode | Tissue | Histology | Sex | Age | Stage | Therapy Types | Drugs | Outcome |
| CLIP1 | SNV | Missense_Mutation | c.1653N>C | p.Glu551Asp | p.E551D | P30622 | protein_coding | deleterious(0) | possibly_damaging(0.867) | TCGA-A2-A0YI-01 | Breast | breast invasive carcinoma | Female | <65 | I/II | Unspecific | Femara | SD | |
| CLIP1 | SNV | Missense_Mutation | c.691N>T | p.Leu231Phe | p.L231F | P30622 | protein_coding | deleterious(0) | possibly_damaging(0.815) | TCGA-A8-A079-01 | Breast | breast invasive carcinoma | Female | >=65 | III/IV | Chemotherapy | 5-fluorouracil | SD | |
| CLIP1 | SNV | Missense_Mutation | c.4171N>C | p.Glu1391Gln | p.E1391Q | P30622 | protein_coding | deleterious(0) | probably_damaging(0.998) | TCGA-AC-A23H-01 | Breast | breast invasive carcinoma | Female | >=65 | I/II | Unknown | Unknown | PD | |
| CLIP1 | SNV | Missense_Mutation | c.3763N>A | p.Glu1255Lys | p.E1255K | P30622 | protein_coding | deleterious(0.02) | probably_damaging(0.997) | TCGA-AC-A23H-01 | Breast | breast invasive carcinoma | Female | >=65 | I/II | Unknown | Unknown | PD | |
| CLIP1 | SNV | Missense_Mutation | novel | c.3766G>A | p.Val1256Ile | p.V1256I | P30622 | protein_coding | tolerated(0.62) | benign(0.037) | TCGA-AC-A6IX-01 | Breast | breast invasive carcinoma | Female | <65 | III/IV | Unknown | Unknown | SD |
| CLIP1 | SNV | Missense_Mutation | c.4091N>A | p.Ser1364Asn | p.S1364N | P30622 | protein_coding | tolerated(0.05) | benign(0.304) | TCGA-BH-A0HF-01 | Breast | breast invasive carcinoma | Female | >=65 | I/II | Hormone Therapy | arimidex | SD | |
| CLIP1 | SNV | Missense_Mutation | c.2183T>C | p.Met728Thr | p.M728T | P30622 | protein_coding | deleterious(0) | possibly_damaging(0.597) | TCGA-BH-A18N-01 | Breast | breast invasive carcinoma | Female | >=65 | I/II | Unknown | Unknown | SD | |
| CLIP1 | SNV | Missense_Mutation | c.599C>T | p.Ser200Leu | p.S200L | P30622 | protein_coding | deleterious(0) | possibly_damaging(0.879) | TCGA-C8-A26Y-01 | Breast | breast invasive carcinoma | Female | >=65 | I/II | Unknown | Unknown | SD | |
| CLIP1 | insertion | Frame_Shift_Ins | novel | c.197_198insAAACACCAGTGAGTGGTTGAAATACACACACATCAGGGCTGGGCGCG | p.Gly68ThrfsTer41 | p.G68Tfs*41 | P30622 | protein_coding | TCGA-A8-A08H-01 | Breast | breast invasive carcinoma | Female | >=65 | I/II | Unknown | Unknown | SD | ||
| CLIP1 | insertion | In_Frame_Ins | novel | c.3608_3609insCGT | p.Arg1203delinsSerVal | p.R1203delinsSV | P30622 | protein_coding | TCGA-AO-A03T-01 | Breast | breast invasive carcinoma | Female | <65 | I/II | Chemotherapy | cyclophosphamide | SD |
| Page: 1 2 3 4 5 6 7 8 9 10 11 12 13 |
Top |
Related drugs of malignant transformation related genes |
| Identification of chemicals and drugs interact with genes involved in malignant transfromation |
| (DGIdb 4.0) |
| Entrez ID | Symbol | Category | Interaction Types | Drug Claim Name | Drug Name | PMIDs |
| Page: 1 |

Copyright 2023-Present -The University of Texas Health Science Center at Houston |