
|
|||||
|
 | |
| |
| |
| |
| |
| |
|
Gene: CIAO2A |
Gene summary for CIAO2A |
| Gene information | Species | Human | Gene symbol | CIAO2A | Gene ID | 84191 |
| Gene name | cytosolic iron-sulfur assembly component 2A | |
| Gene Alias | CIA2A | |
| Cytomap | 15q22.31 | |
| Gene Type | protein-coding | GO ID | GO:0006790 | UniProtAcc | Q9H5X1 |
Top |
Malignant transformation analysis |
| Identification of the aberrant gene expression in precancerous and cancerous lesions by comparing the gene expression of stem-like cells in diseased tissues with normal stem cells |
| Entrez ID | Symbol | Replicates | Species | Organ | Tissue | Adj P-value | Log2FC | Malignancy |
| 84191 | CIAO2A | Pat22-B | Human | Stomach | GC | 1.79e-24 | 4.48e-01 | -0.1042 |
| 84191 | CIAO2A | Pat24-B | Human | Stomach | GC | 1.74e-12 | 3.41e-01 | -0.1184 |
| 84191 | CIAO2A | Pat25-A | Human | Stomach | CAG with IM | 7.57e-28 | 3.91e-01 | -0.1648 |
| 84191 | CIAO2A | Pat26-A | Human | Stomach | CSG | 2.65e-26 | 4.34e-01 | -0.2402 |
| 84191 | CIAO2A | Pat28-A | Human | Stomach | CSG | 7.75e-19 | 4.21e-01 | -0.2594 |
| 84191 | CIAO2A | Pat29-A | Human | Stomach | CAG with IM | 9.21e-09 | 3.19e-01 | -0.2769 |
| Page: 1 2 3 4 |
| Tissue | Expression Dynamics | Abbreviation |
| Colorectum (GSE201348) |  | FAP: Familial adenomatous polyposis |
| CRC: Colorectal cancer | ||
| Colorectum (HTA11) |  | AD: Adenomas |
| SER: Sessile serrated lesions | ||
| MSI-H: Microsatellite-high colorectal cancer | ||
| MSS: Microsatellite stable colorectal cancer | ||
| Esophagus |  | ESCC: Esophageal squamous cell carcinoma |
| HGIN: High-grade intraepithelial neoplasias | ||
| LGIN: Low-grade intraepithelial neoplasias | ||
| GC | 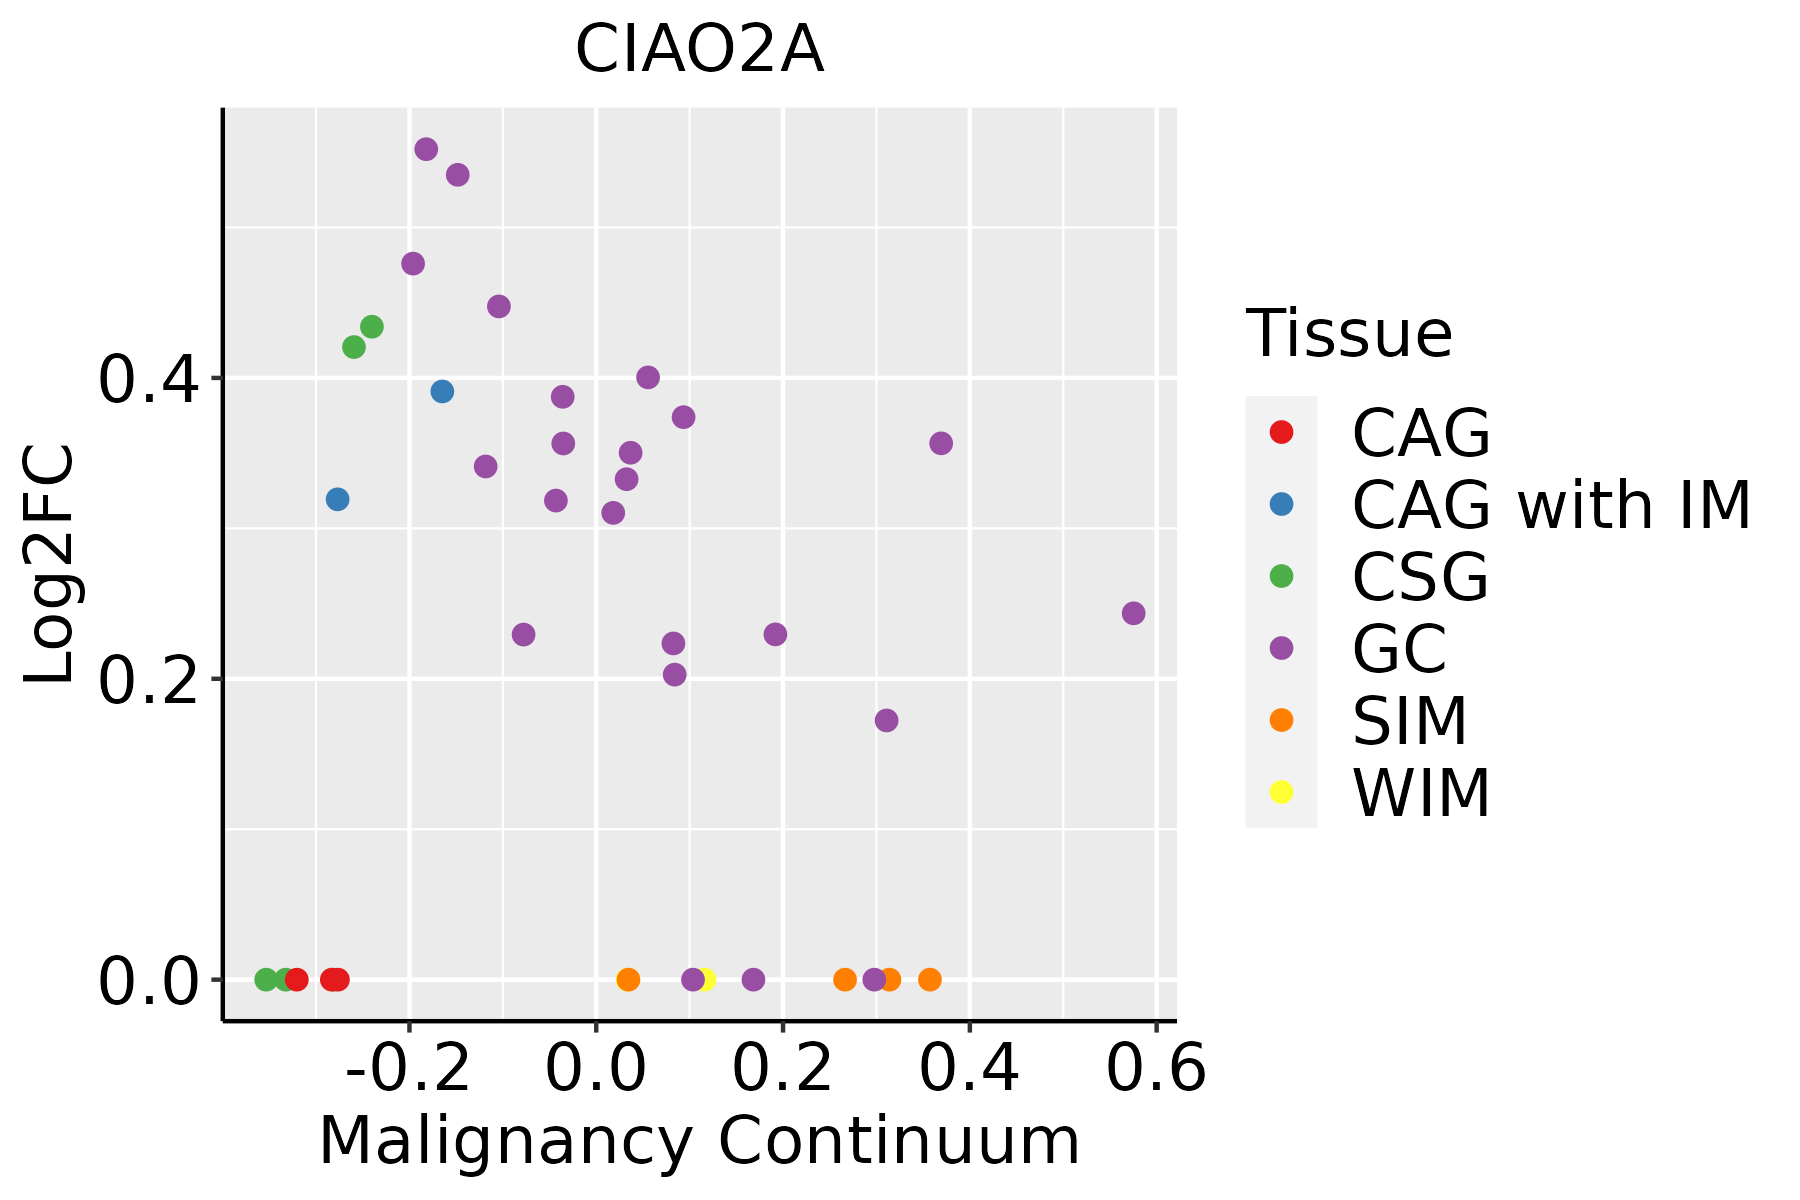 | CAG: Chronic atrophic gastritis |
| CAG with IM: Chronic atrophic gastritis with intestinal metaplasia | ||
| CSG: Chronic superficial gastritis | ||
| GC: Gastric cancer | ||
| SIM: Severe intestinal metaplasia | ||
| WIM: Wild intestinal metaplasia |
| ∗log2FC in expression of this searched gene in stem-like cells from each diseased tissue sample relative to stem-like cells in normal samples in each tissue plotted against the malignancy continuum. Samples are colored based on if they are from different disease stage. |
Top |
Malignant transformation related pathway analysis |
| Find out the enriched GO biological processes and KEGG pathways involved in transition from healthy to precancer to cancer |
| Tissue | Disease Stage | Enriched GO biological Processes |
| Colorectum | AD |  |
| Colorectum | SER |  |
| Colorectum | MSS |  |
| Colorectum | MSI-H |  |
| Colorectum | FAP |  |
| ∗Top 15 enriched GO BP terms are showed in the bar plot of each disease state in each tissue. Each row represents a significant GO biological process which is colored according to the -log10(p.adjust). |
| Page: 1 2 3 4 5 6 7 8 9 |
| GO ID | Tissue | Disease Stage | Description | Gene Ratio | Bg Ratio | pvalue | p.adjust | Count |
| GO:0006790 | Colorectum | AD | sulfur compound metabolic process | 101/3918 | 339/18723 | 6.46e-05 | 1.07e-03 | 101 |
| GO:0051604 | Colorectum | AD | protein maturation | 85/3918 | 294/18723 | 6.73e-04 | 6.91e-03 | 85 |
| GO:00516041 | Colorectum | SER | protein maturation | 73/2897 | 294/18723 | 1.82e-05 | 5.38e-04 | 73 |
| GO:00067901 | Colorectum | SER | sulfur compound metabolic process | 73/2897 | 339/18723 | 1.75e-03 | 1.81e-02 | 73 |
| GO:005160417 | Esophagus | HGIN | protein maturation | 68/2587 | 294/18723 | 9.77e-06 | 2.86e-04 | 68 |
| GO:00070593 | Esophagus | HGIN | chromosome segregation | 71/2587 | 346/18723 | 3.47e-04 | 5.62e-03 | 71 |
| GO:00974282 | Esophagus | HGIN | protein maturation by iron-sulfur cluster transfer | 8/2587 | 16/18723 | 6.00e-04 | 8.41e-03 | 8 |
| GO:00162263 | Esophagus | HGIN | iron-sulfur cluster assembly | 10/2587 | 26/18723 | 1.60e-03 | 1.79e-02 | 10 |
| GO:00311633 | Esophagus | HGIN | metallo-sulfur cluster assembly | 10/2587 | 26/18723 | 1.60e-03 | 1.79e-02 | 10 |
| GO:000705911 | Esophagus | ESCC | chromosome segregation | 238/8552 | 346/18723 | 1.72e-18 | 1.82e-16 | 238 |
| GO:005160418 | Esophagus | ESCC | protein maturation | 189/8552 | 294/18723 | 7.64e-11 | 2.39e-09 | 189 |
| GO:00067906 | Esophagus | ESCC | sulfur compound metabolic process | 201/8552 | 339/18723 | 2.64e-07 | 3.94e-06 | 201 |
| GO:001622611 | Esophagus | ESCC | iron-sulfur cluster assembly | 21/8552 | 26/18723 | 2.69e-04 | 1.63e-03 | 21 |
| GO:003116311 | Esophagus | ESCC | metallo-sulfur cluster assembly | 21/8552 | 26/18723 | 2.69e-04 | 1.63e-03 | 21 |
| GO:009742811 | Esophagus | ESCC | protein maturation by iron-sulfur cluster transfer | 14/8552 | 16/18723 | 6.78e-04 | 3.56e-03 | 14 |
| GO:00516045 | Stomach | GC | protein maturation | 34/1159 | 294/18723 | 3.35e-04 | 5.33e-03 | 34 |
| GO:00067903 | Stomach | GC | sulfur compound metabolic process | 35/1159 | 339/18723 | 2.10e-03 | 2.10e-02 | 35 |
| GO:005160411 | Stomach | CAG with IM | protein maturation | 31/1050 | 294/18723 | 5.57e-04 | 8.22e-03 | 31 |
| GO:005160421 | Stomach | CSG | protein maturation | 30/1034 | 294/18723 | 9.05e-04 | 1.20e-02 | 30 |
| Page: 1 |
| Pathway ID | Tissue | Disease Stage | Description | Gene Ratio | Bg Ratio | pvalue | p.adjust | qvalue | Count |
| Page: 1 |
Top |
Cell-cell communication analysis |
| Identification of potential cell-cell interactions between two cell types and their ligand-receptor pairs for different disease states |
| Ligand | Receptor | LRpair | Pathway | Tissue | Disease Stage |
| Page: 1 |
Top |
Single-cell gene regulatory network inference analysis |
| Find out the significant the regulons (TFs) and the target genes of each regulon across cell types for different disease states |
| TF | Cell Type | Tissue | Disease Stage | Target Gene | RSS | Regulon Activity |
| ∗The dot plots of a searched regulon are shown for all cell subpopulations in each disease state of each tissue based on the regulon specific score inferred using pySCENIC and by calculating the average expression. |
| Page: 1 |
Top |
Somatic mutation of malignant transformation related genes |
| Annotation of somatic variants for genes involved in malignant transformation |
| Hugo Symbol | Variant Class | Variant Classification | dbSNP RS | HGVSc | HGVSp | HGVSp Short | SWISSPROT | BIOTYPE | SIFT | PolyPhen | Tumor Sample Barcode | Tissue | Histology | Sex | Age | Stage | Therapy Types | Drugs | Outcome |
| Page: 1 |
Top |
Related drugs of malignant transformation related genes |
| Identification of chemicals and drugs interact with genes involved in malignant transfromation |
| (DGIdb 4.0) |
| Entrez ID | Symbol | Category | Interaction Types | Drug Claim Name | Drug Name | PMIDs |
| Page: 1 |

Copyright 2023-Present -The University of Texas Health Science Center at Houston |