
|
|||||
|
 | |
| |
| |
| |
| |
| |
|
Gene: CDC42EP1 |
Gene summary for CDC42EP1 |
| Gene information | Species | Human | Gene symbol | CDC42EP1 | Gene ID | 11135 |
| Gene name | CDC42 effector protein 1 | |
| Gene Alias | BORG5 | |
| Cytomap | 22q13.1 | |
| Gene Type | protein-coding | GO ID | GO:0000902 | UniProtAcc | Q00587 |
Top |
Malignant transformation analysis |
| Identification of the aberrant gene expression in precancerous and cancerous lesions by comparing the gene expression of stem-like cells in diseased tissues with normal stem cells |
| Entrez ID | Symbol | Replicates | Species | Organ | Tissue | Adj P-value | Log2FC | Malignancy |
| 11135 | CDC42EP1 | P16T-E | Human | Esophagus | ESCC | 1.27e-25 | 7.68e-01 | 0.1153 |
| 11135 | CDC42EP1 | P17T-E | Human | Esophagus | ESCC | 3.30e-08 | 1.09e+00 | 0.1278 |
| 11135 | CDC42EP1 | P19T-E | Human | Esophagus | ESCC | 3.00e-11 | 1.61e+00 | 0.1662 |
| 11135 | CDC42EP1 | P20T-E | Human | Esophagus | ESCC | 1.25e-24 | 1.00e+00 | 0.1124 |
| 11135 | CDC42EP1 | P21T-E | Human | Esophagus | ESCC | 1.23e-74 | 1.76e+00 | 0.1617 |
| 11135 | CDC42EP1 | P22T-E | Human | Esophagus | ESCC | 1.48e-18 | 4.48e-01 | 0.1236 |
| 11135 | CDC42EP1 | P23T-E | Human | Esophagus | ESCC | 2.02e-35 | 1.70e+00 | 0.108 |
| 11135 | CDC42EP1 | P24T-E | Human | Esophagus | ESCC | 3.50e-63 | 1.58e+00 | 0.1287 |
| 11135 | CDC42EP1 | P26T-E | Human | Esophagus | ESCC | 2.53e-40 | 9.96e-01 | 0.1276 |
| 11135 | CDC42EP1 | P27T-E | Human | Esophagus | ESCC | 3.07e-17 | 7.20e-01 | 0.1055 |
| 11135 | CDC42EP1 | P28T-E | Human | Esophagus | ESCC | 7.27e-21 | 8.05e-01 | 0.1149 |
| 11135 | CDC42EP1 | P30T-E | Human | Esophagus | ESCC | 8.13e-17 | 1.07e+00 | 0.137 |
| 11135 | CDC42EP1 | P31T-E | Human | Esophagus | ESCC | 4.72e-17 | 6.75e-01 | 0.1251 |
| 11135 | CDC42EP1 | P32T-E | Human | Esophagus | ESCC | 2.86e-19 | 8.08e-01 | 0.1666 |
| 11135 | CDC42EP1 | P36T-E | Human | Esophagus | ESCC | 1.13e-16 | 8.43e-01 | 0.1187 |
| 11135 | CDC42EP1 | P37T-E | Human | Esophagus | ESCC | 1.44e-34 | 8.64e-01 | 0.1371 |
| 11135 | CDC42EP1 | P38T-E | Human | Esophagus | ESCC | 1.41e-07 | 4.86e-01 | 0.127 |
| 11135 | CDC42EP1 | P39T-E | Human | Esophagus | ESCC | 3.25e-22 | 1.04e+00 | 0.0894 |
| 11135 | CDC42EP1 | P40T-E | Human | Esophagus | ESCC | 6.64e-26 | 1.53e+00 | 0.109 |
| 11135 | CDC42EP1 | P42T-E | Human | Esophagus | ESCC | 3.39e-35 | 1.30e+00 | 0.1175 |
| Page: 1 2 3 4 5 6 7 8 9 |
| Tissue | Expression Dynamics | Abbreviation |
| Breast |  | IDC: Invasive ductal carcinoma |
| DCIS: Ductal carcinoma in situ | ||
| Precancer(BRCA1-mut): Precancerous lesion from BRCA1 mutation carriers | ||
| Colorectum (GSE201348) |  | FAP: Familial adenomatous polyposis |
| CRC: Colorectal cancer | ||
| Colorectum (HTA11) |  | AD: Adenomas |
| SER: Sessile serrated lesions | ||
| MSI-H: Microsatellite-high colorectal cancer | ||
| MSS: Microsatellite stable colorectal cancer | ||
| Esophagus | 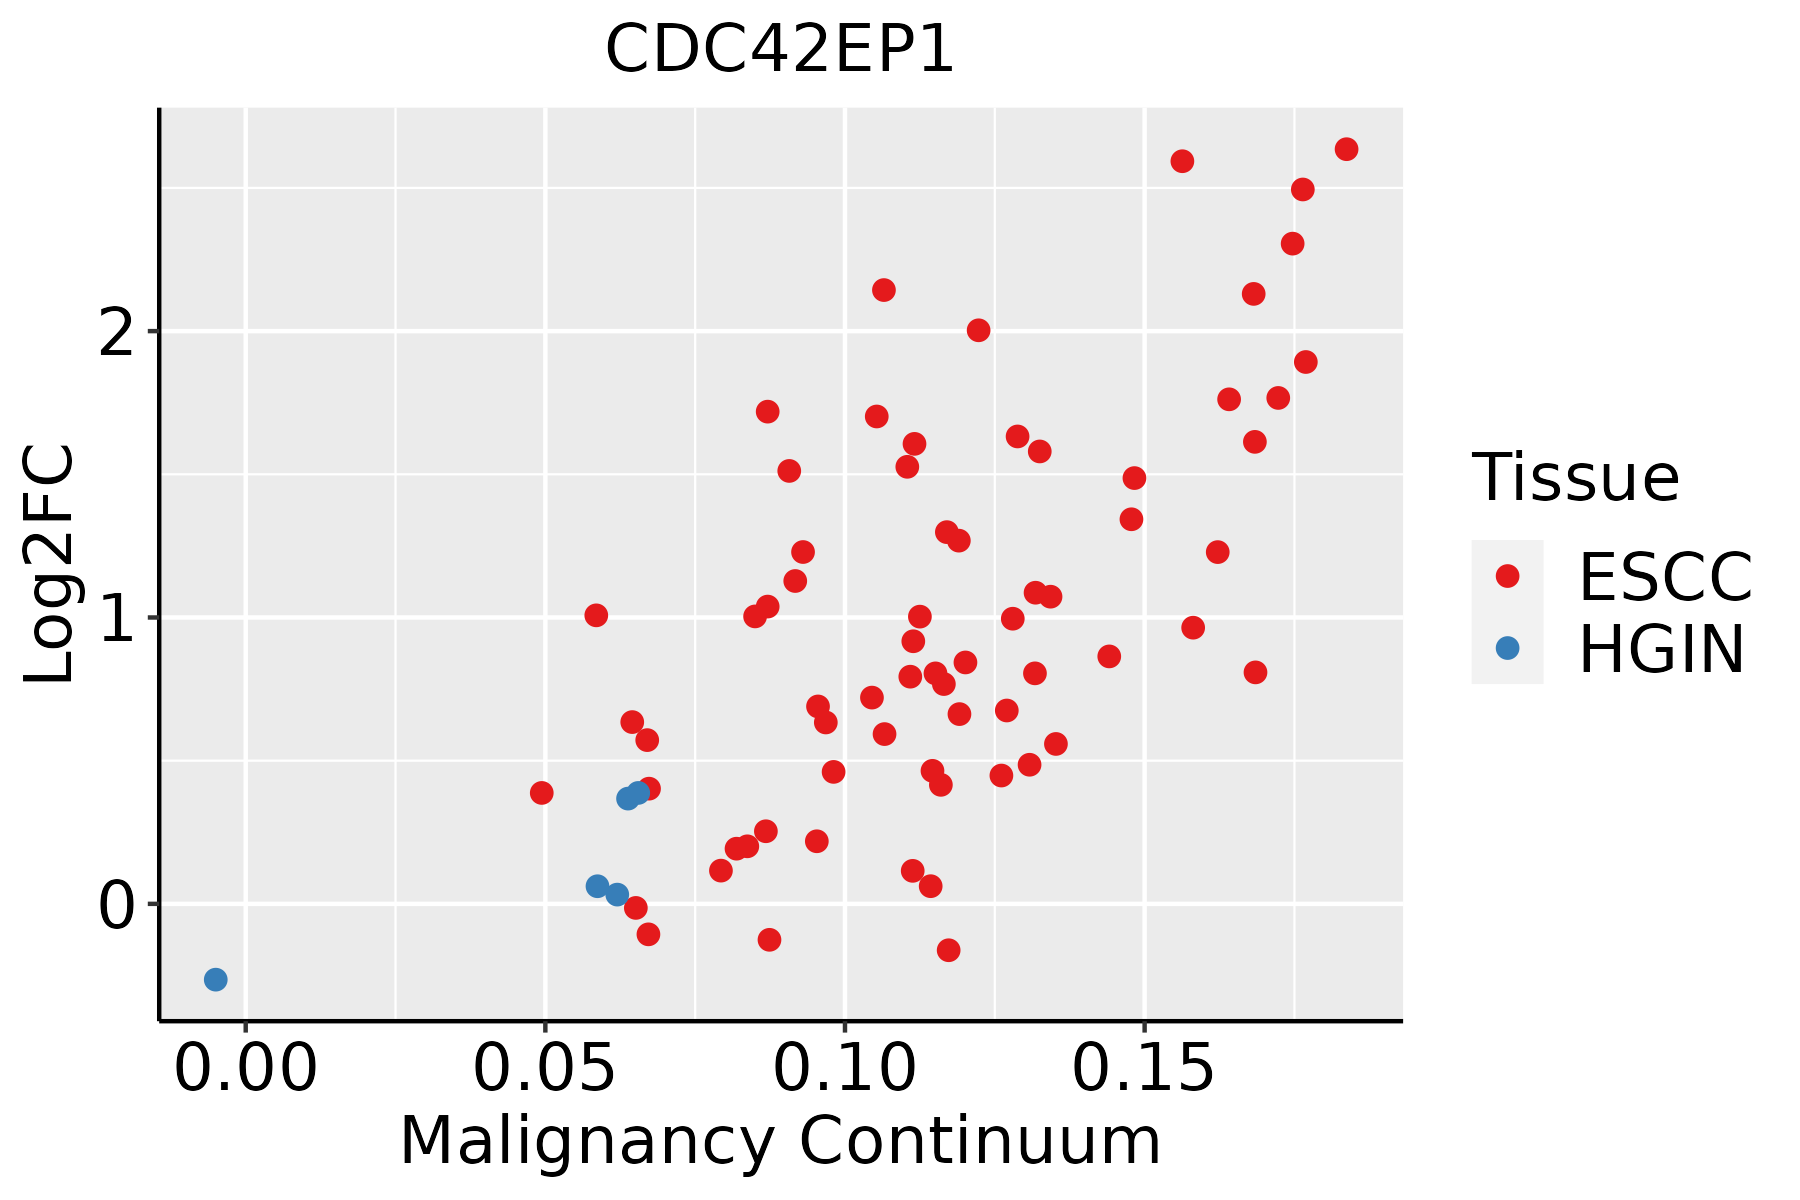 | ESCC: Esophageal squamous cell carcinoma |
| HGIN: High-grade intraepithelial neoplasias | ||
| LGIN: Low-grade intraepithelial neoplasias | ||
| Liver | 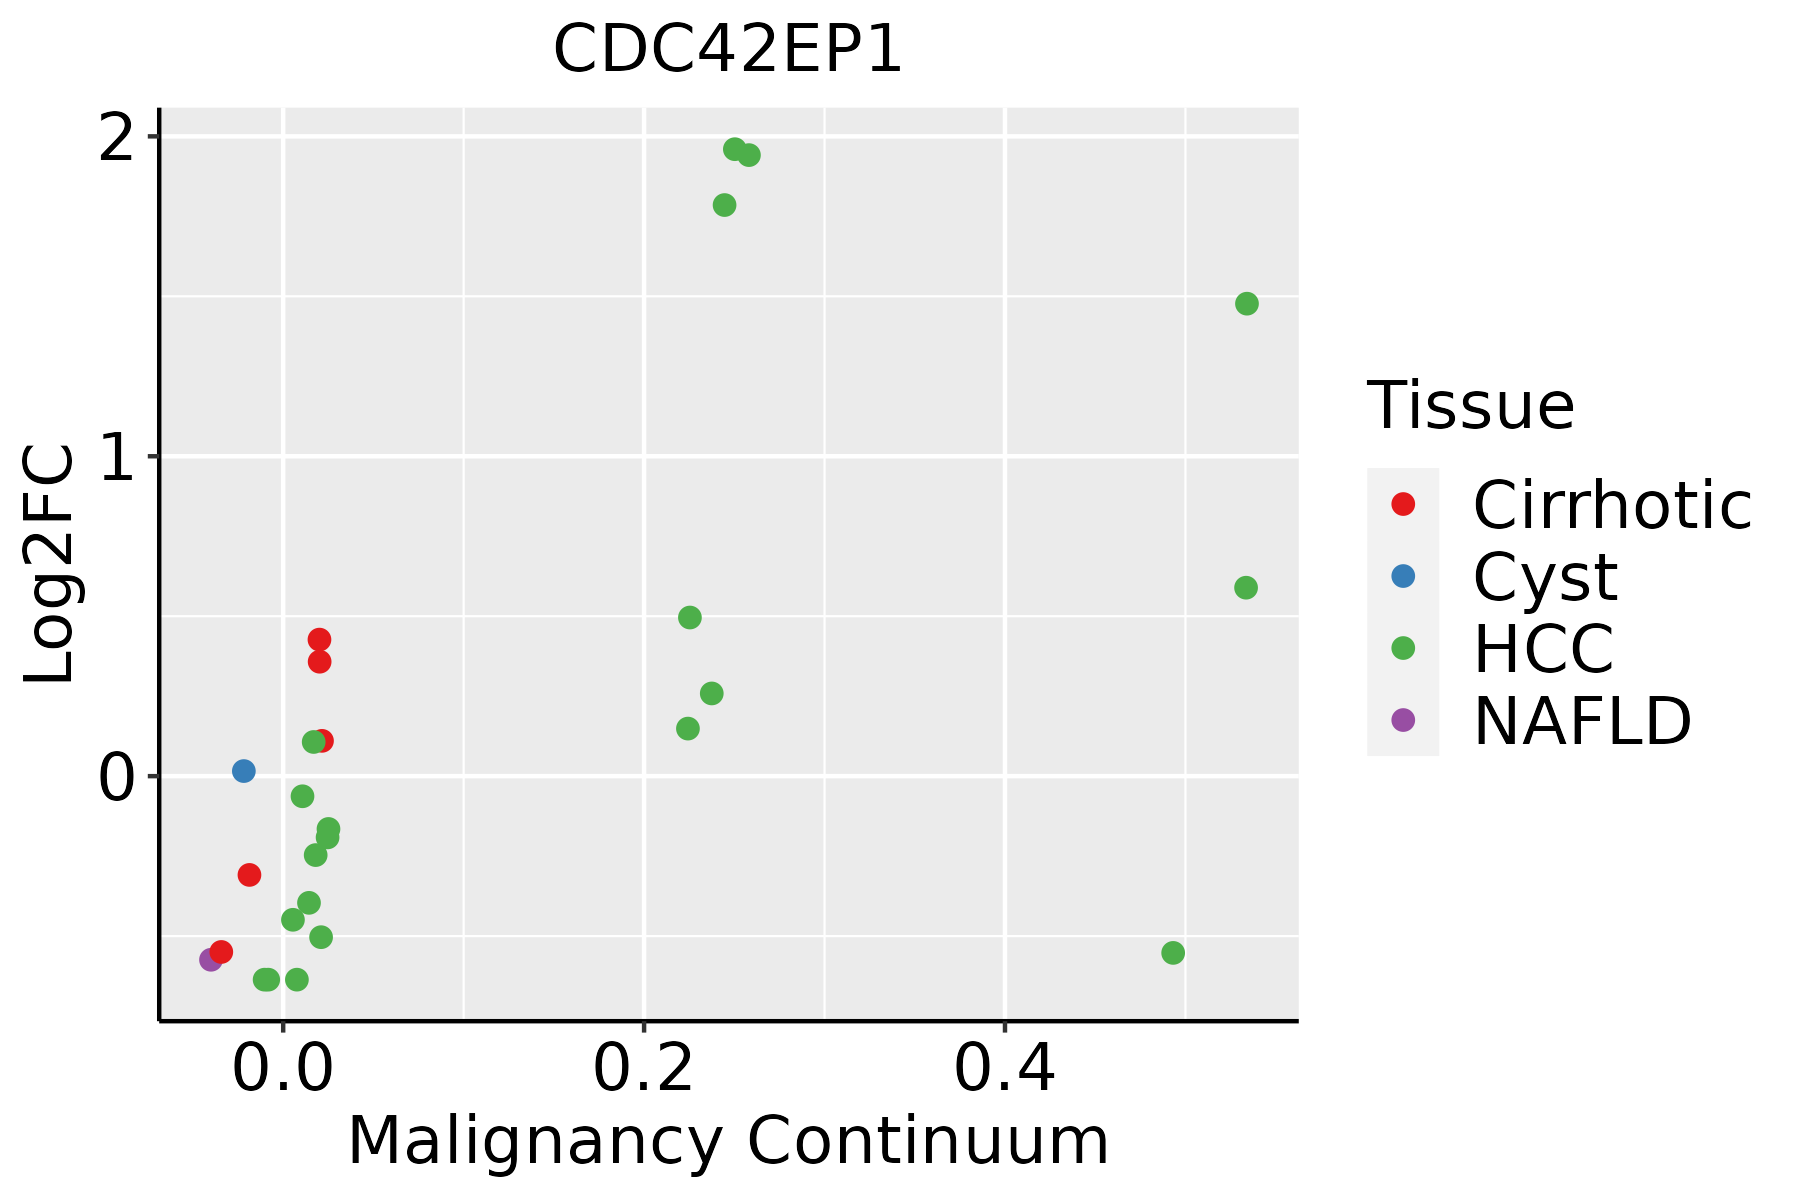 | HCC: Hepatocellular carcinoma |
| NAFLD: Non-alcoholic fatty liver disease | ||
| Oral Cavity | 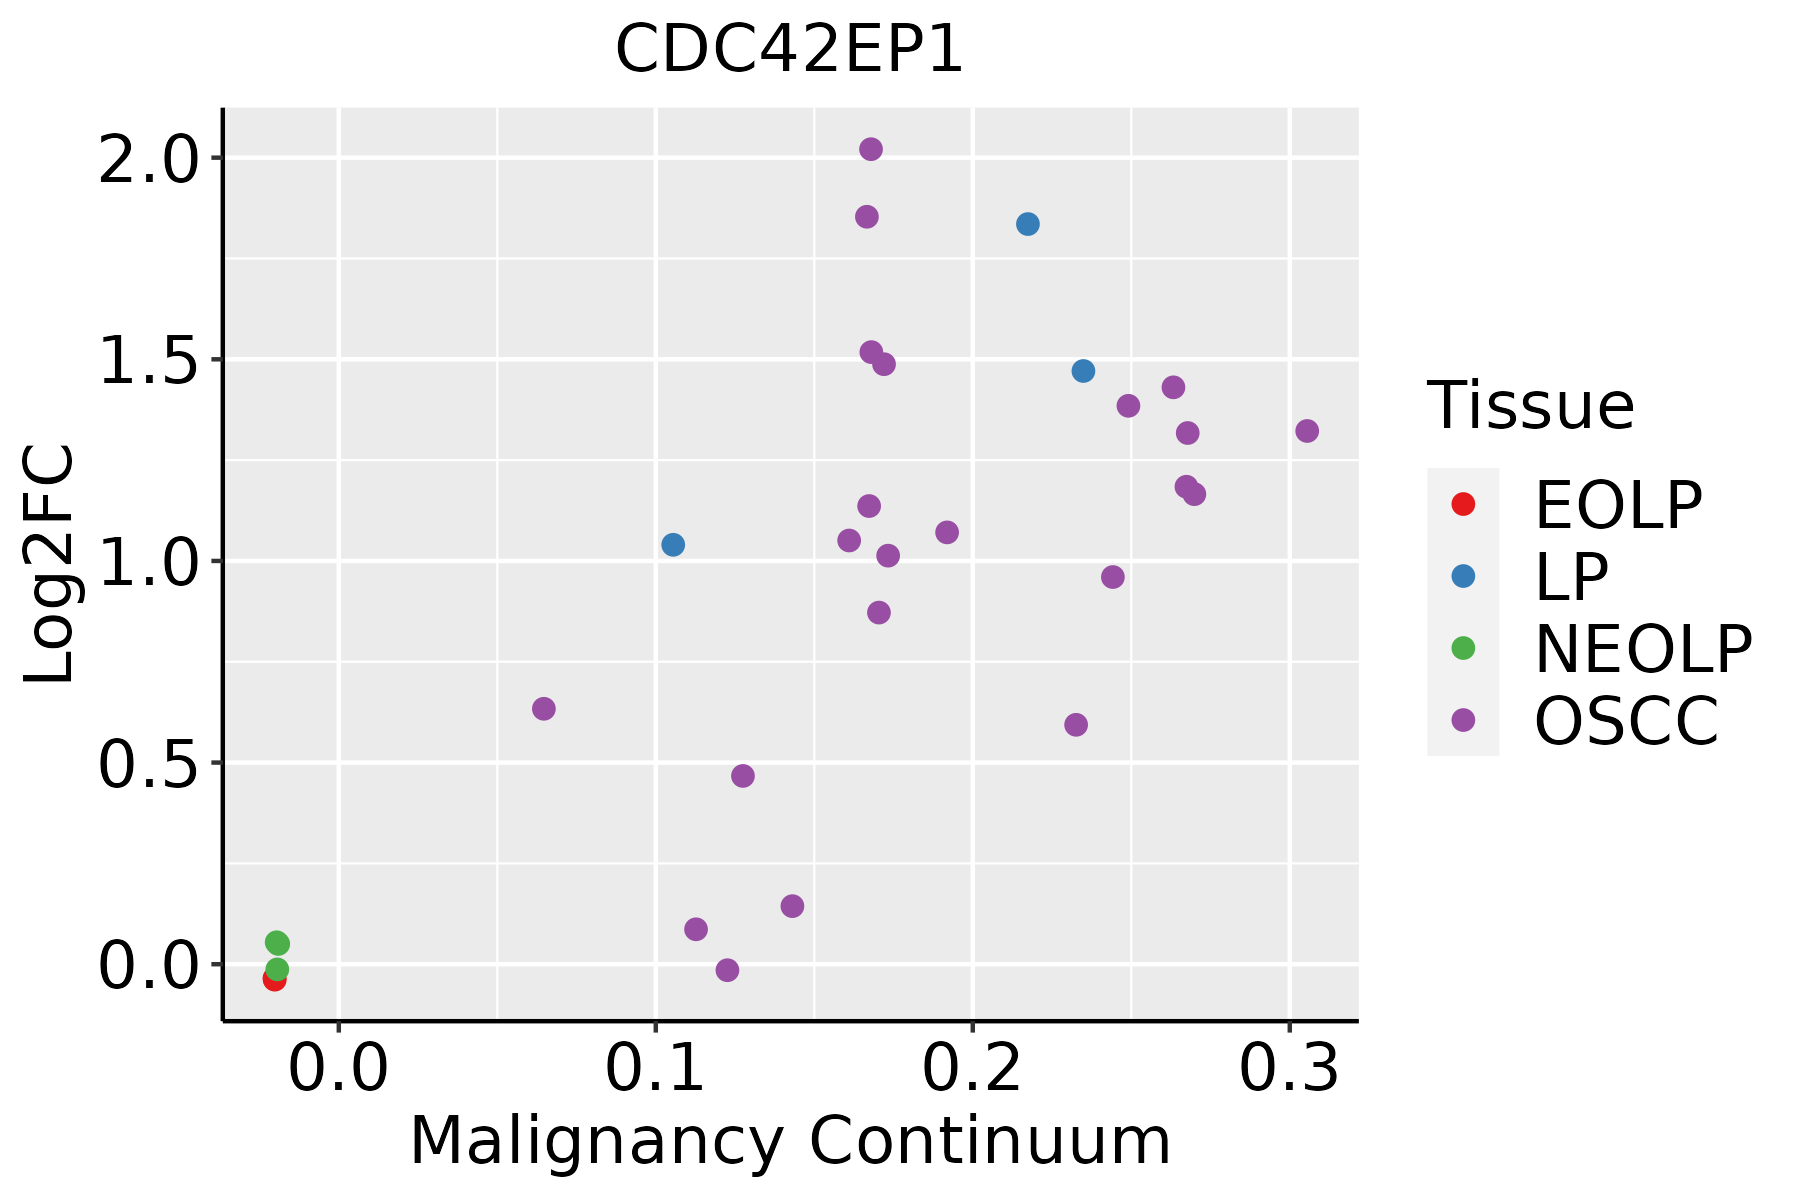 | EOLP: Erosive Oral lichen planus |
| LP: leukoplakia | ||
| NEOLP: Non-erosive oral lichen planus | ||
| OSCC: Oral squamous cell carcinoma | ||
| Skin |  | AK: Actinic keratosis |
| cSCC: Cutaneous squamous cell carcinoma | ||
| SCCIS:squamous cell carcinoma in situ | ||
| Thyroid | 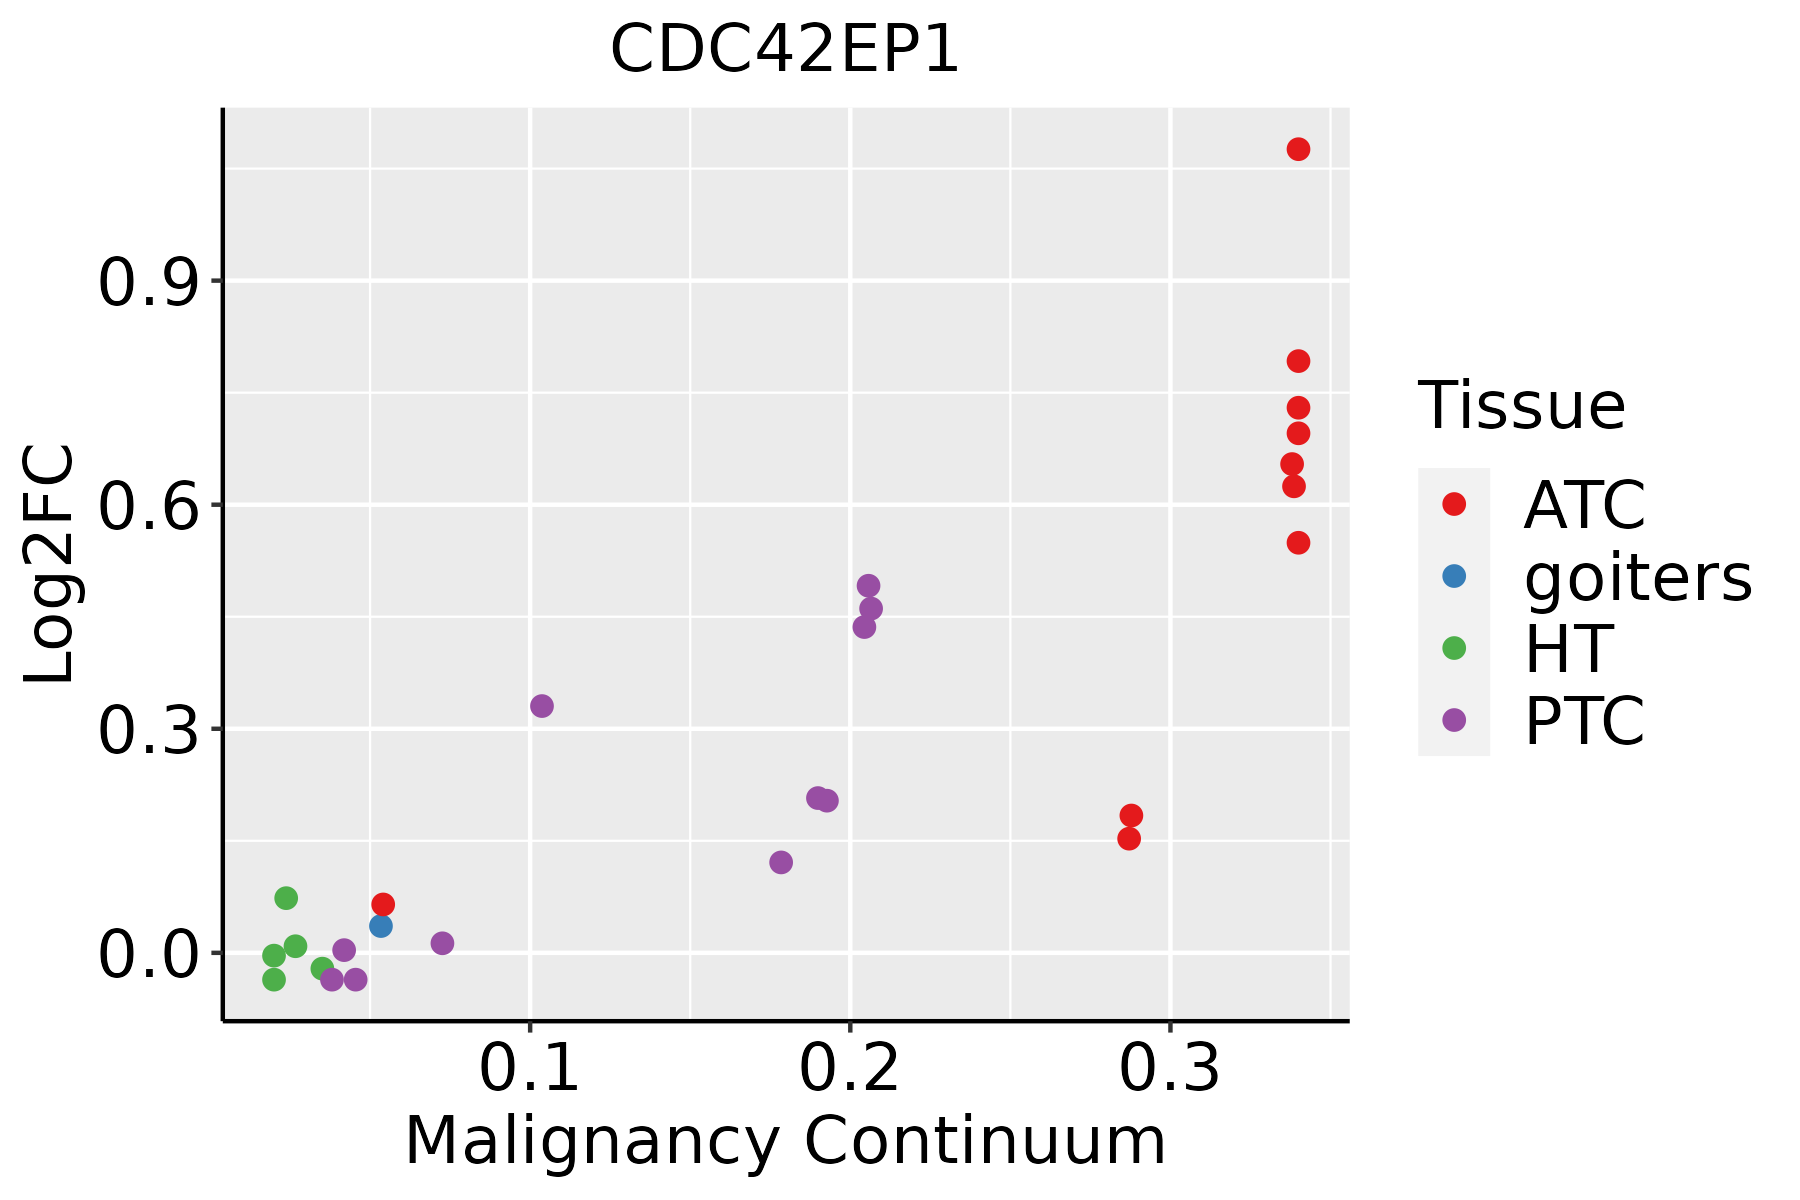 | ATC: Anaplastic thyroid cancer |
| HT: Hashimoto's thyroiditis | ||
| PTC: Papillary thyroid cancer |
| ∗log2FC in expression of this searched gene in stem-like cells from each diseased tissue sample relative to stem-like cells in normal samples in each tissue plotted against the malignancy continuum. Samples are colored based on if they are from different disease stage. |
Top |
Malignant transformation related pathway analysis |
| Find out the enriched GO biological processes and KEGG pathways involved in transition from healthy to precancer to cancer |
| Tissue | Disease Stage | Enriched GO biological Processes |
| Colorectum | AD |  |
| Colorectum | SER |  |
| Colorectum | MSS |  |
| Colorectum | MSI-H |  |
| Colorectum | FAP |  |
| ∗Top 15 enriched GO BP terms are showed in the bar plot of each disease state in each tissue. Each row represents a significant GO biological process which is colored according to the -log10(p.adjust). |
| Page: 1 2 3 4 5 6 7 8 9 |
| GO ID | Tissue | Disease Stage | Description | Gene Ratio | Bg Ratio | pvalue | p.adjust | Count |
| GO:00432549 | Breast | Precancer | regulation of protein-containing complex assembly | 50/1080 | 428/18723 | 1.63e-06 | 5.97e-05 | 50 |
| GO:00313349 | Breast | Precancer | positive regulation of protein-containing complex assembly | 33/1080 | 237/18723 | 2.39e-06 | 8.21e-05 | 33 |
| GO:19029059 | Breast | Precancer | positive regulation of supramolecular fiber organization | 28/1080 | 209/18723 | 2.79e-05 | 6.28e-04 | 28 |
| GO:19029039 | Breast | Precancer | regulation of supramolecular fiber organization | 42/1080 | 383/18723 | 4.92e-05 | 1.04e-03 | 42 |
| GO:00329709 | Breast | Precancer | regulation of actin filament-based process | 42/1080 | 397/18723 | 1.11e-04 | 2.01e-03 | 42 |
| GO:00514959 | Breast | Precancer | positive regulation of cytoskeleton organization | 28/1080 | 226/18723 | 1.13e-04 | 2.04e-03 | 28 |
| GO:00070159 | Breast | Precancer | actin filament organization | 44/1080 | 442/18723 | 3.02e-04 | 4.35e-03 | 44 |
| GO:00329569 | Breast | Precancer | regulation of actin cytoskeleton organization | 36/1080 | 358/18723 | 8.56e-04 | 9.88e-03 | 36 |
| GO:00322739 | Breast | Precancer | positive regulation of protein polymerization | 18/1080 | 138/18723 | 9.85e-04 | 1.11e-02 | 18 |
| GO:01100539 | Breast | Precancer | regulation of actin filament organization | 29/1080 | 278/18723 | 1.50e-03 | 1.55e-02 | 29 |
| GO:00226049 | Breast | Precancer | regulation of cell morphogenesis | 29/1080 | 309/18723 | 6.88e-03 | 4.67e-02 | 29 |
| GO:190290514 | Breast | IDC | positive regulation of supramolecular fiber organization | 37/1434 | 209/18723 | 1.33e-06 | 5.75e-05 | 37 |
| GO:004325414 | Breast | IDC | regulation of protein-containing complex assembly | 61/1434 | 428/18723 | 1.77e-06 | 7.31e-05 | 61 |
| GO:003133414 | Breast | IDC | positive regulation of protein-containing complex assembly | 40/1434 | 237/18723 | 1.77e-06 | 7.31e-05 | 40 |
| GO:003297014 | Breast | IDC | regulation of actin filament-based process | 56/1434 | 397/18723 | 6.37e-06 | 1.99e-04 | 56 |
| GO:190290314 | Breast | IDC | regulation of supramolecular fiber organization | 54/1434 | 383/18723 | 9.40e-06 | 2.66e-04 | 54 |
| GO:003227314 | Breast | IDC | positive regulation of protein polymerization | 25/1434 | 138/18723 | 4.46e-05 | 1.01e-03 | 25 |
| GO:005149513 | Breast | IDC | positive regulation of cytoskeleton organization | 35/1434 | 226/18723 | 5.04e-05 | 1.09e-03 | 35 |
| GO:003295614 | Breast | IDC | regulation of actin cytoskeleton organization | 48/1434 | 358/18723 | 1.03e-04 | 1.96e-03 | 48 |
| GO:000701514 | Breast | IDC | actin filament organization | 55/1434 | 442/18723 | 2.45e-04 | 3.84e-03 | 55 |
| Page: 1 2 3 4 5 6 7 8 9 10 11 12 13 14 15 16 17 18 |
| Pathway ID | Tissue | Disease Stage | Description | Gene Ratio | Bg Ratio | pvalue | p.adjust | qvalue | Count |
| Page: 1 |
Top |
Cell-cell communication analysis |
| Identification of potential cell-cell interactions between two cell types and their ligand-receptor pairs for different disease states |
| Ligand | Receptor | LRpair | Pathway | Tissue | Disease Stage |
| Page: 1 |
Top |
Single-cell gene regulatory network inference analysis |
| Find out the significant the regulons (TFs) and the target genes of each regulon across cell types for different disease states |
| TF | Cell Type | Tissue | Disease Stage | Target Gene | RSS | Regulon Activity |
| ∗The dot plots of a searched regulon are shown for all cell subpopulations in each disease state of each tissue based on the regulon specific score inferred using pySCENIC and by calculating the average expression. |
| Page: 1 |
Top |
Somatic mutation of malignant transformation related genes |
| Annotation of somatic variants for genes involved in malignant transformation |
| Hugo Symbol | Variant Class | Variant Classification | dbSNP RS | HGVSc | HGVSp | HGVSp Short | SWISSPROT | BIOTYPE | SIFT | PolyPhen | Tumor Sample Barcode | Tissue | Histology | Sex | Age | Stage | Therapy Types | Drugs | Outcome |
| CDC42EP1 | SNV | Missense_Mutation | novel | c.440N>G | p.Ser147Cys | p.S147C | Q00587 | protein_coding | tolerated(0.18) | possibly_damaging(0.628) | TCGA-AC-A5XS-01 | Breast | breast invasive carcinoma | Female | >=65 | I/II | Hormone Therapy | femara | SD |
| CDC42EP1 | SNV | Missense_Mutation | novel | c.388N>C | p.Tyr130His | p.Y130H | Q00587 | protein_coding | tolerated(0.09) | possibly_damaging(0.903) | TCGA-AO-A128-01 | Breast | breast invasive carcinoma | Female | <65 | I/II | Chemotherapy | doxorubicin | SD |
| CDC42EP1 | insertion | Frame_Shift_Ins | novel | c.558_559insCTACAGGC | p.Arg188GlnfsTer27 | p.R188Qfs*27 | Q00587 | protein_coding | TCGA-A2-A0EV-01 | Breast | breast invasive carcinoma | Female | >=65 | I/II | Unknown | Unknown | SD | ||
| CDC42EP1 | SNV | Missense_Mutation | novel | c.11N>A | p.Pro4His | p.P4H | Q00587 | protein_coding | deleterious_low_confidence(0) | possibly_damaging(0.888) | TCGA-2W-A8YY-01 | Cervix | cervical & endocervical cancer | Female | <65 | I/II | Chemotherapy | cisplatin | CR |
| CDC42EP1 | SNV | Missense_Mutation | rs368492182 | c.56N>T | p.Ser19Leu | p.S19L | Q00587 | protein_coding | deleterious(0.05) | benign(0.129) | TCGA-JW-A5VL-01 | Cervix | cervical & endocervical cancer | Female | <65 | I/II | Unknown | Unknown | SD |
| CDC42EP1 | SNV | Missense_Mutation | novel | c.311C>T | p.Ala104Val | p.A104V | Q00587 | protein_coding | tolerated(0.18) | benign(0.084) | TCGA-A6-6781-01 | Colorectum | colon adenocarcinoma | Male | <65 | III/IV | Chemotherapy | oxaliplatin | SD |
| CDC42EP1 | SNV | Missense_Mutation | c.1094N>A | p.Ser365Asn | p.S365N | Q00587 | protein_coding | deleterious_low_confidence(0.05) | benign(0.001) | TCGA-AZ-6601-01 | Colorectum | colon adenocarcinoma | Male | >=65 | I/II | Unknown | Unknown | PD | |
| CDC42EP1 | insertion | Frame_Shift_Ins | rs774440829 | c.282_283insC | p.Arg97ProfsTer78 | p.R97Pfs*78 | Q00587 | protein_coding | TCGA-A6-2686-01 | Colorectum | colon adenocarcinoma | Female | >=65 | I/II | Unknown | Unknown | SD | ||
| CDC42EP1 | insertion | Frame_Shift_Ins | rs774440829 | c.289dupC | p.Arg97ProfsTer78 | p.R97Pfs*78 | Q00587 | protein_coding | TCGA-G4-6302-01 | Colorectum | colon adenocarcinoma | Female | >=65 | I/II | Unknown | Unknown | SD | ||
| CDC42EP1 | SNV | Missense_Mutation | rs772130894 | c.790N>A | p.Ala264Thr | p.A264T | Q00587 | protein_coding | tolerated(0.71) | benign(0) | TCGA-A5-A2K5-01 | Endometrium | uterine corpus endometrioid carcinoma | Female | >=65 | I/II | Unknown | Unknown | SD |
| Page: 1 2 3 4 |
Top |
Related drugs of malignant transformation related genes |
| Identification of chemicals and drugs interact with genes involved in malignant transfromation |
| (DGIdb 4.0) |
| Entrez ID | Symbol | Category | Interaction Types | Drug Claim Name | Drug Name | PMIDs |
| Page: 1 |

Copyright 2023-Present -The University of Texas Health Science Center at Houston |