
|
|||||
|
 | |
| |
| |
| |
| |
| |
|
Gene: CASZ1 |
Gene summary for CASZ1 |
| Gene information | Species | Human | Gene symbol | CASZ1 | Gene ID | 54897 |
| Gene name | castor zinc finger 1 | |
| Gene Alias | CAS11 | |
| Cytomap | 1p36.22 | |
| Gene Type | protein-coding | GO ID | GO:0006139 | UniProtAcc | B3KRV8 |
Top |
Malignant transformation analysis |
| Identification of the aberrant gene expression in precancerous and cancerous lesions by comparing the gene expression of stem-like cells in diseased tissues with normal stem cells |
| Entrez ID | Symbol | Replicates | Species | Organ | Tissue | Adj P-value | Log2FC | Malignancy |
| 54897 | CASZ1 | P37T-E | Human | Esophagus | ESCC | 1.13e-10 | 2.30e-01 | 0.1371 |
| 54897 | CASZ1 | P39T-E | Human | Esophagus | ESCC | 1.71e-08 | 1.42e-01 | 0.0894 |
| 54897 | CASZ1 | P40T-E | Human | Esophagus | ESCC | 5.07e-11 | 3.33e-01 | 0.109 |
| 54897 | CASZ1 | P42T-E | Human | Esophagus | ESCC | 1.08e-04 | 2.29e-01 | 0.1175 |
| 54897 | CASZ1 | P47T-E | Human | Esophagus | ESCC | 1.07e-10 | 1.02e-01 | 0.1067 |
| 54897 | CASZ1 | P48T-E | Human | Esophagus | ESCC | 1.04e-20 | 3.02e-01 | 0.0959 |
| 54897 | CASZ1 | P49T-E | Human | Esophagus | ESCC | 1.72e-07 | 9.29e-01 | 0.1768 |
| 54897 | CASZ1 | P52T-E | Human | Esophagus | ESCC | 4.16e-10 | 1.44e-01 | 0.1555 |
| 54897 | CASZ1 | P54T-E | Human | Esophagus | ESCC | 5.89e-11 | 2.74e-01 | 0.0975 |
| 54897 | CASZ1 | P56T-E | Human | Esophagus | ESCC | 1.86e-03 | 6.14e-01 | 0.1613 |
| 54897 | CASZ1 | P57T-E | Human | Esophagus | ESCC | 2.35e-16 | 3.30e-01 | 0.0926 |
| 54897 | CASZ1 | P61T-E | Human | Esophagus | ESCC | 1.14e-09 | 1.15e-01 | 0.099 |
| 54897 | CASZ1 | P62T-E | Human | Esophagus | ESCC | 4.14e-18 | 3.84e-01 | 0.1302 |
| 54897 | CASZ1 | P65T-E | Human | Esophagus | ESCC | 6.50e-25 | 4.80e-01 | 0.0978 |
| 54897 | CASZ1 | P74T-E | Human | Esophagus | ESCC | 6.57e-10 | 3.69e-01 | 0.1479 |
| 54897 | CASZ1 | P75T-E | Human | Esophagus | ESCC | 1.57e-15 | 2.51e-01 | 0.1125 |
| 54897 | CASZ1 | P76T-E | Human | Esophagus | ESCC | 4.00e-08 | 1.20e-01 | 0.1207 |
| 54897 | CASZ1 | P79T-E | Human | Esophagus | ESCC | 5.85e-03 | 6.50e-02 | 0.1154 |
| 54897 | CASZ1 | P80T-E | Human | Esophagus | ESCC | 9.71e-23 | 5.35e-01 | 0.155 |
| 54897 | CASZ1 | P82T-E | Human | Esophagus | ESCC | 2.24e-06 | 4.11e-01 | 0.1072 |
| Page: 1 2 3 4 5 6 |
| Tissue | Expression Dynamics | Abbreviation |
| Cervix | 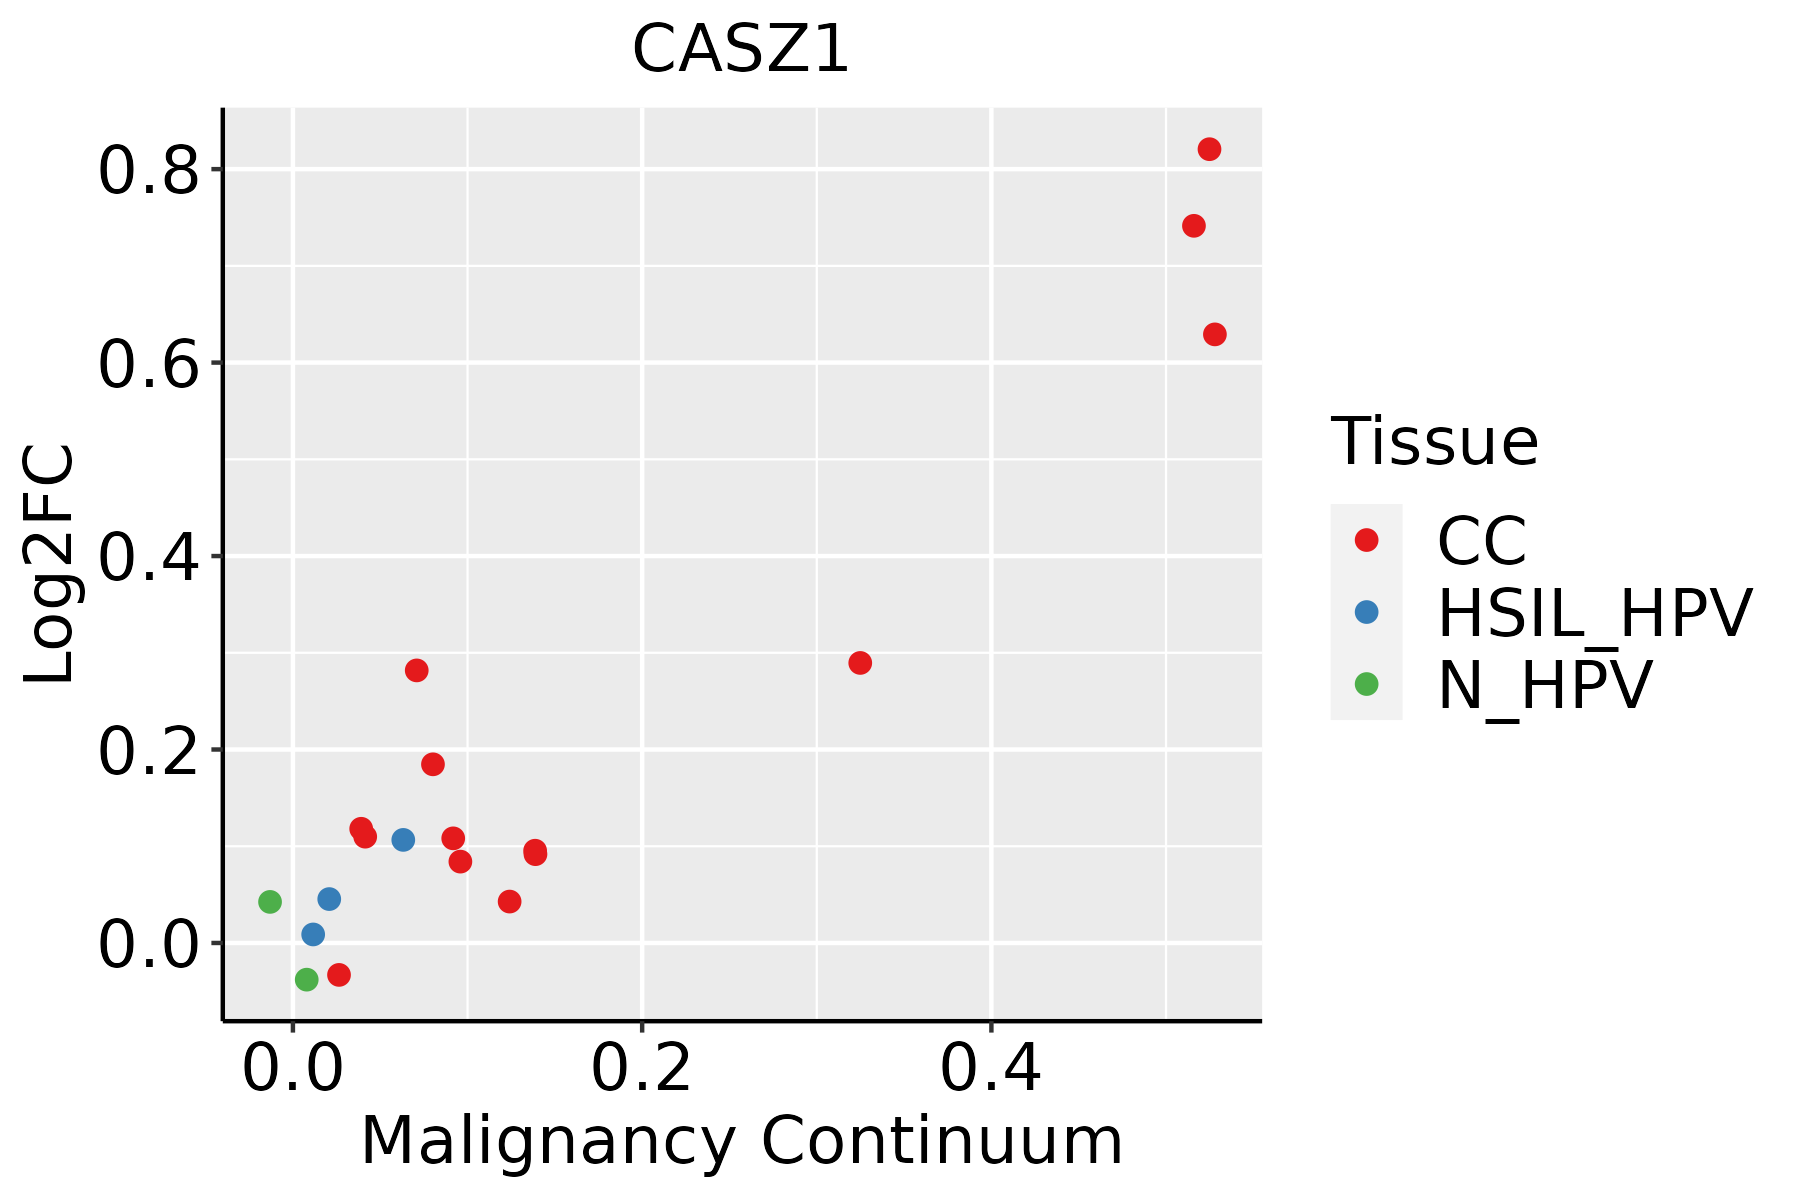 | CC: Cervix cancer |
| HSIL_HPV: HPV-infected high-grade squamous intraepithelial lesions | ||
| N_HPV: HPV-infected normal cervix | ||
| Colorectum (GSE201348) |  | FAP: Familial adenomatous polyposis |
| CRC: Colorectal cancer | ||
| Colorectum (HTA11) |  | AD: Adenomas |
| SER: Sessile serrated lesions | ||
| MSI-H: Microsatellite-high colorectal cancer | ||
| MSS: Microsatellite stable colorectal cancer | ||
| Esophagus |  | ESCC: Esophageal squamous cell carcinoma |
| HGIN: High-grade intraepithelial neoplasias | ||
| LGIN: Low-grade intraepithelial neoplasias | ||
| GC | 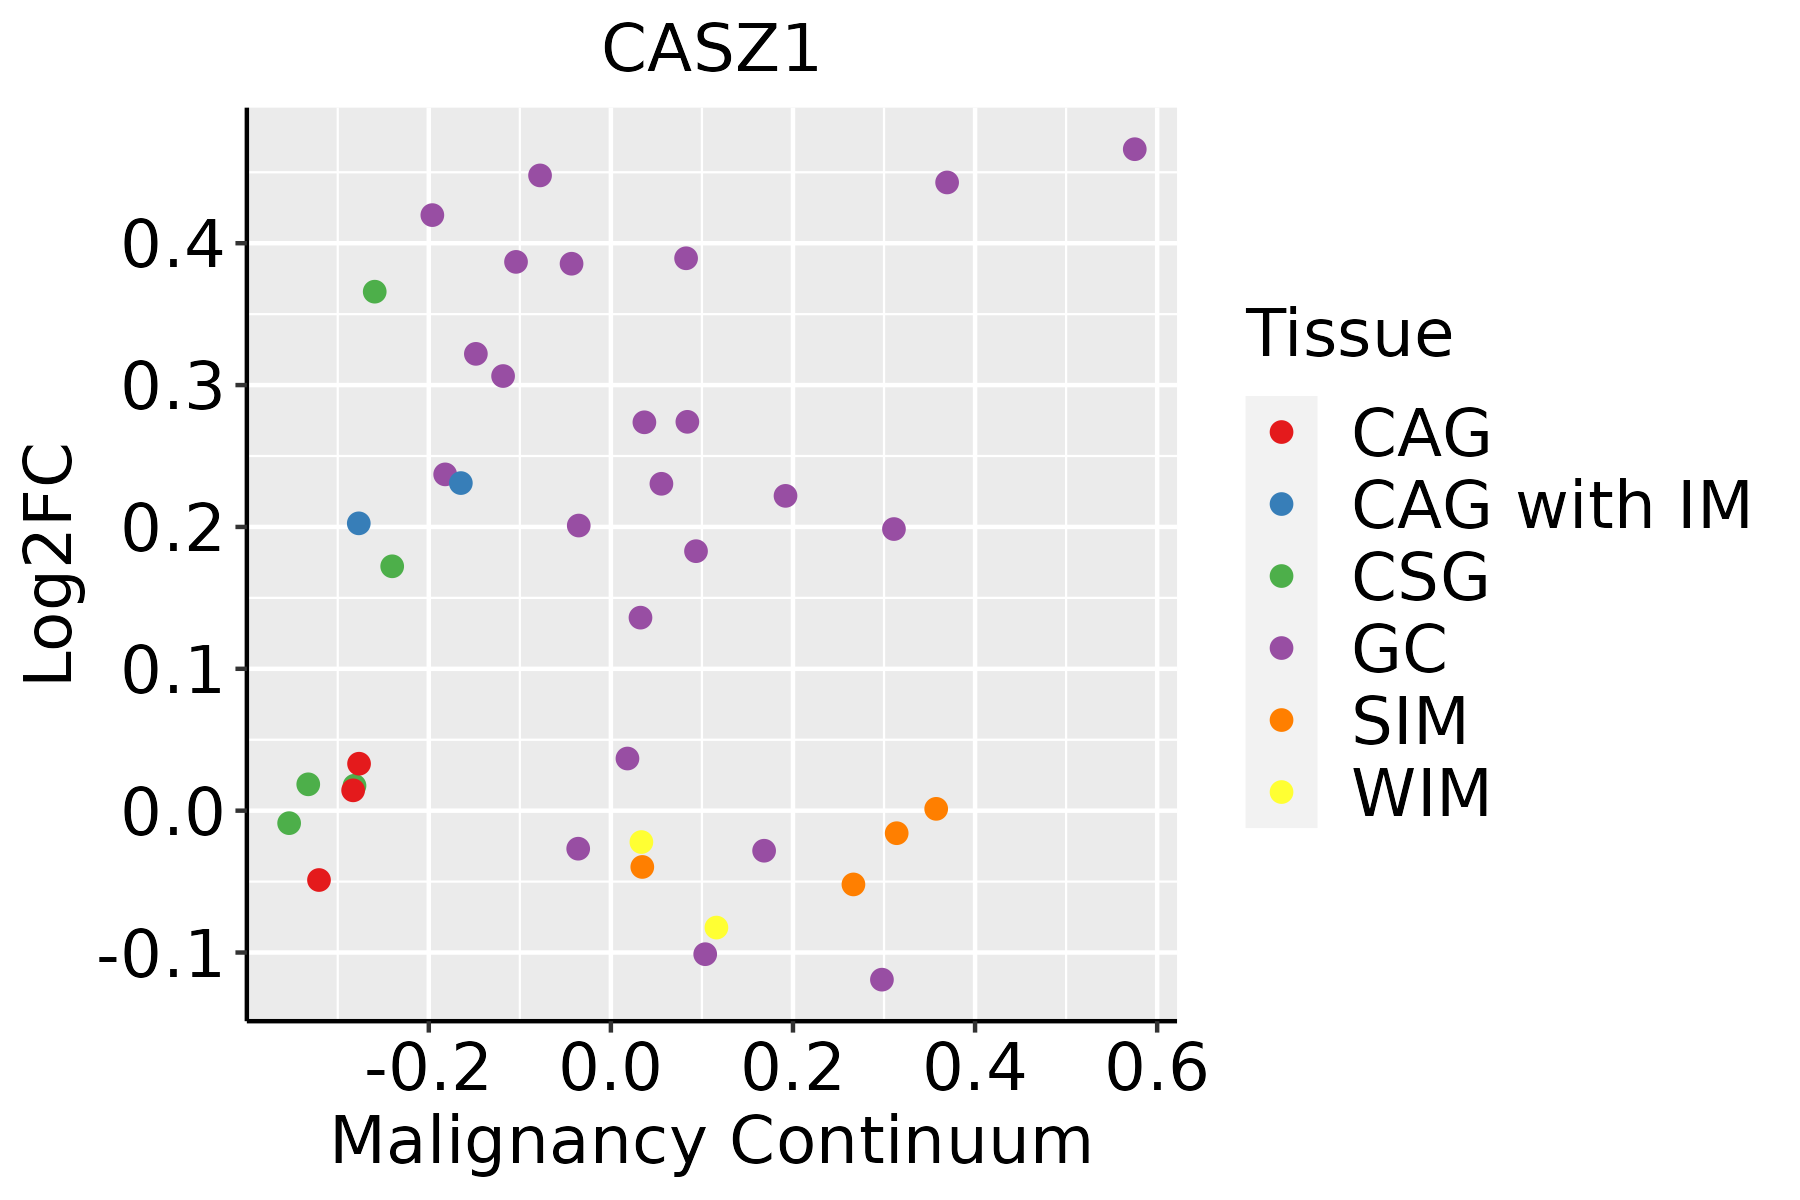 | CAG: Chronic atrophic gastritis |
| CAG with IM: Chronic atrophic gastritis with intestinal metaplasia | ||
| CSG: Chronic superficial gastritis | ||
| GC: Gastric cancer | ||
| SIM: Severe intestinal metaplasia | ||
| WIM: Wild intestinal metaplasia | ||
| Skin | 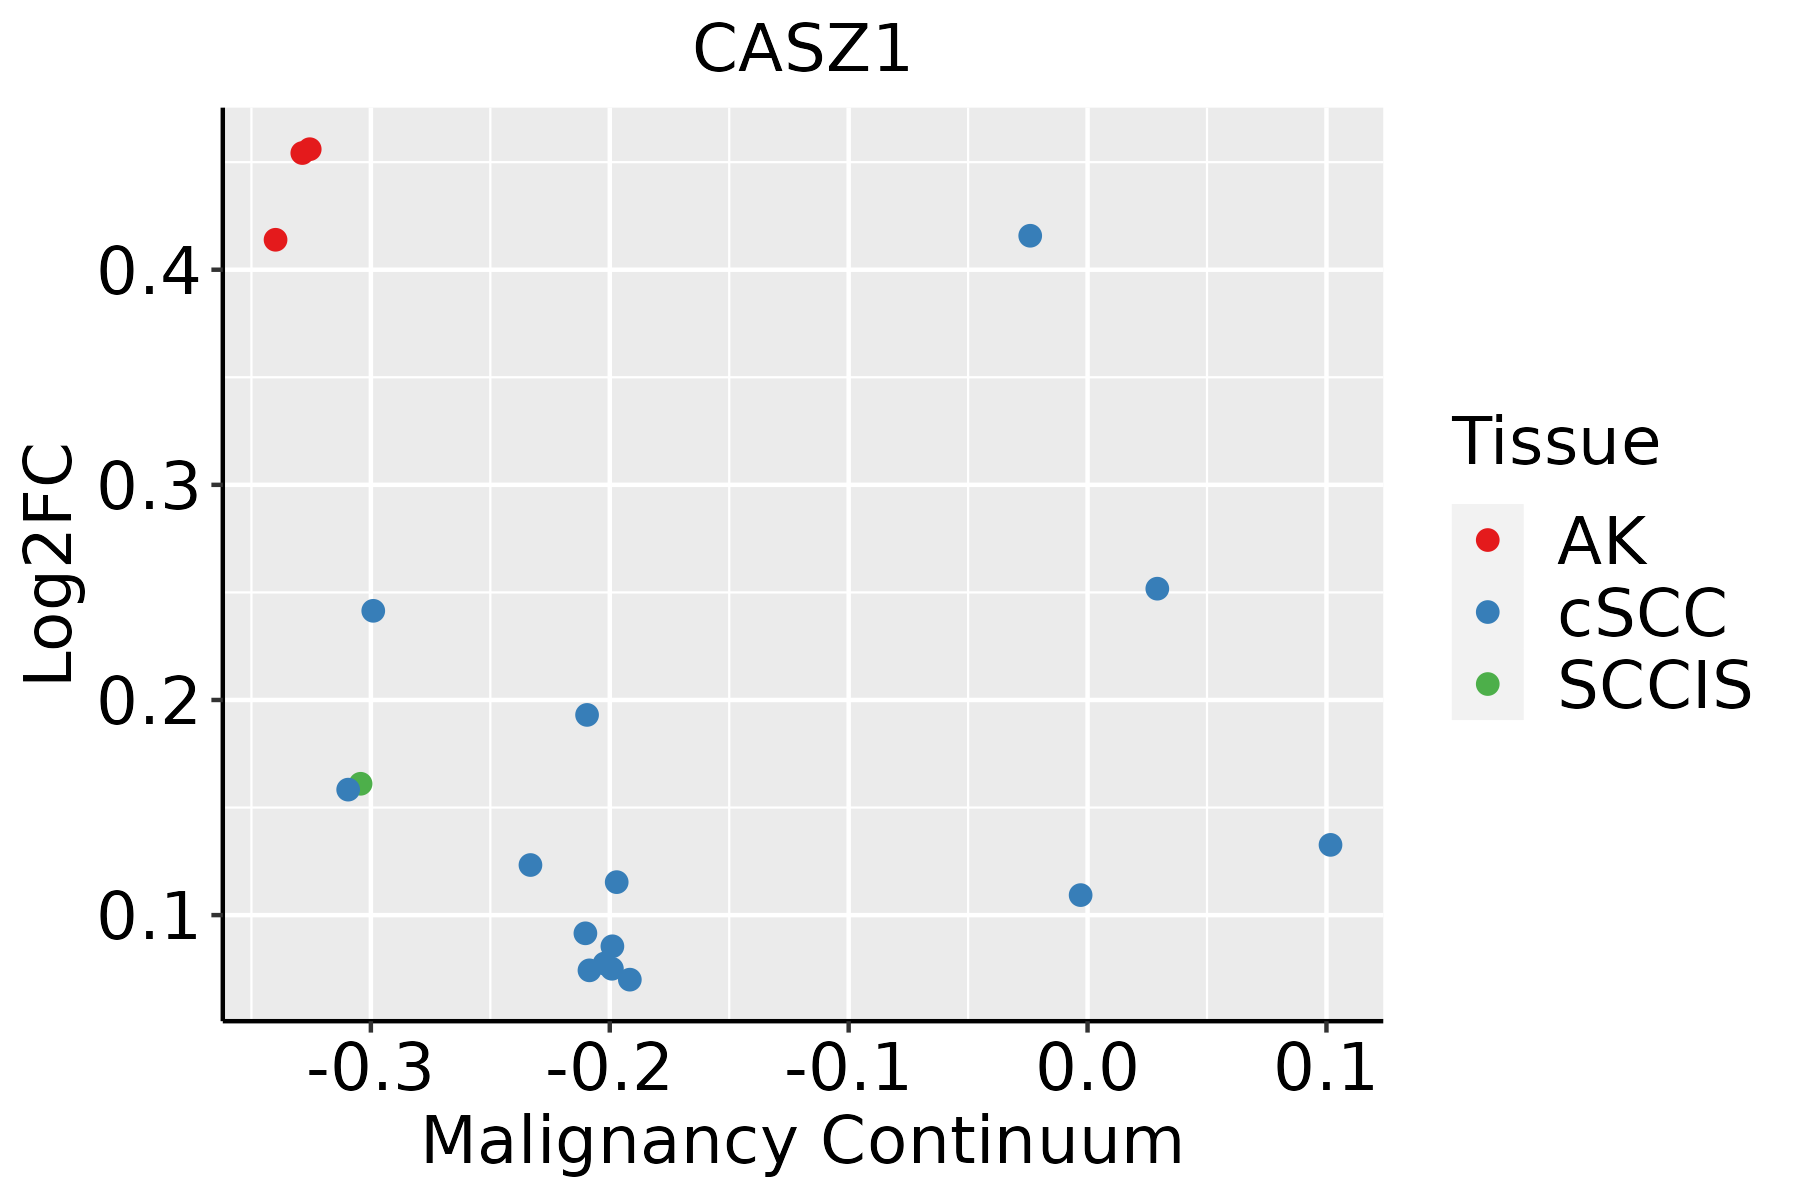 | AK: Actinic keratosis |
| cSCC: Cutaneous squamous cell carcinoma | ||
| SCCIS:squamous cell carcinoma in situ |
| ∗log2FC in expression of this searched gene in stem-like cells from each diseased tissue sample relative to stem-like cells in normal samples in each tissue plotted against the malignancy continuum. Samples are colored based on if they are from different disease stage. |
Top |
Malignant transformation related pathway analysis |
| Find out the enriched GO biological processes and KEGG pathways involved in transition from healthy to precancer to cancer |
| Tissue | Disease Stage | Enriched GO biological Processes |
| Colorectum | AD |  |
| Colorectum | SER |  |
| Colorectum | MSS |  |
| Colorectum | MSI-H |  |
| Colorectum | FAP |  |
| ∗Top 15 enriched GO BP terms are showed in the bar plot of each disease state in each tissue. Each row represents a significant GO biological process which is colored according to the -log10(p.adjust). |
| Page: 1 2 3 4 5 6 7 8 9 |
| GO ID | Tissue | Disease Stage | Description | Gene Ratio | Bg Ratio | pvalue | p.adjust | Count |
| Page: 1 |
| Pathway ID | Tissue | Disease Stage | Description | Gene Ratio | Bg Ratio | pvalue | p.adjust | qvalue | Count |
| Page: 1 |
Top |
Cell-cell communication analysis |
| Identification of potential cell-cell interactions between two cell types and their ligand-receptor pairs for different disease states |
| Ligand | Receptor | LRpair | Pathway | Tissue | Disease Stage |
| Page: 1 |
Top |
Single-cell gene regulatory network inference analysis |
| Find out the significant the regulons (TFs) and the target genes of each regulon across cell types for different disease states |
| TF | Cell Type | Tissue | Disease Stage | Target Gene | RSS | Regulon Activity |
| ∗The dot plots of a searched regulon are shown for all cell subpopulations in each disease state of each tissue based on the regulon specific score inferred using pySCENIC and by calculating the average expression. |
| Page: 1 |
Top |
Somatic mutation of malignant transformation related genes |
| Annotation of somatic variants for genes involved in malignant transformation |
| Hugo Symbol | Variant Class | Variant Classification | dbSNP RS | HGVSc | HGVSp | HGVSp Short | SWISSPROT | BIOTYPE | SIFT | PolyPhen | Tumor Sample Barcode | Tissue | Histology | Sex | Age | Stage | Therapy Types | Drugs | Outcome |
| CASZ1 | SNV | Missense_Mutation | novel | c.4016C>T | p.Ser1339Phe | p.S1339F | Q86V15 | protein_coding | deleterious_low_confidence(0) | benign(0.421) | TCGA-A2-A0CR-01 | Breast | breast invasive carcinoma | Female | <65 | I/II | Chemotherapy | adriamycin | CR |
| CASZ1 | SNV | Missense_Mutation | novel | c.2621C>T | p.Ser874Leu | p.S874L | Q86V15 | protein_coding | tolerated_low_confidence(0.14) | possibly_damaging(0.68) | TCGA-A2-A3XY-01 | Breast | breast invasive carcinoma | Female | <65 | I/II | Chemotherapy | adriamycin | PD |
| CASZ1 | SNV | Missense_Mutation | c.1114C>T | p.Arg372Cys | p.R372C | Q86V15 | protein_coding | deleterious_low_confidence(0) | probably_damaging(0.997) | TCGA-A8-A09K-01 | Breast | breast invasive carcinoma | Female | >=65 | I/II | Unknown | Unknown | SD | |
| CASZ1 | SNV | Missense_Mutation | c.1306G>T | p.Asp436Tyr | p.D436Y | Q86V15 | protein_coding | deleterious_low_confidence(0) | probably_damaging(0.999) | TCGA-AN-A046-01 | Breast | breast invasive carcinoma | Female | >=65 | I/II | Unknown | Unknown | SD | |
| CASZ1 | SNV | Missense_Mutation | c.1946N>G | p.Tyr649Cys | p.Y649C | Q86V15 | protein_coding | deleterious(0.03) | probably_damaging(0.999) | TCGA-BH-A0C1-01 | Breast | breast invasive carcinoma | Female | <65 | III/IV | Chemotherapy | adriamycin | PD | |
| CASZ1 | SNV | Missense_Mutation | rs761954486 | c.2099C>T | p.Ser700Leu | p.S700L | Q86V15 | protein_coding | tolerated(0.18) | probably_damaging(0.988) | TCGA-BH-A1FL-01 | Breast | breast invasive carcinoma | Female | >=65 | I/II | Unknown | Unknown | PD |
| CASZ1 | SNV | Missense_Mutation | c.3032G>A | p.Arg1011His | p.R1011H | Q86V15 | protein_coding | deleterious(0.02) | probably_damaging(0.996) | TCGA-E9-A228-01 | Breast | breast invasive carcinoma | Female | <65 | I/II | Chemotherapy | doxorubicin | SD | |
| CASZ1 | SNV | Missense_Mutation | novel | c.1029N>A | p.Asn343Lys | p.N343K | Q86V15 | protein_coding | deleterious_low_confidence(0) | probably_damaging(0.994) | TCGA-LL-A73Z-01 | Breast | breast invasive carcinoma | Female | <65 | III/IV | Chemotherapy | adriamycin | PD |
| CASZ1 | deletion | Frame_Shift_Del | c.1831delC | p.His611ThrfsTer75 | p.H611Tfs*75 | Q86V15 | protein_coding | TCGA-AC-A23H-01 | Breast | breast invasive carcinoma | Female | >=65 | I/II | Unknown | Unknown | PD | |||
| CASZ1 | insertion | In_Frame_Ins | novel | c.2787_2788insCCC | p.Arg929_Ser930insPro | p.R929_S930insP | Q86V15 | protein_coding | TCGA-BH-A0E2-01 | Breast | breast invasive carcinoma | Female | <65 | III/IV | Chemotherapy | doxorubicin | SD |
| Page: 1 2 3 4 5 6 7 8 9 10 11 12 13 14 15 16 17 |
Top |
Related drugs of malignant transformation related genes |
| Identification of chemicals and drugs interact with genes involved in malignant transfromation |
| (DGIdb 4.0) |
| Entrez ID | Symbol | Category | Interaction Types | Drug Claim Name | Drug Name | PMIDs |
| Page: 1 |

Copyright 2023-Present -The University of Texas Health Science Center at Houston |