
|
|||||
|
 | |
| |
| |
| |
| |
| |
|
Gene: CAMK2G |
Gene summary for CAMK2G |
| Gene information | Species | Human | Gene symbol | CAMK2G | Gene ID | 818 |
| Gene name | calcium/calmodulin dependent protein kinase II gamma | |
| Gene Alias | CAMK | |
| Cytomap | 10q22.2 | |
| Gene Type | protein-coding | GO ID | GO:0002790 | UniProtAcc | A0A0A0MS52 |
Top |
Malignant transformation analysis |
| Identification of the aberrant gene expression in precancerous and cancerous lesions by comparing the gene expression of stem-like cells in diseased tissues with normal stem cells |
| Entrez ID | Symbol | Replicates | Species | Organ | Tissue | Adj P-value | Log2FC | Malignancy |
| 818 | CAMK2G | P28T-E | Human | Esophagus | ESCC | 8.73e-23 | 4.02e-01 | 0.1149 |
| 818 | CAMK2G | P30T-E | Human | Esophagus | ESCC | 2.27e-25 | 8.39e-01 | 0.137 |
| 818 | CAMK2G | P31T-E | Human | Esophagus | ESCC | 5.27e-26 | 5.06e-01 | 0.1251 |
| 818 | CAMK2G | P32T-E | Human | Esophagus | ESCC | 1.17e-14 | 2.33e-01 | 0.1666 |
| 818 | CAMK2G | P36T-E | Human | Esophagus | ESCC | 3.96e-22 | 5.51e-01 | 0.1187 |
| 818 | CAMK2G | P37T-E | Human | Esophagus | ESCC | 3.93e-17 | 4.09e-01 | 0.1371 |
| 818 | CAMK2G | P38T-E | Human | Esophagus | ESCC | 2.75e-04 | 1.67e-01 | 0.127 |
| 818 | CAMK2G | P39T-E | Human | Esophagus | ESCC | 3.52e-22 | 4.57e-01 | 0.0894 |
| 818 | CAMK2G | P40T-E | Human | Esophagus | ESCC | 1.02e-16 | 4.41e-01 | 0.109 |
| 818 | CAMK2G | P42T-E | Human | Esophagus | ESCC | 8.67e-22 | 4.81e-01 | 0.1175 |
| 818 | CAMK2G | P44T-E | Human | Esophagus | ESCC | 1.31e-14 | 3.07e-01 | 0.1096 |
| 818 | CAMK2G | P47T-E | Human | Esophagus | ESCC | 3.76e-25 | 3.19e-01 | 0.1067 |
| 818 | CAMK2G | P48T-E | Human | Esophagus | ESCC | 3.02e-14 | 3.92e-01 | 0.0959 |
| 818 | CAMK2G | P49T-E | Human | Esophagus | ESCC | 3.76e-12 | 1.26e+00 | 0.1768 |
| 818 | CAMK2G | P52T-E | Human | Esophagus | ESCC | 1.89e-32 | 7.12e-01 | 0.1555 |
| 818 | CAMK2G | P54T-E | Human | Esophagus | ESCC | 2.04e-22 | 5.01e-01 | 0.0975 |
| 818 | CAMK2G | P56T-E | Human | Esophagus | ESCC | 2.95e-06 | 8.64e-01 | 0.1613 |
| 818 | CAMK2G | P57T-E | Human | Esophagus | ESCC | 6.46e-24 | 2.40e-01 | 0.0926 |
| 818 | CAMK2G | P61T-E | Human | Esophagus | ESCC | 3.17e-12 | 2.35e-01 | 0.099 |
| 818 | CAMK2G | P62T-E | Human | Esophagus | ESCC | 9.98e-42 | 7.13e-01 | 0.1302 |
| Page: 1 2 3 4 5 6 7 |
| Tissue | Expression Dynamics | Abbreviation |
| Colorectum (GSE201348) | 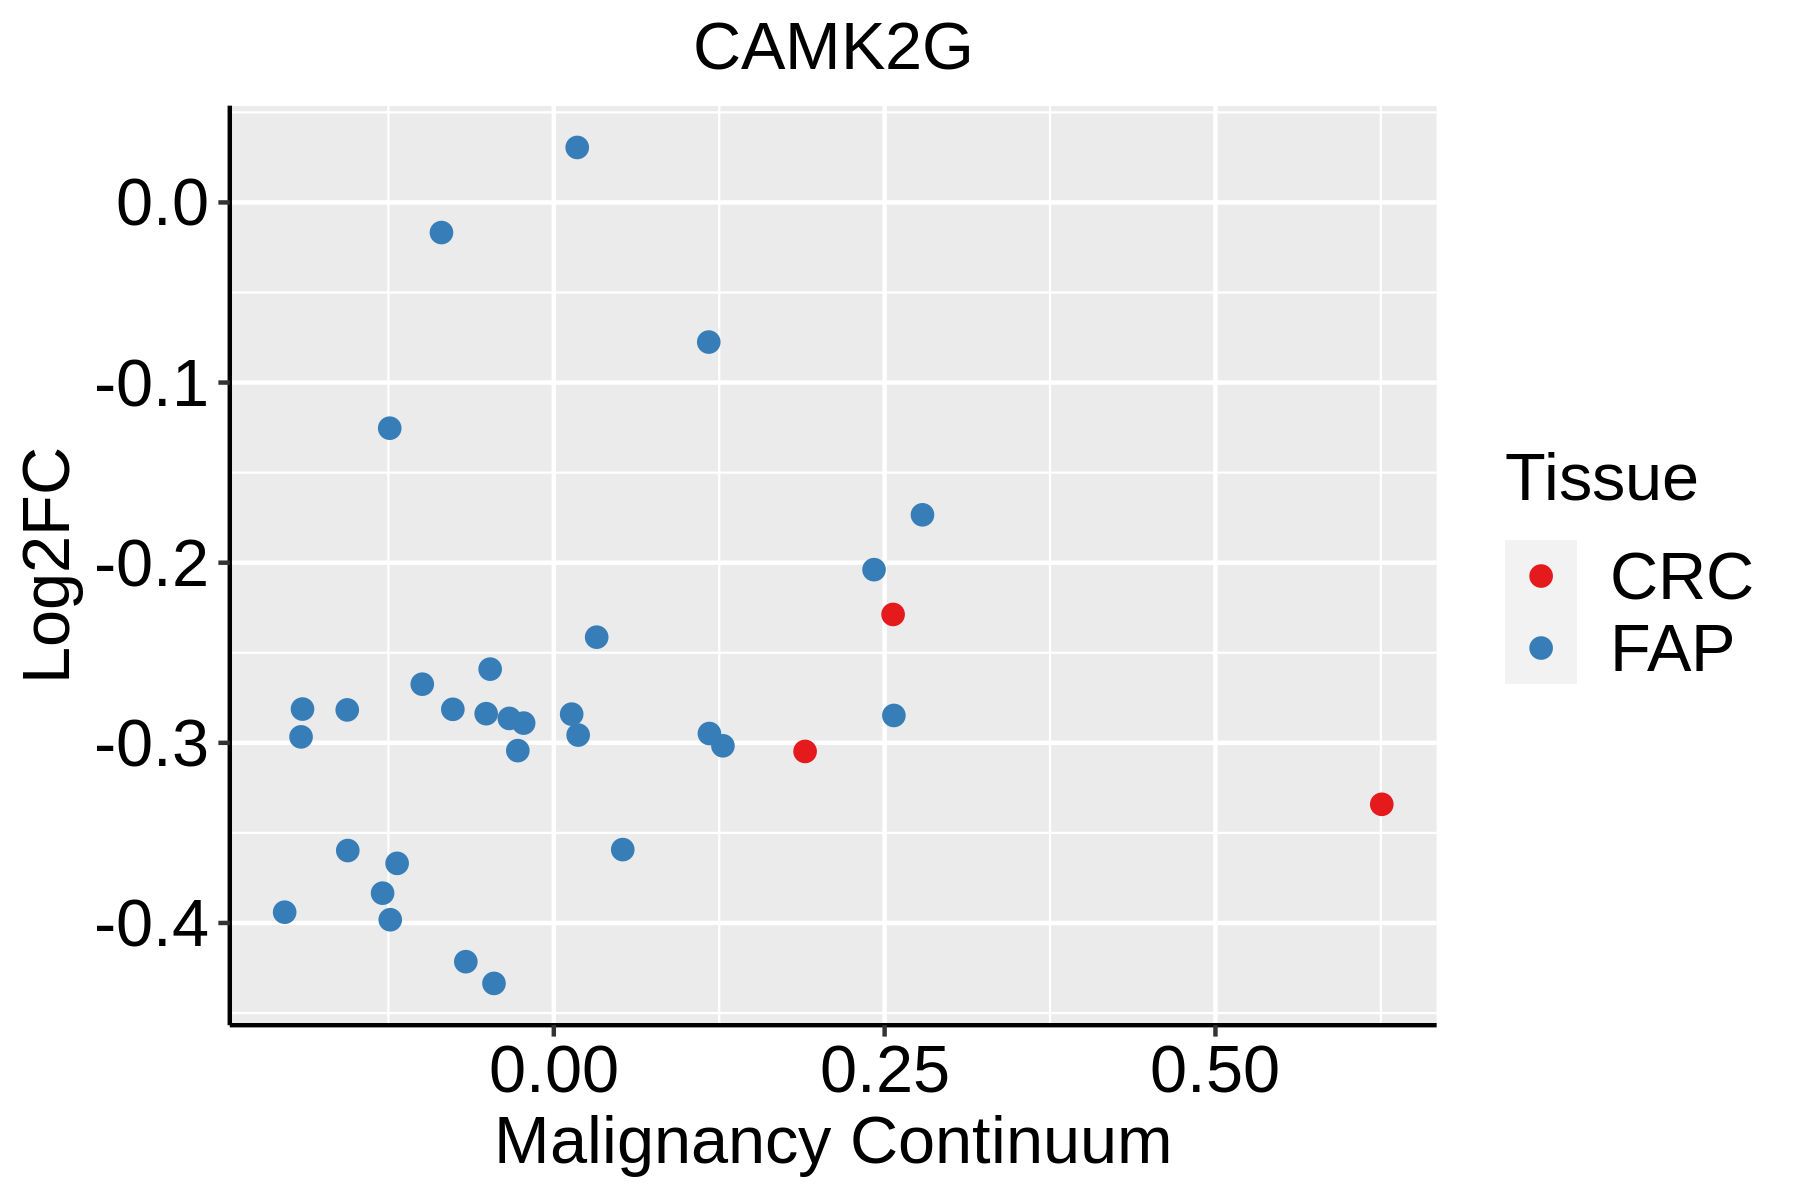 | FAP: Familial adenomatous polyposis |
| CRC: Colorectal cancer | ||
| Colorectum (HTA11) |  | AD: Adenomas |
| SER: Sessile serrated lesions | ||
| MSI-H: Microsatellite-high colorectal cancer | ||
| MSS: Microsatellite stable colorectal cancer | ||
| Esophagus | 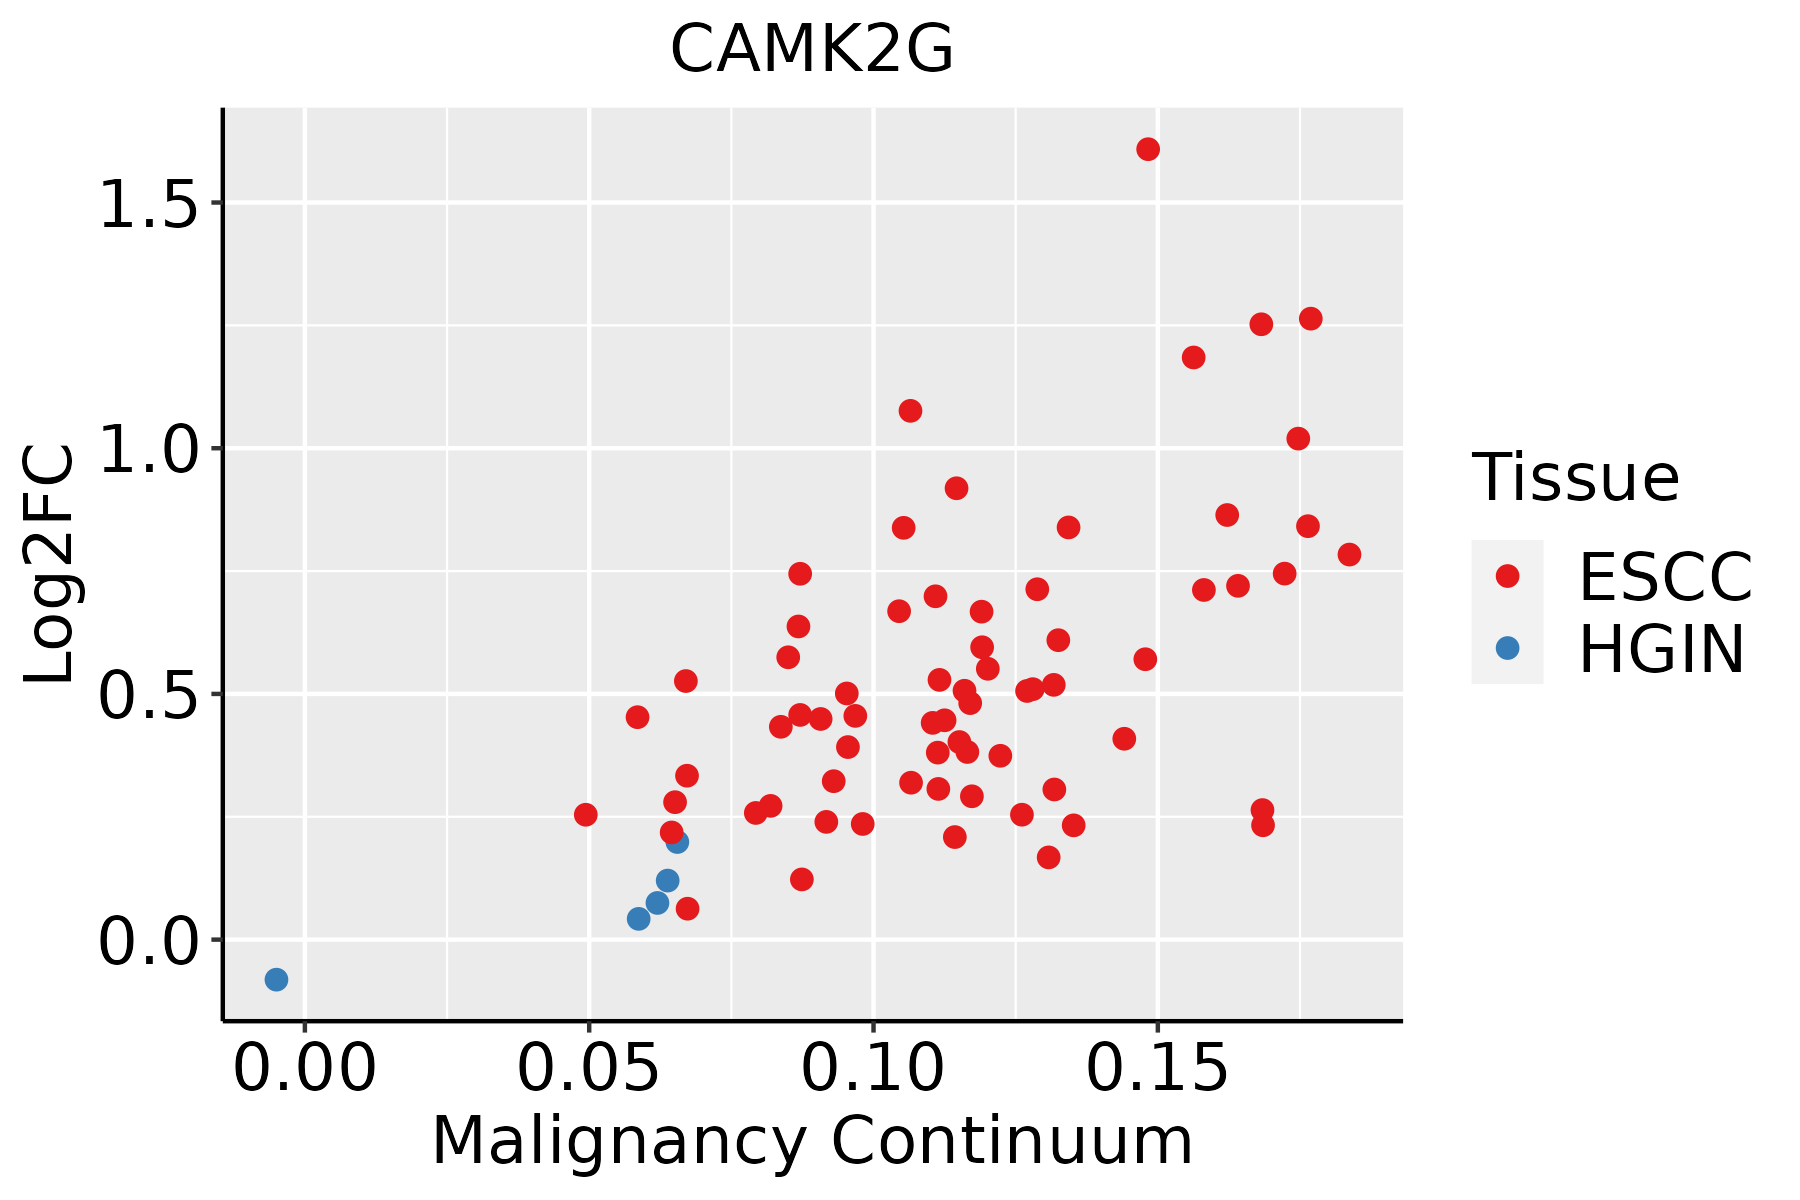 | ESCC: Esophageal squamous cell carcinoma |
| HGIN: High-grade intraepithelial neoplasias | ||
| LGIN: Low-grade intraepithelial neoplasias | ||
| Liver | 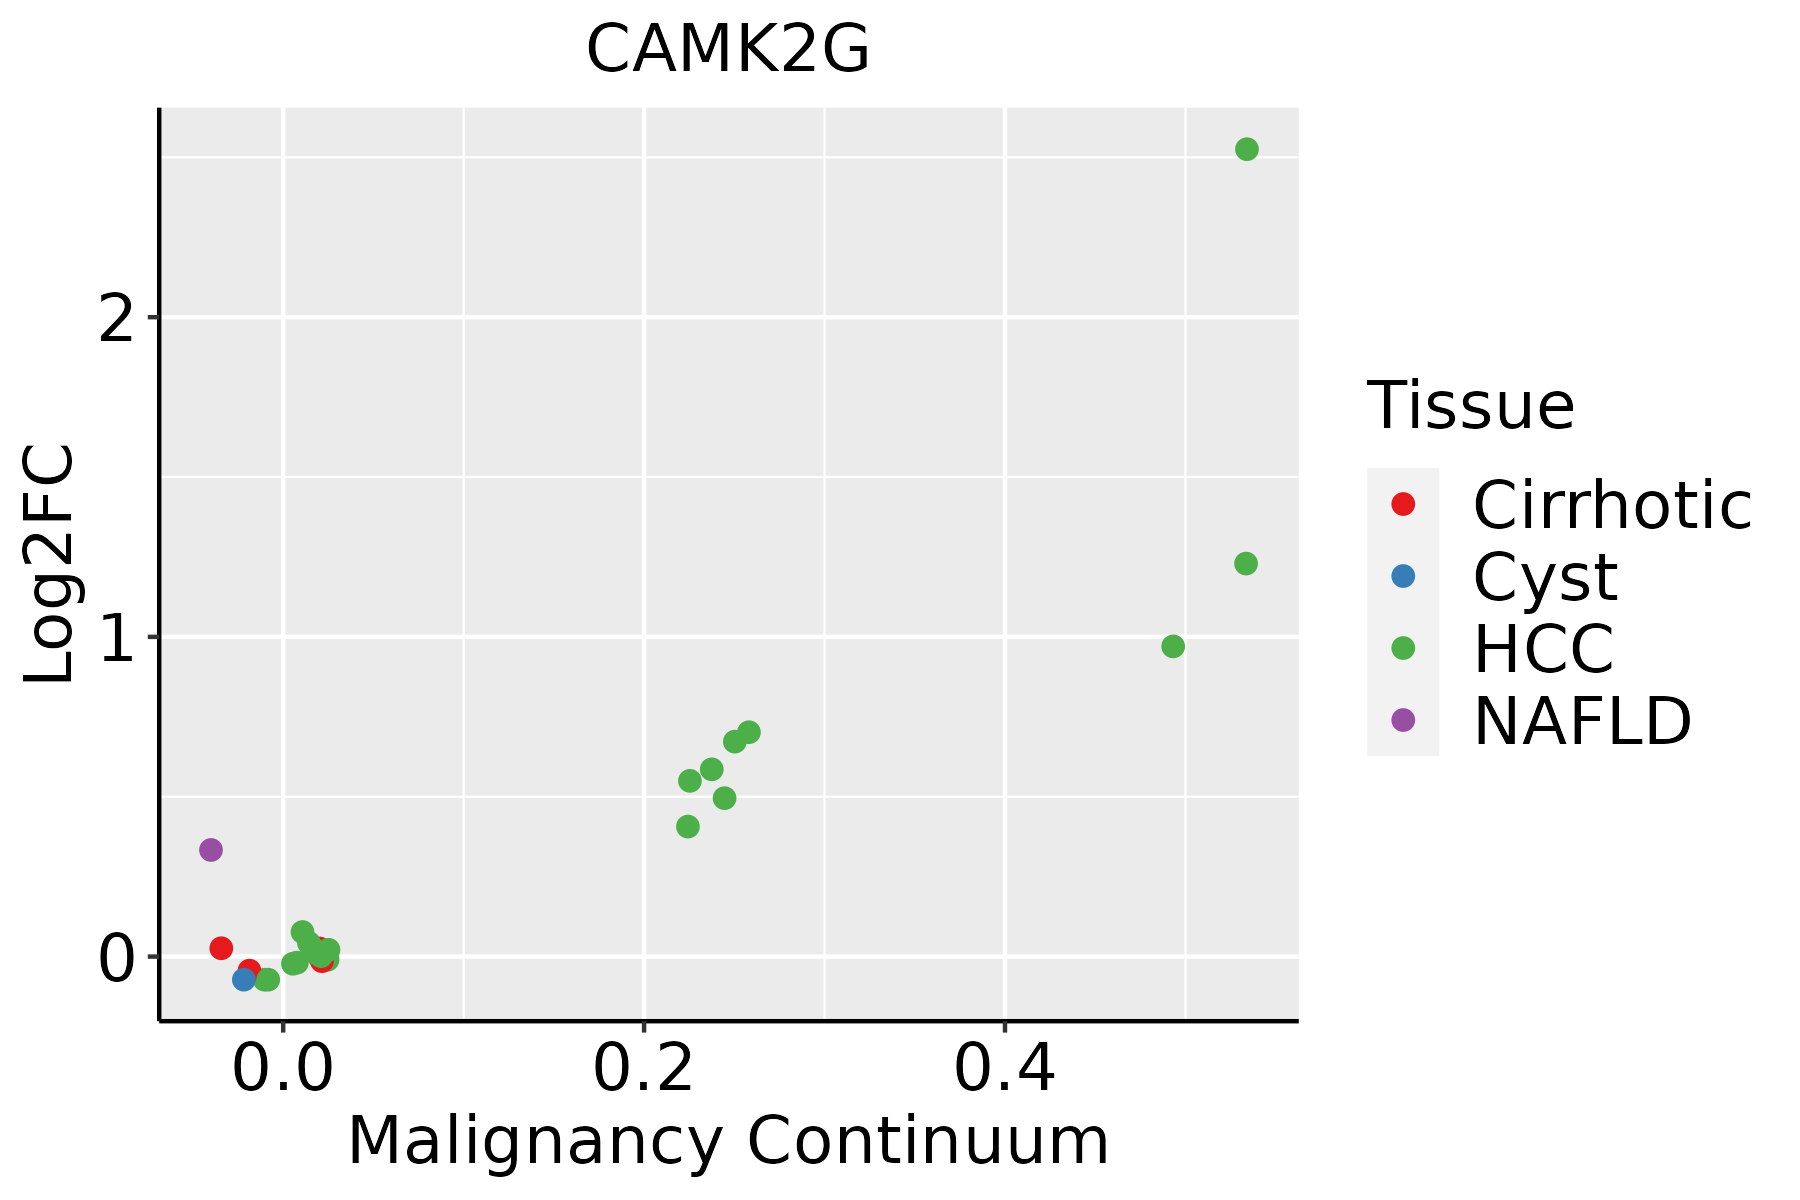 | HCC: Hepatocellular carcinoma |
| NAFLD: Non-alcoholic fatty liver disease | ||
| Oral Cavity |  | EOLP: Erosive Oral lichen planus |
| LP: leukoplakia | ||
| NEOLP: Non-erosive oral lichen planus | ||
| OSCC: Oral squamous cell carcinoma |
| ∗log2FC in expression of this searched gene in stem-like cells from each diseased tissue sample relative to stem-like cells in normal samples in each tissue plotted against the malignancy continuum. Samples are colored based on if they are from different disease stage. |
Top |
Malignant transformation related pathway analysis |
| Find out the enriched GO biological processes and KEGG pathways involved in transition from healthy to precancer to cancer |
| Tissue | Disease Stage | Enriched GO biological Processes |
| Colorectum | AD |  |
| Colorectum | SER |  |
| Colorectum | MSS |  |
| Colorectum | MSI-H |  |
| Colorectum | FAP |  |
| ∗Top 15 enriched GO BP terms are showed in the bar plot of each disease state in each tissue. Each row represents a significant GO biological process which is colored according to the -log10(p.adjust). |
| Page: 1 2 3 4 5 6 7 8 9 |
| GO ID | Tissue | Disease Stage | Description | Gene Ratio | Bg Ratio | pvalue | p.adjust | Count |
| GO:0016311 | Colorectum | AD | dephosphorylation | 123/3918 | 417/18723 | 1.84e-05 | 3.82e-04 | 123 |
| GO:0006470 | Colorectum | AD | protein dephosphorylation | 88/3918 | 281/18723 | 2.56e-05 | 4.89e-04 | 88 |
| GO:0010975 | Colorectum | AD | regulation of neuron projection development | 129/3918 | 445/18723 | 2.88e-05 | 5.37e-04 | 129 |
| GO:0009306 | Colorectum | AD | protein secretion | 105/3918 | 359/18723 | 1.05e-04 | 1.57e-03 | 105 |
| GO:0035592 | Colorectum | AD | establishment of protein localization to extracellular region | 105/3918 | 360/18723 | 1.18e-04 | 1.73e-03 | 105 |
| GO:0071692 | Colorectum | AD | protein localization to extracellular region | 106/3918 | 368/18723 | 1.86e-04 | 2.49e-03 | 106 |
| GO:0030073 | Colorectum | AD | insulin secretion | 61/3918 | 195/18723 | 4.28e-04 | 4.81e-03 | 61 |
| GO:0015833 | Colorectum | AD | peptide transport | 77/3918 | 264/18723 | 8.90e-04 | 8.60e-03 | 77 |
| GO:0090257 | Colorectum | AD | regulation of muscle system process | 73/3918 | 252/18723 | 1.46e-03 | 1.24e-02 | 73 |
| GO:0030072 | Colorectum | AD | peptide hormone secretion | 68/3918 | 236/18723 | 2.39e-03 | 1.85e-02 | 68 |
| GO:0002790 | Colorectum | AD | peptide secretion | 69/3918 | 242/18723 | 2.97e-03 | 2.22e-02 | 69 |
| GO:0042886 | Colorectum | AD | amide transport | 83/3918 | 301/18723 | 3.37e-03 | 2.46e-02 | 83 |
| GO:0043502 | Colorectum | AD | regulation of muscle adaptation | 31/3918 | 98/18723 | 8.45e-03 | 4.94e-02 | 31 |
| GO:00902571 | Colorectum | SER | regulation of muscle system process | 60/2897 | 252/18723 | 3.28e-04 | 5.22e-03 | 60 |
| GO:00064701 | Colorectum | SER | protein dephosphorylation | 65/2897 | 281/18723 | 4.44e-04 | 6.51e-03 | 65 |
| GO:00093061 | Colorectum | SER | protein secretion | 79/2897 | 359/18723 | 5.99e-04 | 8.19e-03 | 79 |
| GO:00355921 | Colorectum | SER | establishment of protein localization to extracellular region | 79/2897 | 360/18723 | 6.54e-04 | 8.77e-03 | 79 |
| GO:00716921 | Colorectum | SER | protein localization to extracellular region | 80/2897 | 368/18723 | 8.13e-04 | 1.01e-02 | 80 |
| GO:00435021 | Colorectum | SER | regulation of muscle adaptation | 27/2897 | 98/18723 | 1.54e-03 | 1.65e-02 | 27 |
| GO:00109751 | Colorectum | SER | regulation of neuron projection development | 92/2897 | 445/18723 | 1.85e-03 | 1.89e-02 | 92 |
| Page: 1 2 3 4 5 |
| Pathway ID | Tissue | Disease Stage | Description | Gene Ratio | Bg Ratio | pvalue | p.adjust | qvalue | Count |
| hsa05012 | Colorectum | AD | Parkinson disease | 147/2092 | 266/8465 | 2.53e-27 | 8.48e-25 | 5.41e-25 | 147 |
| hsa05415 | Colorectum | AD | Diabetic cardiomyopathy | 114/2092 | 203/8465 | 3.65e-22 | 3.06e-20 | 1.95e-20 | 114 |
| hsa05022 | Colorectum | AD | Pathways of neurodegeneration - multiple diseases | 201/2092 | 476/8465 | 4.54e-18 | 1.27e-16 | 8.09e-17 | 201 |
| hsa04066 | Colorectum | AD | HIF-1 signaling pathway | 48/2092 | 109/8465 | 7.25e-06 | 7.84e-05 | 5.00e-05 | 48 |
| hsa04722 | Colorectum | AD | Neurotrophin signaling pathway | 50/2092 | 119/8465 | 2.28e-05 | 2.24e-04 | 1.43e-04 | 50 |
| hsa04922 | Colorectum | AD | Glucagon signaling pathway | 41/2092 | 107/8465 | 1.18e-03 | 7.75e-03 | 4.94e-03 | 41 |
| hsa05417 | Colorectum | AD | Lipid and atherosclerosis | 73/2092 | 215/8465 | 1.31e-03 | 8.27e-03 | 5.27e-03 | 73 |
| hsa05205 | Colorectum | AD | Proteoglycans in cancer | 70/2092 | 205/8465 | 1.37e-03 | 8.46e-03 | 5.39e-03 | 70 |
| hsa04912 | Colorectum | AD | GnRH signaling pathway | 35/2092 | 93/8465 | 3.69e-03 | 1.90e-02 | 1.21e-02 | 35 |
| hsa04360 | Colorectum | AD | Axon guidance | 61/2092 | 182/8465 | 4.36e-03 | 2.17e-02 | 1.38e-02 | 61 |
| hsa04728 | Colorectum | AD | Dopaminergic synapse | 46/2092 | 132/8465 | 5.55e-03 | 2.48e-02 | 1.58e-02 | 46 |
| hsa04971 | Colorectum | AD | Gastric acid secretion | 29/2092 | 76/8465 | 6.25e-03 | 2.68e-02 | 1.71e-02 | 29 |
| hsa04720 | Colorectum | AD | Long-term potentiation | 26/2092 | 67/8465 | 7.26e-03 | 2.97e-02 | 1.89e-02 | 26 |
| hsa04012 | Colorectum | AD | ErbB signaling pathway | 31/2092 | 85/8465 | 1.02e-02 | 3.91e-02 | 2.50e-02 | 31 |
| hsa04310 | Colorectum | AD | Wnt signaling pathway | 56/2092 | 171/8465 | 1.03e-02 | 3.93e-02 | 2.51e-02 | 56 |
| hsa050121 | Colorectum | AD | Parkinson disease | 147/2092 | 266/8465 | 2.53e-27 | 8.48e-25 | 5.41e-25 | 147 |
| hsa054151 | Colorectum | AD | Diabetic cardiomyopathy | 114/2092 | 203/8465 | 3.65e-22 | 3.06e-20 | 1.95e-20 | 114 |
| hsa050221 | Colorectum | AD | Pathways of neurodegeneration - multiple diseases | 201/2092 | 476/8465 | 4.54e-18 | 1.27e-16 | 8.09e-17 | 201 |
| hsa040661 | Colorectum | AD | HIF-1 signaling pathway | 48/2092 | 109/8465 | 7.25e-06 | 7.84e-05 | 5.00e-05 | 48 |
| hsa047221 | Colorectum | AD | Neurotrophin signaling pathway | 50/2092 | 119/8465 | 2.28e-05 | 2.24e-04 | 1.43e-04 | 50 |
| Page: 1 2 3 4 5 6 7 8 9 10 11 12 |
Top |
Cell-cell communication analysis |
| Identification of potential cell-cell interactions between two cell types and their ligand-receptor pairs for different disease states |
| Ligand | Receptor | LRpair | Pathway | Tissue | Disease Stage |
| Page: 1 |
Top |
Single-cell gene regulatory network inference analysis |
| Find out the significant the regulons (TFs) and the target genes of each regulon across cell types for different disease states |
| TF | Cell Type | Tissue | Disease Stage | Target Gene | RSS | Regulon Activity |
| ∗The dot plots of a searched regulon are shown for all cell subpopulations in each disease state of each tissue based on the regulon specific score inferred using pySCENIC and by calculating the average expression. |
| Page: 1 |
Top |
Somatic mutation of malignant transformation related genes |
| Annotation of somatic variants for genes involved in malignant transformation |
| Hugo Symbol | Variant Class | Variant Classification | dbSNP RS | HGVSc | HGVSp | HGVSp Short | SWISSPROT | BIOTYPE | SIFT | PolyPhen | Tumor Sample Barcode | Tissue | Histology | Sex | Age | Stage | Therapy Types | Drugs | Outcome |
| CAMK2G | SNV | Missense_Mutation | c.191T>C | p.Ile64Thr | p.I64T | Q13555 | protein_coding | deleterious_low_confidence(0) | probably_damaging(0.998) | TCGA-A8-A07R-01 | Breast | breast invasive carcinoma | Female | >=65 | III/IV | Ancillary | zoledronic | SD | |
| CAMK2G | SNV | Missense_Mutation | novel | c.319N>G | p.Tyr107Asp | p.Y107D | Q13555 | protein_coding | deleterious_low_confidence(0) | possibly_damaging(0.637) | TCGA-A8-A08B-01 | Breast | breast invasive carcinoma | Female | <65 | I/II | Chemotherapy | 5-fluorouracil | CR |
| CAMK2G | SNV | Missense_Mutation | novel | c.532C>A | p.Pro178Thr | p.P178T | Q13555 | protein_coding | deleterious_low_confidence(0) | probably_damaging(0.998) | TCGA-E2-A56Z-01 | Breast | breast invasive carcinoma | Female | >=65 | I/II | Hormone Therapy | arimidex | SD |
| CAMK2G | insertion | Frame_Shift_Ins | novel | c.316_317insGTGCAGAAGACATGGTTTCTGTCCTG | p.Glu106GlyfsTer41 | p.E106Gfs*41 | Q13555 | protein_coding | TCGA-A8-A08B-01 | Breast | breast invasive carcinoma | Female | <65 | I/II | Chemotherapy | 5-fluorouracil | CR | ||
| CAMK2G | insertion | Nonsense_Mutation | novel | c.520_521insGACATACAA | p.Phe174delinsTer | p.F174delins* | Q13555 | protein_coding | TCGA-AN-A03X-01 | Breast | breast invasive carcinoma | Female | >=65 | I/II | Unknown | Unknown | SD | ||
| CAMK2G | SNV | Missense_Mutation | c.1033G>C | p.Glu345Gln | p.E345Q | Q13555 | protein_coding | tolerated_low_confidence(0.31) | benign(0.062) | TCGA-DS-A1OC-01 | Cervix | cervical & endocervical cancer | Female | <65 | I/II | Chemotherapy | gemcitabine | SD | |
| CAMK2G | SNV | Missense_Mutation | novel | c.709G>A | p.Glu237Lys | p.E237K | Q13555 | protein_coding | deleterious_low_confidence(0) | probably_damaging(0.986) | TCGA-VS-A953-01 | Cervix | cervical & endocervical cancer | Female | <65 | I/II | Unknown | Unknown | PD |
| CAMK2G | SNV | Missense_Mutation | novel | c.168G>T | p.Gln56His | p.Q56H | Q13555 | protein_coding | deleterious_low_confidence(0) | benign(0.182) | TCGA-VS-A9U7-01 | Cervix | cervical & endocervical cancer | Female | <65 | I/II | Chemotherapy | cisplatin | CR |
| CAMK2G | SNV | Missense_Mutation | c.787N>A | p.Ala263Thr | p.A263T | Q13555 | protein_coding | deleterious_low_confidence(0) | probably_damaging(0.991) | TCGA-A6-5665-01 | Colorectum | colon adenocarcinoma | Female | >=65 | I/II | Unknown | Unknown | PD | |
| CAMK2G | SNV | Missense_Mutation | c.712N>C | p.Trp238Arg | p.W238R | Q13555 | protein_coding | deleterious_low_confidence(0) | probably_damaging(1) | TCGA-AA-3663-01 | Colorectum | colon adenocarcinoma | Male | <65 | I/II | Unknown | Unknown | SD |
| Page: 1 2 3 4 5 6 |
Top |
Related drugs of malignant transformation related genes |
| Identification of chemicals and drugs interact with genes involved in malignant transfromation |
| (DGIdb 4.0) |
| Entrez ID | Symbol | Category | Interaction Types | Drug Claim Name | Drug Name | PMIDs |
| 818 | CAMK2G | KINASE, SERINE THREONINE KINASE, DRUGGABLE GENOME, ENZYME | LINIFANIB | LINIFANIB | ||
| 818 | CAMK2G | KINASE, SERINE THREONINE KINASE, DRUGGABLE GENOME, ENZYME | LITHIUM | LITHIUM | 12614997 | |
| 818 | CAMK2G | KINASE, SERINE THREONINE KINASE, DRUGGABLE GENOME, ENZYME | inhibitor | 178102336 | BOSUTINIB | |
| 818 | CAMK2G | KINASE, SERINE THREONINE KINASE, DRUGGABLE GENOME, ENZYME | CYC-116 | CYC-116 | ||
| 818 | CAMK2G | KINASE, SERINE THREONINE KINASE, DRUGGABLE GENOME, ENZYME | ANTIDEPRESSANTS | 12614997 | ||
| 818 | CAMK2G | KINASE, SERINE THREONINE KINASE, DRUGGABLE GENOME, ENZYME | GEFITINIB | GEFITINIB | ||
| 818 | CAMK2G | KINASE, SERINE THREONINE KINASE, DRUGGABLE GENOME, ENZYME | SP-600125 | SP-600125 | ||
| 818 | CAMK2G | KINASE, SERINE THREONINE KINASE, DRUGGABLE GENOME, ENZYME | TAE-684 | TAE-684 | ||
| 818 | CAMK2G | KINASE, SERINE THREONINE KINASE, DRUGGABLE GENOME, ENZYME | LY-2090314 | LY-2090314 | ||
| 818 | CAMK2G | KINASE, SERINE THREONINE KINASE, DRUGGABLE GENOME, ENZYME | DOVITINIB | DOVITINIB |
| Page: 1 2 3 |

Copyright 2023-Present -The University of Texas Health Science Center at Houston |