
|
|||||
|
 | |
| |
| |
| |
| |
| |
|
Gene: CADPS2 |
Gene summary for CADPS2 |
| Gene information | Species | Human | Gene symbol | CADPS2 | Gene ID | 93664 |
| Gene name | calcium dependent secretion activator 2 | |
| Gene Alias | CAPS2 | |
| Cytomap | 7q31.32 | |
| Gene Type | protein-coding | GO ID | GO:0001505 | UniProtAcc | Q86UW7 |
Top |
Malignant transformation analysis |
| Identification of the aberrant gene expression in precancerous and cancerous lesions by comparing the gene expression of stem-like cells in diseased tissues with normal stem cells |
| Entrez ID | Symbol | Replicates | Species | Organ | Tissue | Adj P-value | Log2FC | Malignancy |
| 93664 | CADPS2 | RNA-P17T-P17T-8 | Human | Lung | IAC | 6.60e-11 | 1.17e+00 | 0.3329 |
| 93664 | CADPS2 | RNA-P23T2-P23T2-2 | Human | Lung | MIAC | 9.58e-08 | 1.39e+00 | -0.028 |
| 93664 | CADPS2 | RNA-P23T2-P23T2-4 | Human | Lung | MIAC | 1.45e-03 | 1.26e+00 | -0.0272 |
| 93664 | CADPS2 | RNA-P25T1-P25T1-1 | Human | Lung | AIS | 1.08e-29 | 1.15e+00 | -0.2116 |
| 93664 | CADPS2 | RNA-P25T1-P25T1-2 | Human | Lung | AIS | 3.91e-10 | 1.20e+00 | -0.1941 |
| 93664 | CADPS2 | RNA-P25T1-P25T1-3 | Human | Lung | AIS | 1.12e-15 | 1.15e+00 | -0.2107 |
| 93664 | CADPS2 | RNA-P25T1-P25T1-4 | Human | Lung | AIS | 1.35e-23 | 1.16e+00 | -0.2119 |
| 93664 | CADPS2 | RNA-P3T-P3T-1 | Human | Lung | IAC | 3.07e-07 | 7.65e-01 | 0.1829 |
| 93664 | CADPS2 | RNA-P3T-P3T-2 | Human | Lung | IAC | 6.77e-05 | 5.39e-01 | 0.1835 |
| 93664 | CADPS2 | RNA-P3T-P3T-4 | Human | Lung | IAC | 2.44e-06 | 6.08e-01 | 0.1859 |
| 93664 | CADPS2 | RNA-P6T1-P6T1-1 | Human | Lung | MIAC | 6.00e-05 | 1.03e+00 | -0.0238 |
| 93664 | CADPS2 | RNA-P6T1-P6T1-2 | Human | Lung | MIAC | 1.25e-08 | 1.23e+00 | -0.0186 |
| 93664 | CADPS2 | RNA-P6T1-P6T1-3 | Human | Lung | MIAC | 3.72e-06 | 1.19e+00 | -0.0296 |
| 93664 | CADPS2 | RNA-P6T1-P6T1-4 | Human | Lung | MIAC | 8.95e-10 | 1.21e+00 | -0.0263 |
| 93664 | CADPS2 | RNA-P6T2-P6T2-1 | Human | Lung | IAC | 4.48e-63 | 1.44e+00 | -0.0166 |
| 93664 | CADPS2 | RNA-P6T2-P6T2-2 | Human | Lung | IAC | 3.75e-61 | 1.40e+00 | -0.0132 |
| 93664 | CADPS2 | RNA-P6T2-P6T2-3 | Human | Lung | IAC | 1.46e-66 | 1.43e+00 | -0.013 |
| 93664 | CADPS2 | RNA-P6T2-P6T2-4 | Human | Lung | IAC | 1.42e-57 | 1.37e+00 | -0.0121 |
| 93664 | CADPS2 | RNA-P7T1-P7T1-1 | Human | Lung | AIS | 3.85e-13 | 1.24e+00 | -0.0961 |
| 93664 | CADPS2 | RNA-P7T1-P7T1-2 | Human | Lung | AIS | 3.01e-15 | 1.23e+00 | -0.0876 |
| Page: 1 2 3 4 5 |
| Tissue | Expression Dynamics | Abbreviation |
| Cervix | 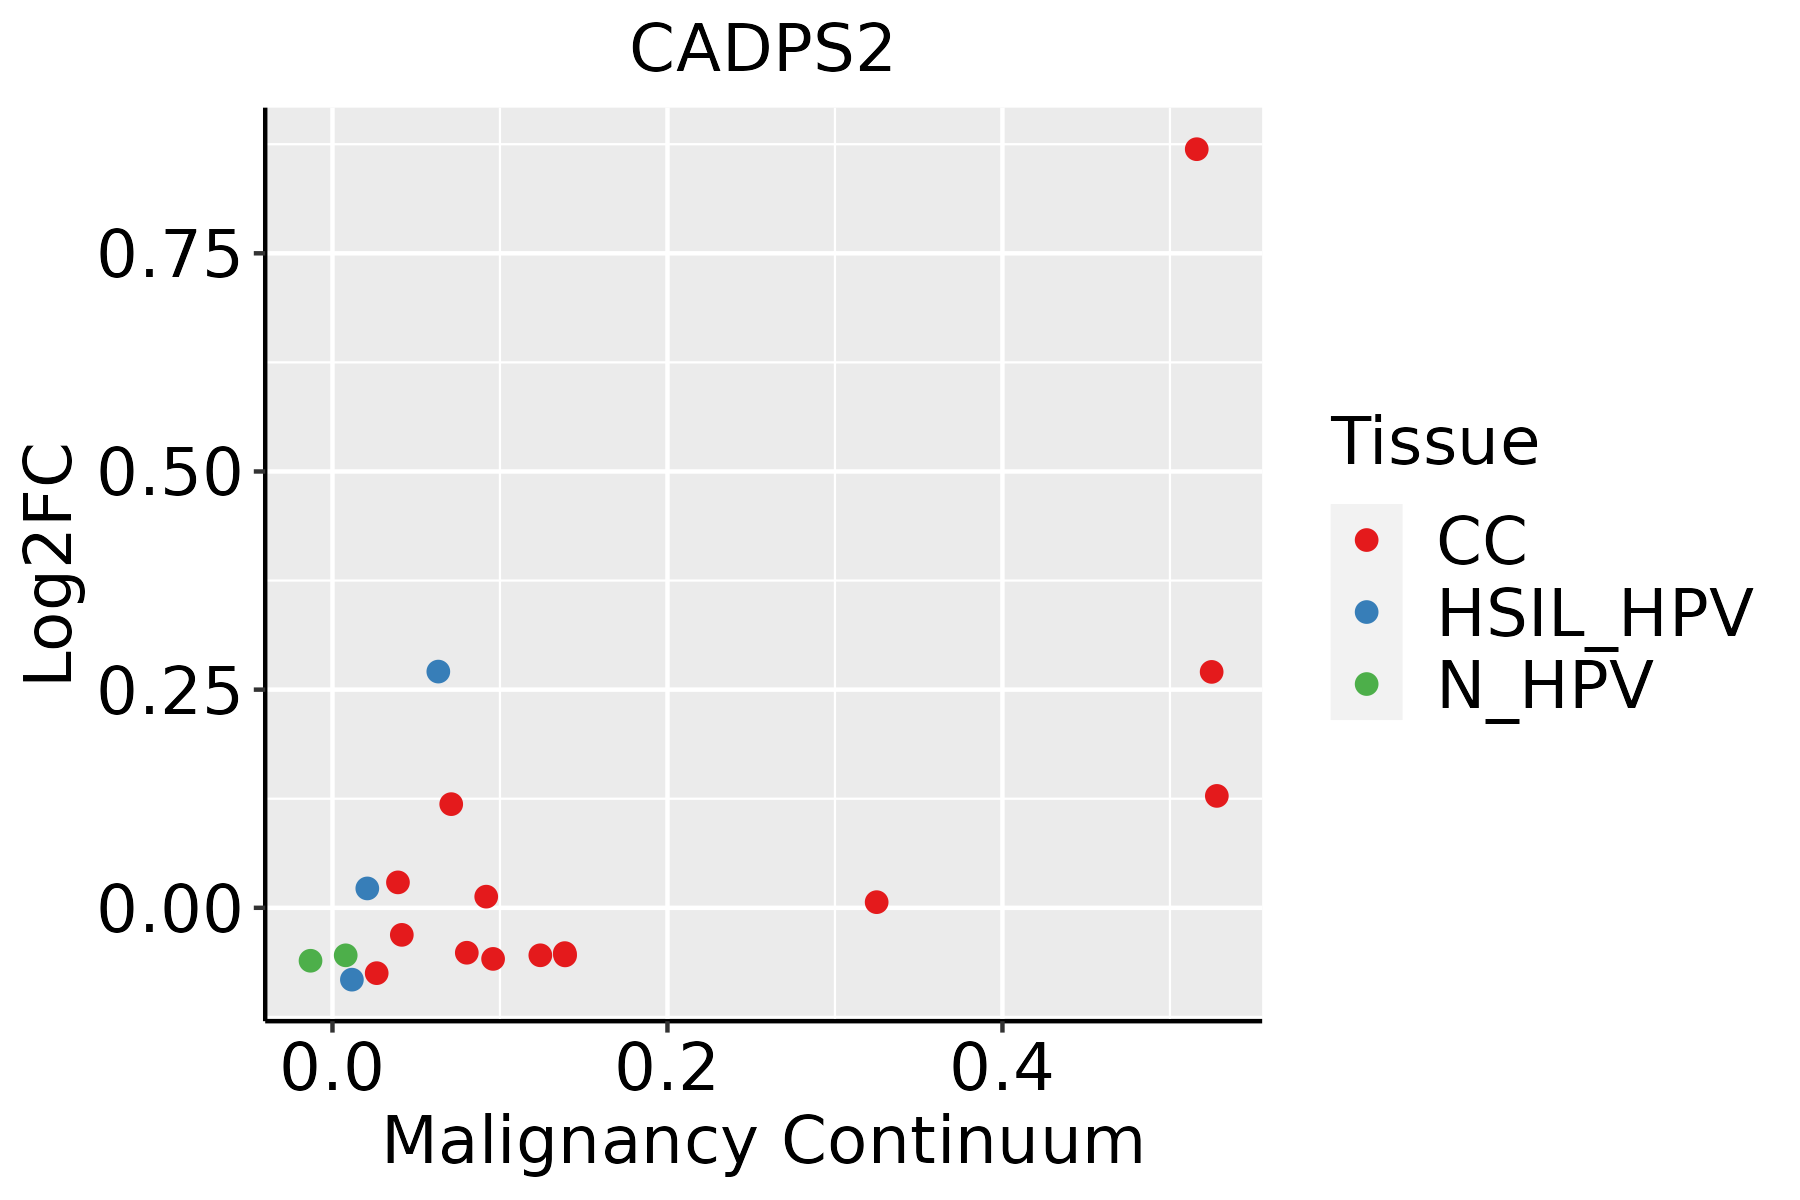 | CC: Cervix cancer |
| HSIL_HPV: HPV-infected high-grade squamous intraepithelial lesions | ||
| N_HPV: HPV-infected normal cervix | ||
| Colorectum (GSE201348) |  | FAP: Familial adenomatous polyposis |
| CRC: Colorectal cancer | ||
| Colorectum (HTA11) |  | AD: Adenomas |
| SER: Sessile serrated lesions | ||
| MSI-H: Microsatellite-high colorectal cancer | ||
| MSS: Microsatellite stable colorectal cancer | ||
| Endometrium | 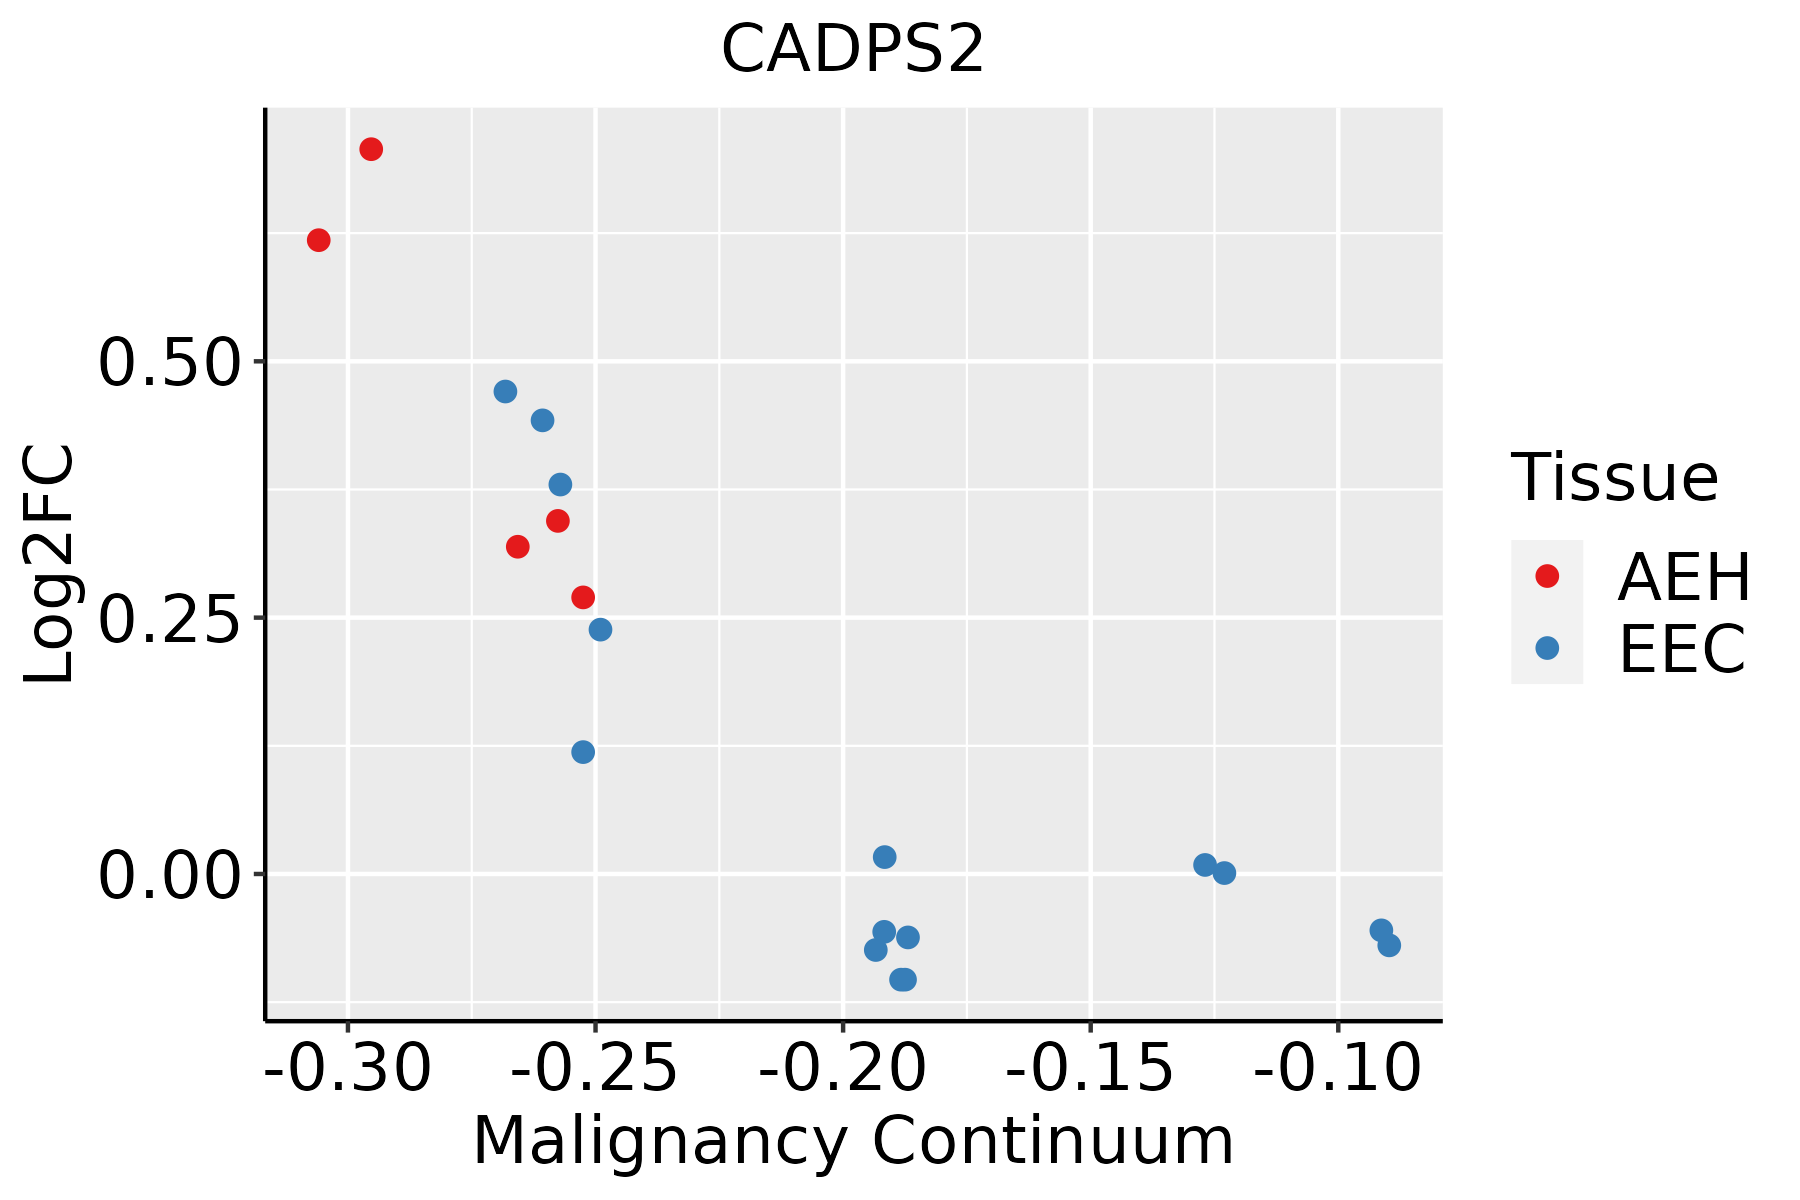 | AEH: Atypical endometrial hyperplasia |
| EEC: Endometrioid Cancer | ||
| Liver | 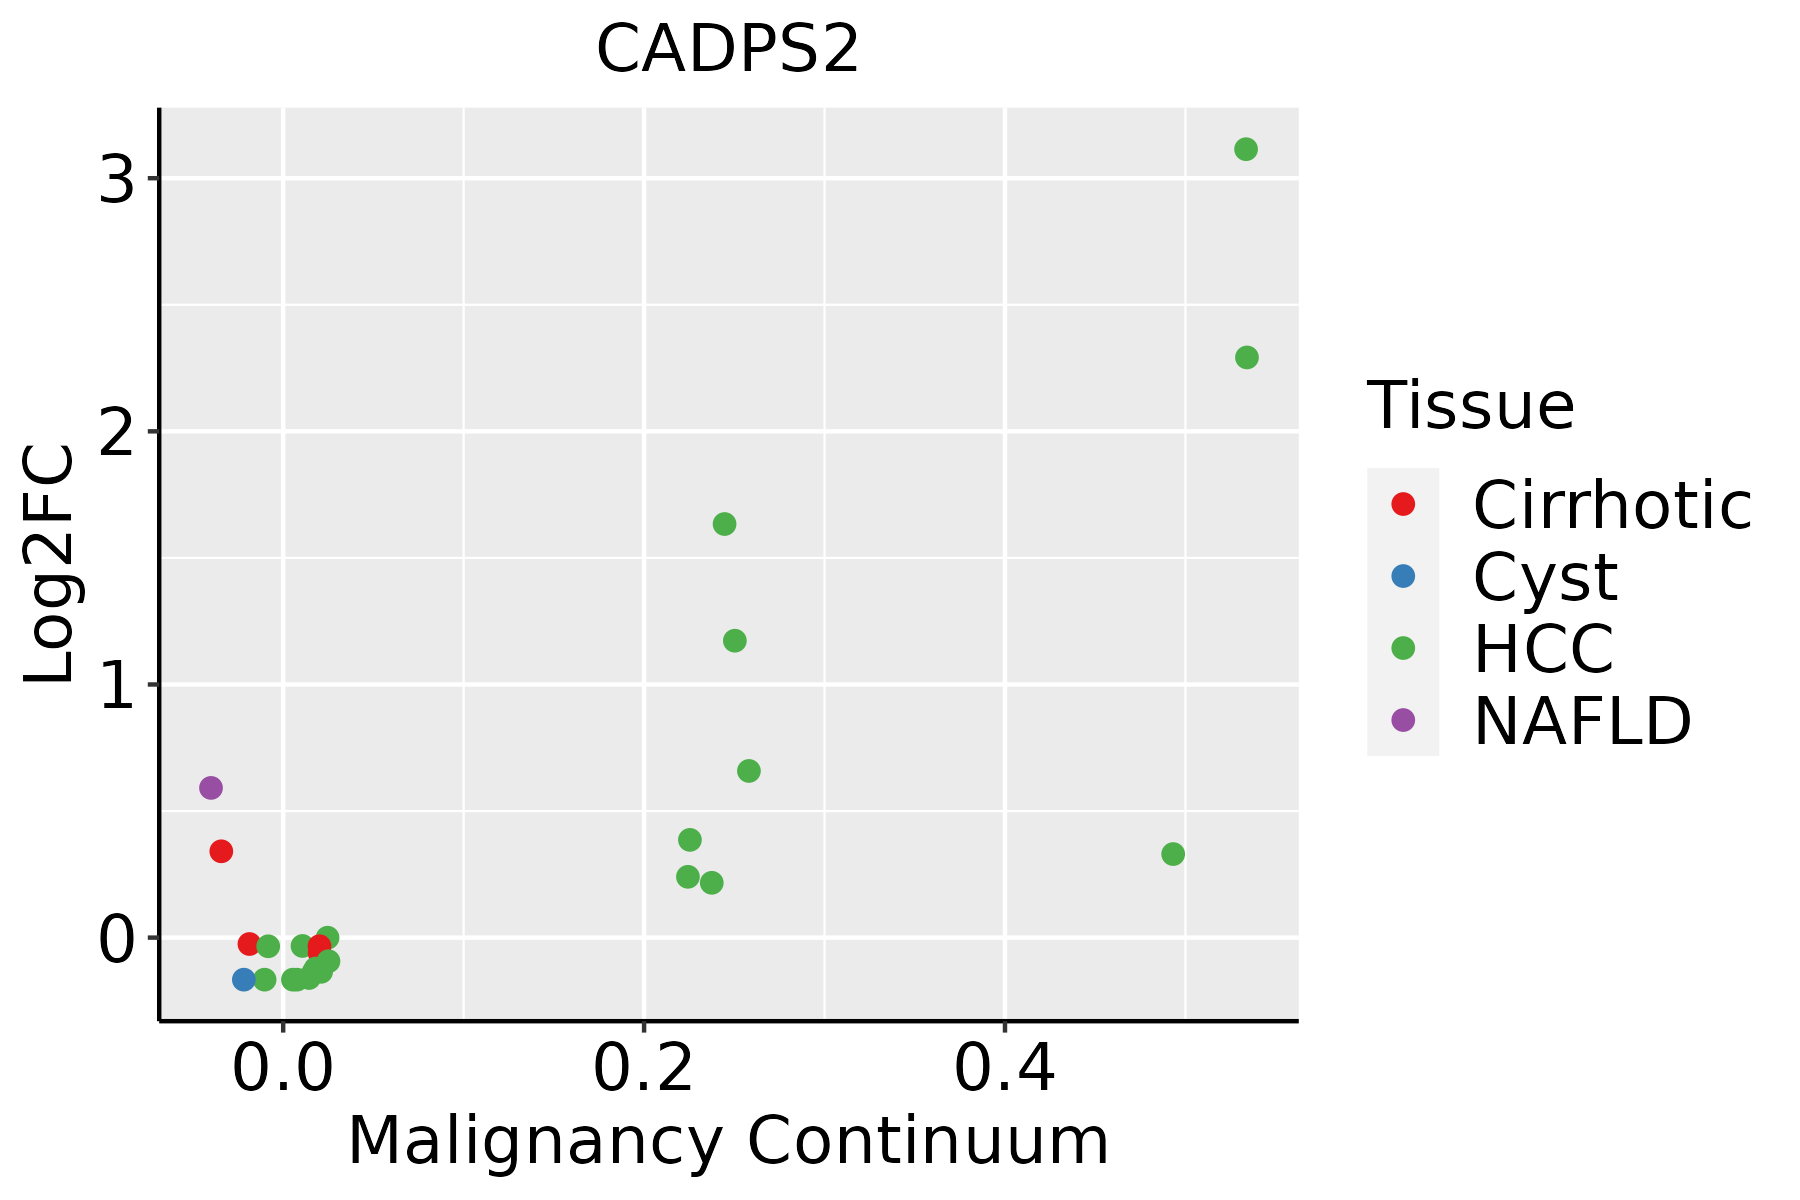 | HCC: Hepatocellular carcinoma |
| NAFLD: Non-alcoholic fatty liver disease | ||
| Lung | 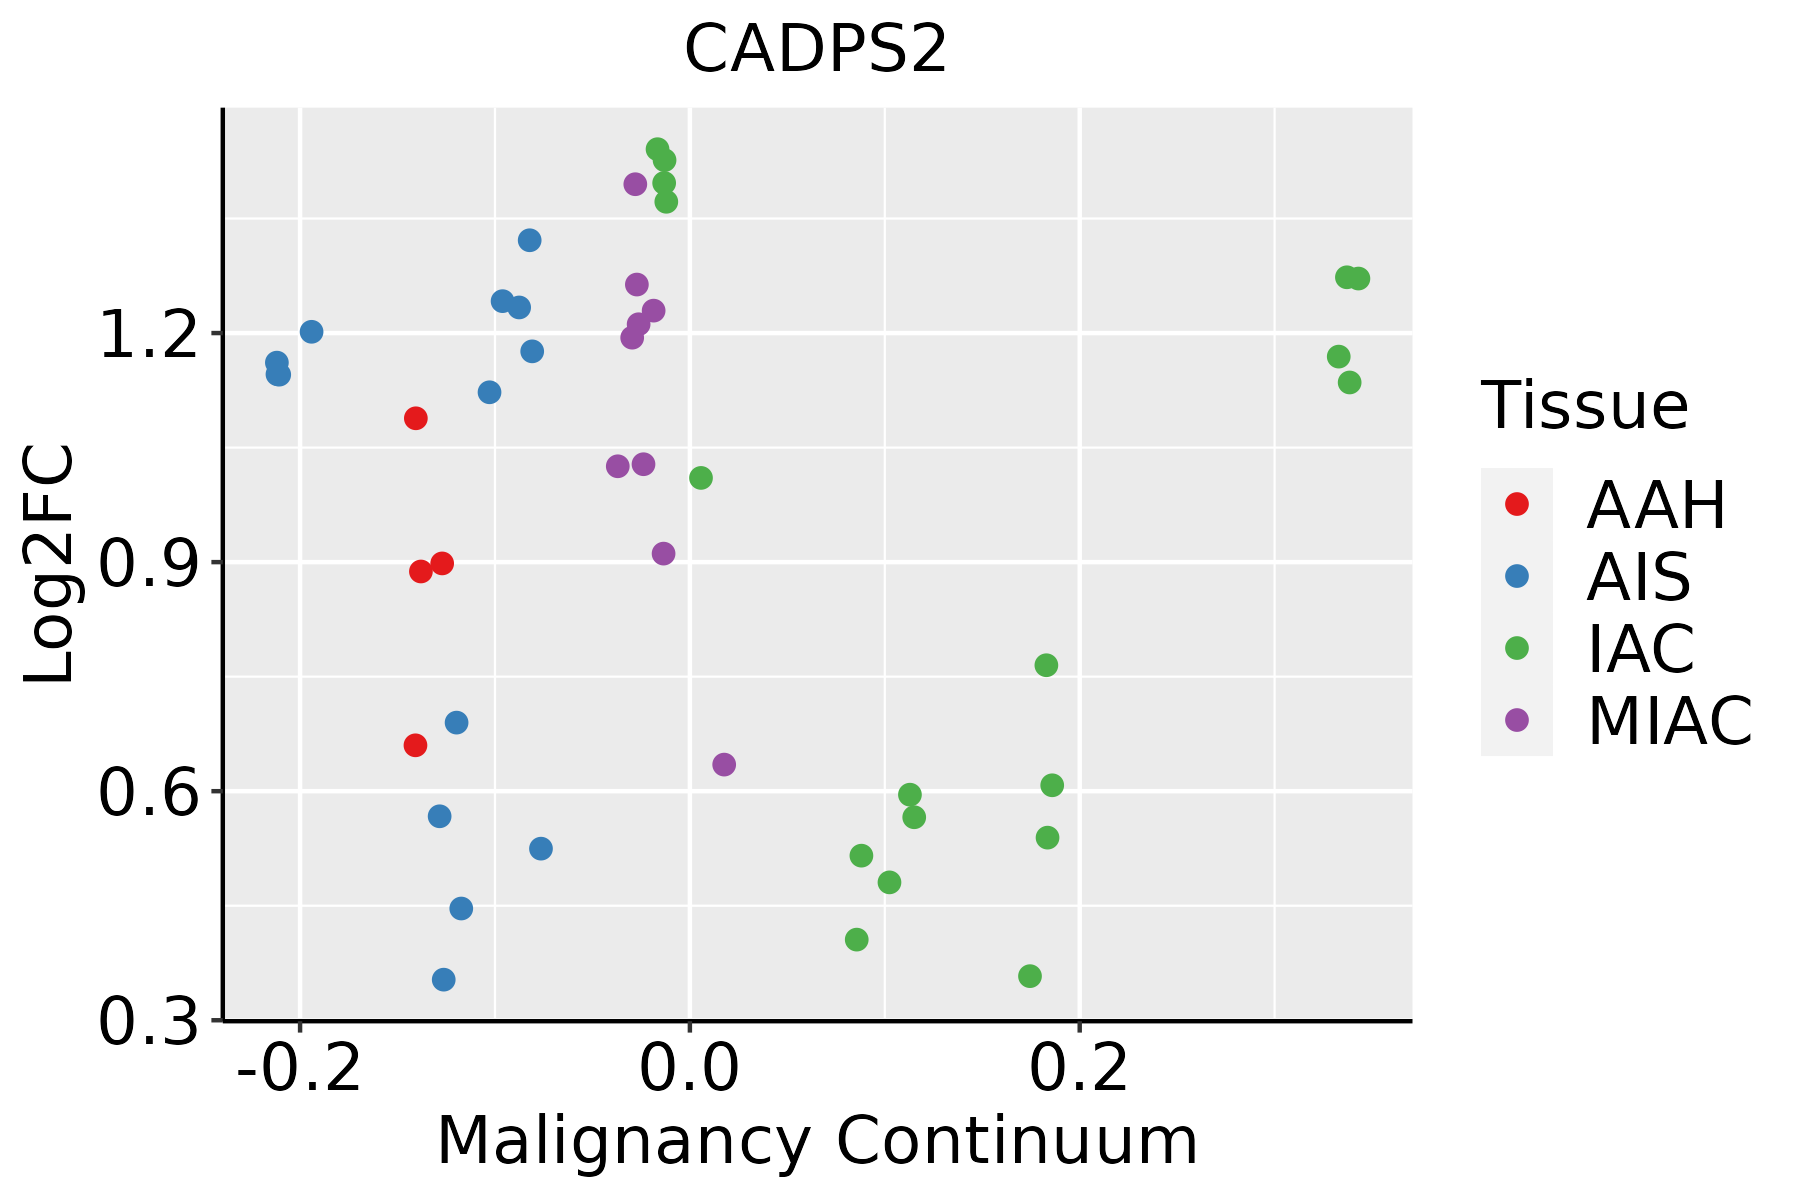 | AAH: Atypical adenomatous hyperplasia |
| AIS: Adenocarcinoma in situ | ||
| IAC: Invasive lung adenocarcinoma | ||
| MIA: Minimally invasive adenocarcinoma | ||
| Prostate |  | BPH: Benign Prostatic Hyperplasia |
| ∗log2FC in expression of this searched gene in stem-like cells from each diseased tissue sample relative to stem-like cells in normal samples in each tissue plotted against the malignancy continuum. Samples are colored based on if they are from different disease stage. |
Top |
Malignant transformation related pathway analysis |
| Find out the enriched GO biological processes and KEGG pathways involved in transition from healthy to precancer to cancer |
| Tissue | Disease Stage | Enriched GO biological Processes |
| Colorectum | AD |  |
| Colorectum | SER |  |
| Colorectum | MSS |  |
| Colorectum | MSI-H |  |
| Colorectum | FAP |  |
| ∗Top 15 enriched GO BP terms are showed in the bar plot of each disease state in each tissue. Each row represents a significant GO biological process which is colored according to the -log10(p.adjust). |
| Page: 1 2 3 4 5 6 7 8 9 |
| GO ID | Tissue | Disease Stage | Description | Gene Ratio | Bg Ratio | pvalue | p.adjust | Count |
| GO:00171574 | Cervix | CC | regulation of exocytosis | 39/2311 | 202/18723 | 2.90e-03 | 1.93e-02 | 39 |
| GO:00068873 | Cervix | CC | exocytosis | 59/2311 | 352/18723 | 8.74e-03 | 4.48e-02 | 59 |
| GO:0045921 | Colorectum | AD | positive regulation of exocytosis | 33/3918 | 86/18723 | 1.58e-04 | 2.20e-03 | 33 |
| GO:0051047 | Colorectum | AD | positive regulation of secretion | 90/3918 | 310/18723 | 4.11e-04 | 4.66e-03 | 90 |
| GO:1903532 | Colorectum | AD | positive regulation of secretion by cell | 82/3918 | 282/18723 | 6.85e-04 | 7.00e-03 | 82 |
| GO:0006887 | Colorectum | AD | exocytosis | 96/3918 | 352/18723 | 2.48e-03 | 1.90e-02 | 96 |
| GO:0017157 | Colorectum | AD | regulation of exocytosis | 59/3918 | 202/18723 | 3.20e-03 | 2.36e-02 | 59 |
| GO:0099003 | Colorectum | AD | vesicle-mediated transport in synapse | 57/3918 | 200/18723 | 6.53e-03 | 4.06e-02 | 57 |
| GO:00459211 | Colorectum | SER | positive regulation of exocytosis | 25/2897 | 86/18723 | 9.88e-04 | 1.17e-02 | 25 |
| GO:00068871 | Colorectum | SER | exocytosis | 75/2897 | 352/18723 | 2.05e-03 | 2.03e-02 | 75 |
| GO:00510471 | Colorectum | SER | positive regulation of secretion | 65/2897 | 310/18723 | 5.71e-03 | 4.19e-02 | 65 |
| GO:00171571 | Colorectum | SER | regulation of exocytosis | 45/2897 | 202/18723 | 6.46e-03 | 4.63e-02 | 45 |
| GO:19035321 | Colorectum | MSS | positive regulation of secretion by cell | 74/3467 | 282/18723 | 7.93e-04 | 8.36e-03 | 74 |
| GO:00510472 | Colorectum | MSS | positive regulation of secretion | 80/3467 | 310/18723 | 8.55e-04 | 8.75e-03 | 80 |
| GO:00990031 | Colorectum | MSS | vesicle-mediated transport in synapse | 54/3467 | 200/18723 | 1.94e-03 | 1.67e-02 | 54 |
| GO:00459212 | Colorectum | MSS | positive regulation of exocytosis | 27/3467 | 86/18723 | 2.76e-03 | 2.17e-02 | 27 |
| GO:0099504 | Colorectum | MSS | synaptic vesicle cycle | 48/3467 | 181/18723 | 4.85e-03 | 3.39e-02 | 48 |
| GO:00990032 | Colorectum | FAP | vesicle-mediated transport in synapse | 51/2622 | 200/18723 | 1.09e-05 | 3.08e-04 | 51 |
| GO:00995041 | Colorectum | FAP | synaptic vesicle cycle | 45/2622 | 181/18723 | 6.73e-05 | 1.28e-03 | 45 |
| GO:0023061 | Colorectum | FAP | signal release | 94/2622 | 463/18723 | 1.06e-04 | 1.76e-03 | 94 |
| Page: 1 2 |
| Pathway ID | Tissue | Disease Stage | Description | Gene Ratio | Bg Ratio | pvalue | p.adjust | qvalue | Count |
| Page: 1 |
Top |
Cell-cell communication analysis |
| Identification of potential cell-cell interactions between two cell types and their ligand-receptor pairs for different disease states |
| Ligand | Receptor | LRpair | Pathway | Tissue | Disease Stage |
| Page: 1 |
Top |
Single-cell gene regulatory network inference analysis |
| Find out the significant the regulons (TFs) and the target genes of each regulon across cell types for different disease states |
| TF | Cell Type | Tissue | Disease Stage | Target Gene | RSS | Regulon Activity |
| ∗The dot plots of a searched regulon are shown for all cell subpopulations in each disease state of each tissue based on the regulon specific score inferred using pySCENIC and by calculating the average expression. |
| Page: 1 |
Top |
Somatic mutation of malignant transformation related genes |
| Annotation of somatic variants for genes involved in malignant transformation |
| Hugo Symbol | Variant Class | Variant Classification | dbSNP RS | HGVSc | HGVSp | HGVSp Short | SWISSPROT | BIOTYPE | SIFT | PolyPhen | Tumor Sample Barcode | Tissue | Histology | Sex | Age | Stage | Therapy Types | Drugs | Outcome |
| CADPS2 | SNV | Missense_Mutation | novel | c.582N>C | p.Leu194Phe | p.L194F | Q86UW7 | protein_coding | deleterious(0) | probably_damaging(0.994) | TCGA-5L-AAT1-01 | Breast | breast invasive carcinoma | Female | <65 | III/IV | Hormone Therapy | letrozol | SD |
| CADPS2 | SNV | Missense_Mutation | novel | c.676N>A | p.Leu226Ile | p.L226I | Q86UW7 | protein_coding | tolerated(0.42) | benign(0.388) | TCGA-A2-A25A-01 | Breast | breast invasive carcinoma | Female | <65 | I/II | Unspecific | Cytoxan | SD |
| CADPS2 | SNV | Missense_Mutation | c.2339N>T | p.Ser780Leu | p.S780L | Q86UW7 | protein_coding | deleterious(0.03) | possibly_damaging(0.454) | TCGA-AC-A23H-01 | Breast | breast invasive carcinoma | Female | >=65 | I/II | Unknown | Unknown | PD | |
| CADPS2 | SNV | Missense_Mutation | novel | c.2371G>T | p.Ala791Ser | p.A791S | Q86UW7 | protein_coding | tolerated(0.35) | benign(0.15) | TCGA-AC-A3W5-01 | Breast | breast invasive carcinoma | Female | >=65 | I/II | Chemotherapy | docetaxel | CR |
| CADPS2 | SNV | Missense_Mutation | novel | c.3880N>A | p.Glu1294Lys | p.E1294K | Q86UW7 | protein_coding | tolerated_low_confidence(0.06) | benign(0.067) | TCGA-AC-A5XS-01 | Breast | breast invasive carcinoma | Female | >=65 | I/II | Hormone Therapy | femara | SD |
| CADPS2 | SNV | Missense_Mutation | novel | c.1039N>C | p.Asp347His | p.D347H | Q86UW7 | protein_coding | deleterious(0) | probably_damaging(0.997) | TCGA-AC-A6IW-01 | Breast | breast invasive carcinoma | Female | >=65 | I/II | Unknown | Unknown | SD |
| CADPS2 | SNV | Missense_Mutation | novel | c.1151G>A | p.Arg384Gln | p.R384Q | Q86UW7 | protein_coding | deleterious(0) | probably_damaging(0.978) | TCGA-AN-A046-01 | Breast | breast invasive carcinoma | Female | >=65 | I/II | Unknown | Unknown | SD |
| CADPS2 | SNV | Missense_Mutation | c.1522N>T | p.Arg508Cys | p.R508C | Q86UW7 | protein_coding | deleterious(0) | probably_damaging(0.997) | TCGA-BH-A0AV-01 | Breast | breast invasive carcinoma | Female | <65 | I/II | Chemotherapy | taxotere | CR | |
| CADPS2 | SNV | Missense_Mutation | c.1885G>C | p.Gly629Arg | p.G629R | Q86UW7 | protein_coding | deleterious(0) | possibly_damaging(0.67) | TCGA-BH-A0BP-01 | Breast | breast invasive carcinoma | Female | >=65 | I/II | Unknown | Unknown | SD | |
| CADPS2 | SNV | Missense_Mutation | c.769N>T | p.Leu257Phe | p.L257F | Q86UW7 | protein_coding | deleterious(0) | possibly_damaging(0.476) | TCGA-E2-A14P-01 | Breast | breast invasive carcinoma | Female | >=65 | III/IV | Targeted Molecular therapy | trastuzumab | SD |
| Page: 1 2 3 4 5 6 7 8 9 10 11 12 13 14 |
Top |
Related drugs of malignant transformation related genes |
| Identification of chemicals and drugs interact with genes involved in malignant transfromation |
| (DGIdb 4.0) |
| Entrez ID | Symbol | Category | Interaction Types | Drug Claim Name | Drug Name | PMIDs |
| Page: 1 |

Copyright 2023-Present -The University of Texas Health Science Center at Houston |