
|
|||||
|
 | |
| |
| |
| |
| |
| |
|
Gene: C9orf85 |
Gene summary for C9ORF85 |
| Gene information | Species | Human | Gene symbol | C9orf85 | Gene ID | 138241 |
| Gene name | chromosome 9 open reading frame 85 | |
| Gene Alias | C9orf85 | |
| Cytomap | 9q21.13 | |
| Gene Type | protein-coding | GO ID | NA | UniProtAcc | Q96MD7 |
Top |
Malignant transformation analysis |
| Identification of the aberrant gene expression in precancerous and cancerous lesions by comparing the gene expression of stem-like cells in diseased tissues with normal stem cells |
| Entrez ID | Symbol | Replicates | Species | Organ | Tissue | Adj P-value | Log2FC | Malignancy |
| 138241 | C9orf85 | P130T-E | Human | Esophagus | ESCC | 1.94e-23 | 4.13e-01 | 0.1676 |
| 138241 | C9orf85 | NAFLD1 | Human | Liver | NAFLD | 1.43e-09 | 5.34e-01 | -0.04 |
| 138241 | C9orf85 | S43 | Human | Liver | Cirrhotic | 3.96e-03 | -1.37e-01 | -0.0187 |
| 138241 | C9orf85 | HCC1_Meng | Human | Liver | HCC | 8.58e-51 | 6.29e-03 | 0.0246 |
| 138241 | C9orf85 | HCC2_Meng | Human | Liver | HCC | 7.18e-07 | -6.44e-02 | 0.0107 |
| 138241 | C9orf85 | HCC2 | Human | Liver | HCC | 1.10e-08 | 1.13e+00 | 0.5341 |
| 138241 | C9orf85 | HCC5 | Human | Liver | HCC | 3.52e-03 | 6.51e-01 | 0.4932 |
| 138241 | C9orf85 | S014 | Human | Liver | HCC | 2.40e-04 | 1.25e-01 | 0.2254 |
| 138241 | C9orf85 | S028 | Human | Liver | HCC | 2.46e-03 | 1.63e-01 | 0.2503 |
| 138241 | C9orf85 | S029 | Human | Liver | HCC | 1.55e-02 | 2.56e-01 | 0.2581 |
| 138241 | C9orf85 | C04 | Human | Oral cavity | OSCC | 2.68e-07 | 4.71e-01 | 0.2633 |
| 138241 | C9orf85 | C21 | Human | Oral cavity | OSCC | 4.28e-20 | 5.34e-01 | 0.2678 |
| 138241 | C9orf85 | C30 | Human | Oral cavity | OSCC | 1.16e-26 | 1.10e+00 | 0.3055 |
| 138241 | C9orf85 | C38 | Human | Oral cavity | OSCC | 3.59e-02 | 4.04e-01 | 0.172 |
| 138241 | C9orf85 | C43 | Human | Oral cavity | OSCC | 1.19e-05 | 3.41e-01 | 0.1704 |
| 138241 | C9orf85 | C46 | Human | Oral cavity | OSCC | 2.27e-12 | 3.78e-01 | 0.1673 |
| 138241 | C9orf85 | C51 | Human | Oral cavity | OSCC | 2.48e-05 | 3.34e-01 | 0.2674 |
| 138241 | C9orf85 | C57 | Human | Oral cavity | OSCC | 2.23e-07 | 2.95e-01 | 0.1679 |
| 138241 | C9orf85 | C06 | Human | Oral cavity | OSCC | 8.54e-03 | 6.15e-01 | 0.2699 |
| 138241 | C9orf85 | SYSMH1 | Human | Oral cavity | OSCC | 3.34e-09 | 3.47e-01 | 0.1127 |
| Page: 1 2 3 4 5 |
| Tissue | Expression Dynamics | Abbreviation |
| Esophagus | 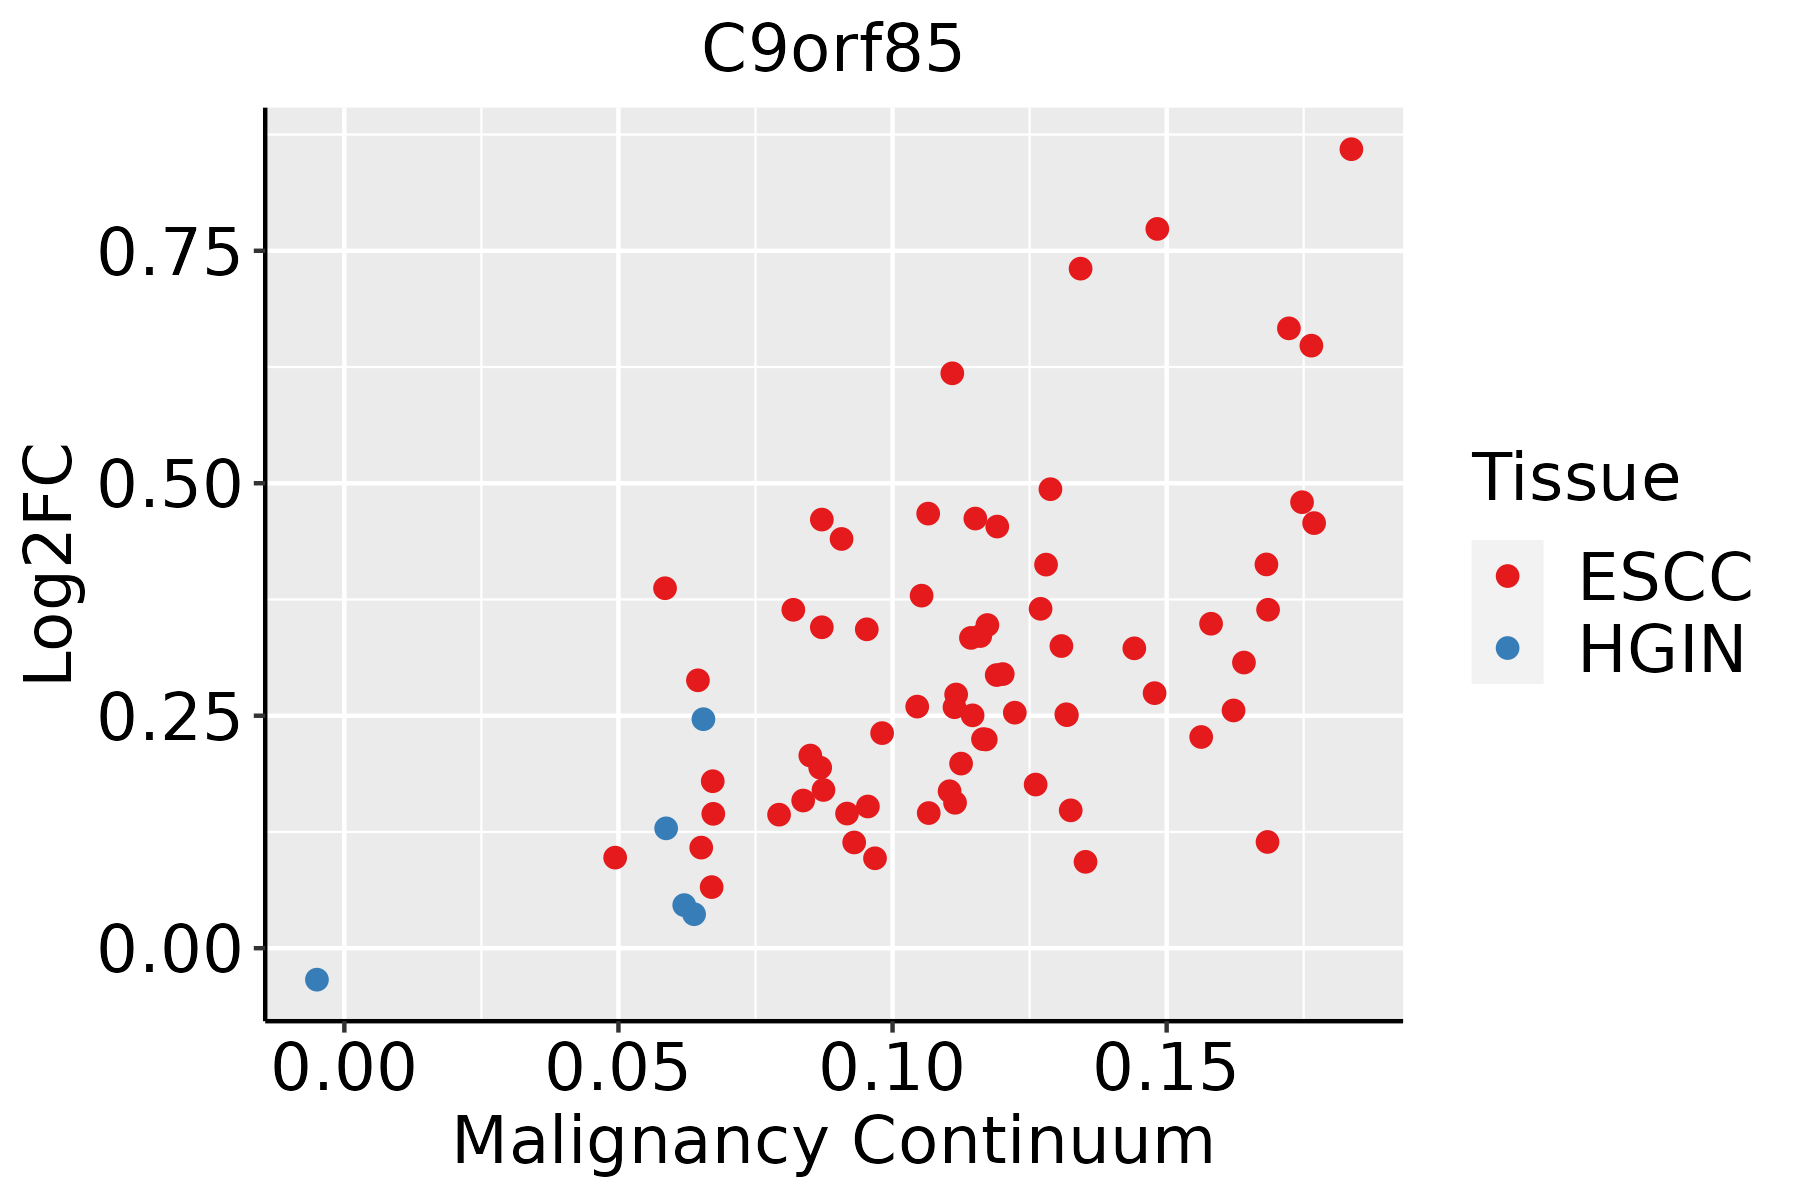 | ESCC: Esophageal squamous cell carcinoma |
| HGIN: High-grade intraepithelial neoplasias | ||
| LGIN: Low-grade intraepithelial neoplasias | ||
| Liver | 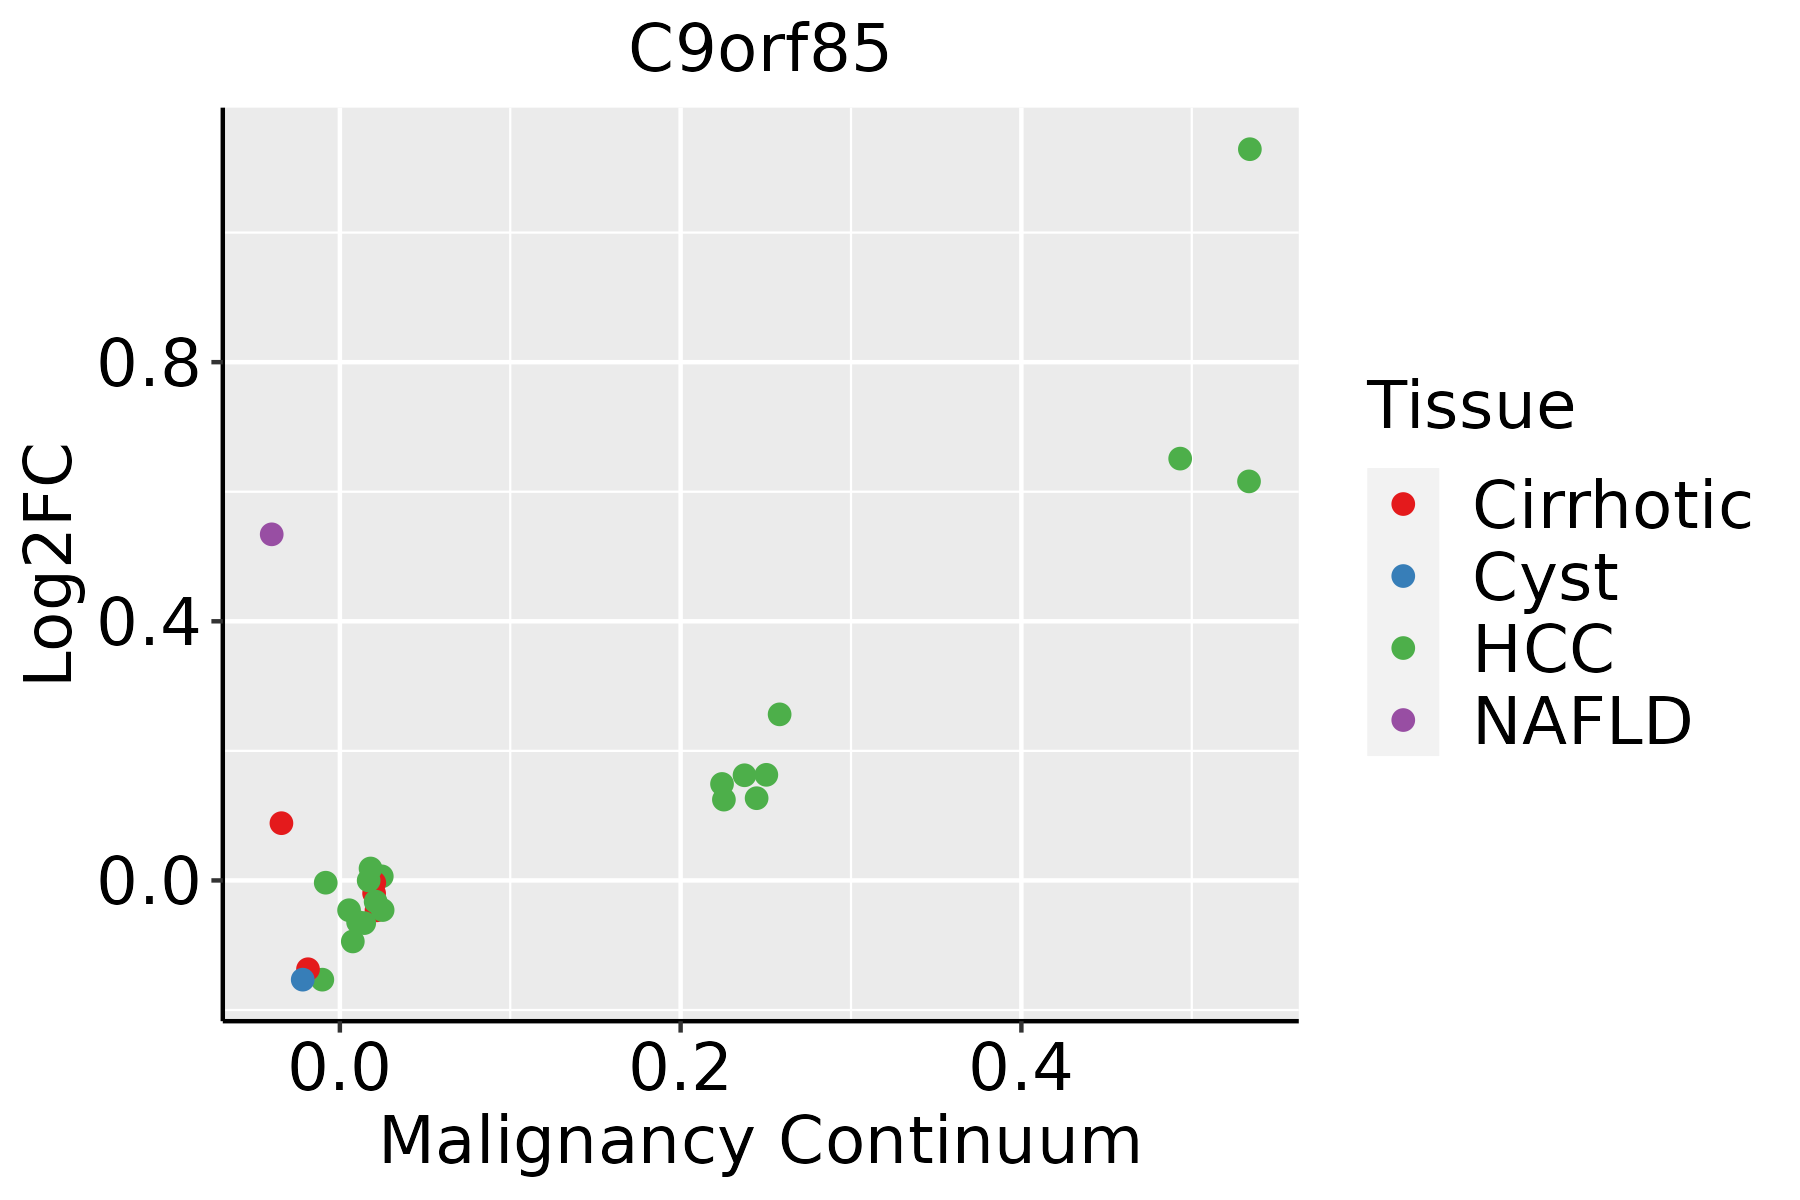 | HCC: Hepatocellular carcinoma |
| NAFLD: Non-alcoholic fatty liver disease | ||
| Oral Cavity | 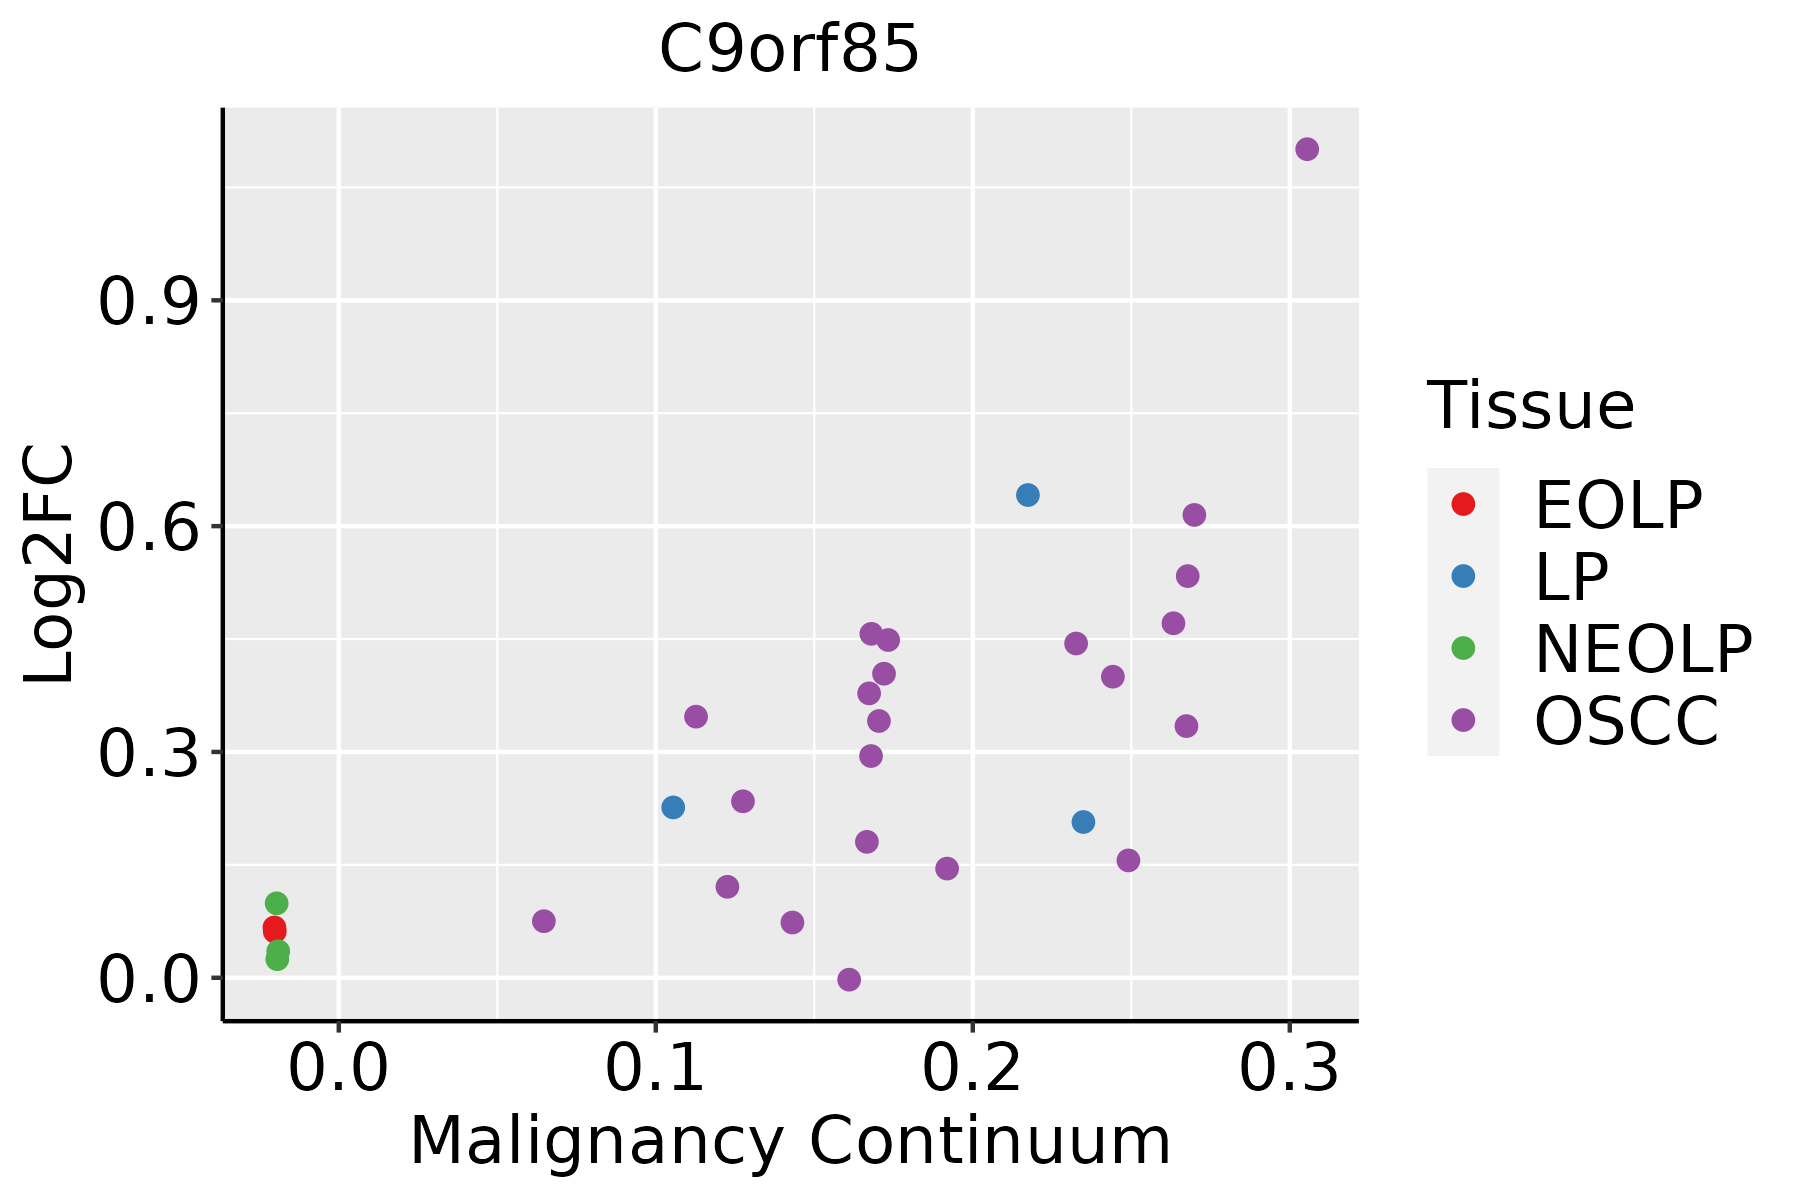 | EOLP: Erosive Oral lichen planus |
| LP: leukoplakia | ||
| NEOLP: Non-erosive oral lichen planus | ||
| OSCC: Oral squamous cell carcinoma | ||
| Skin | 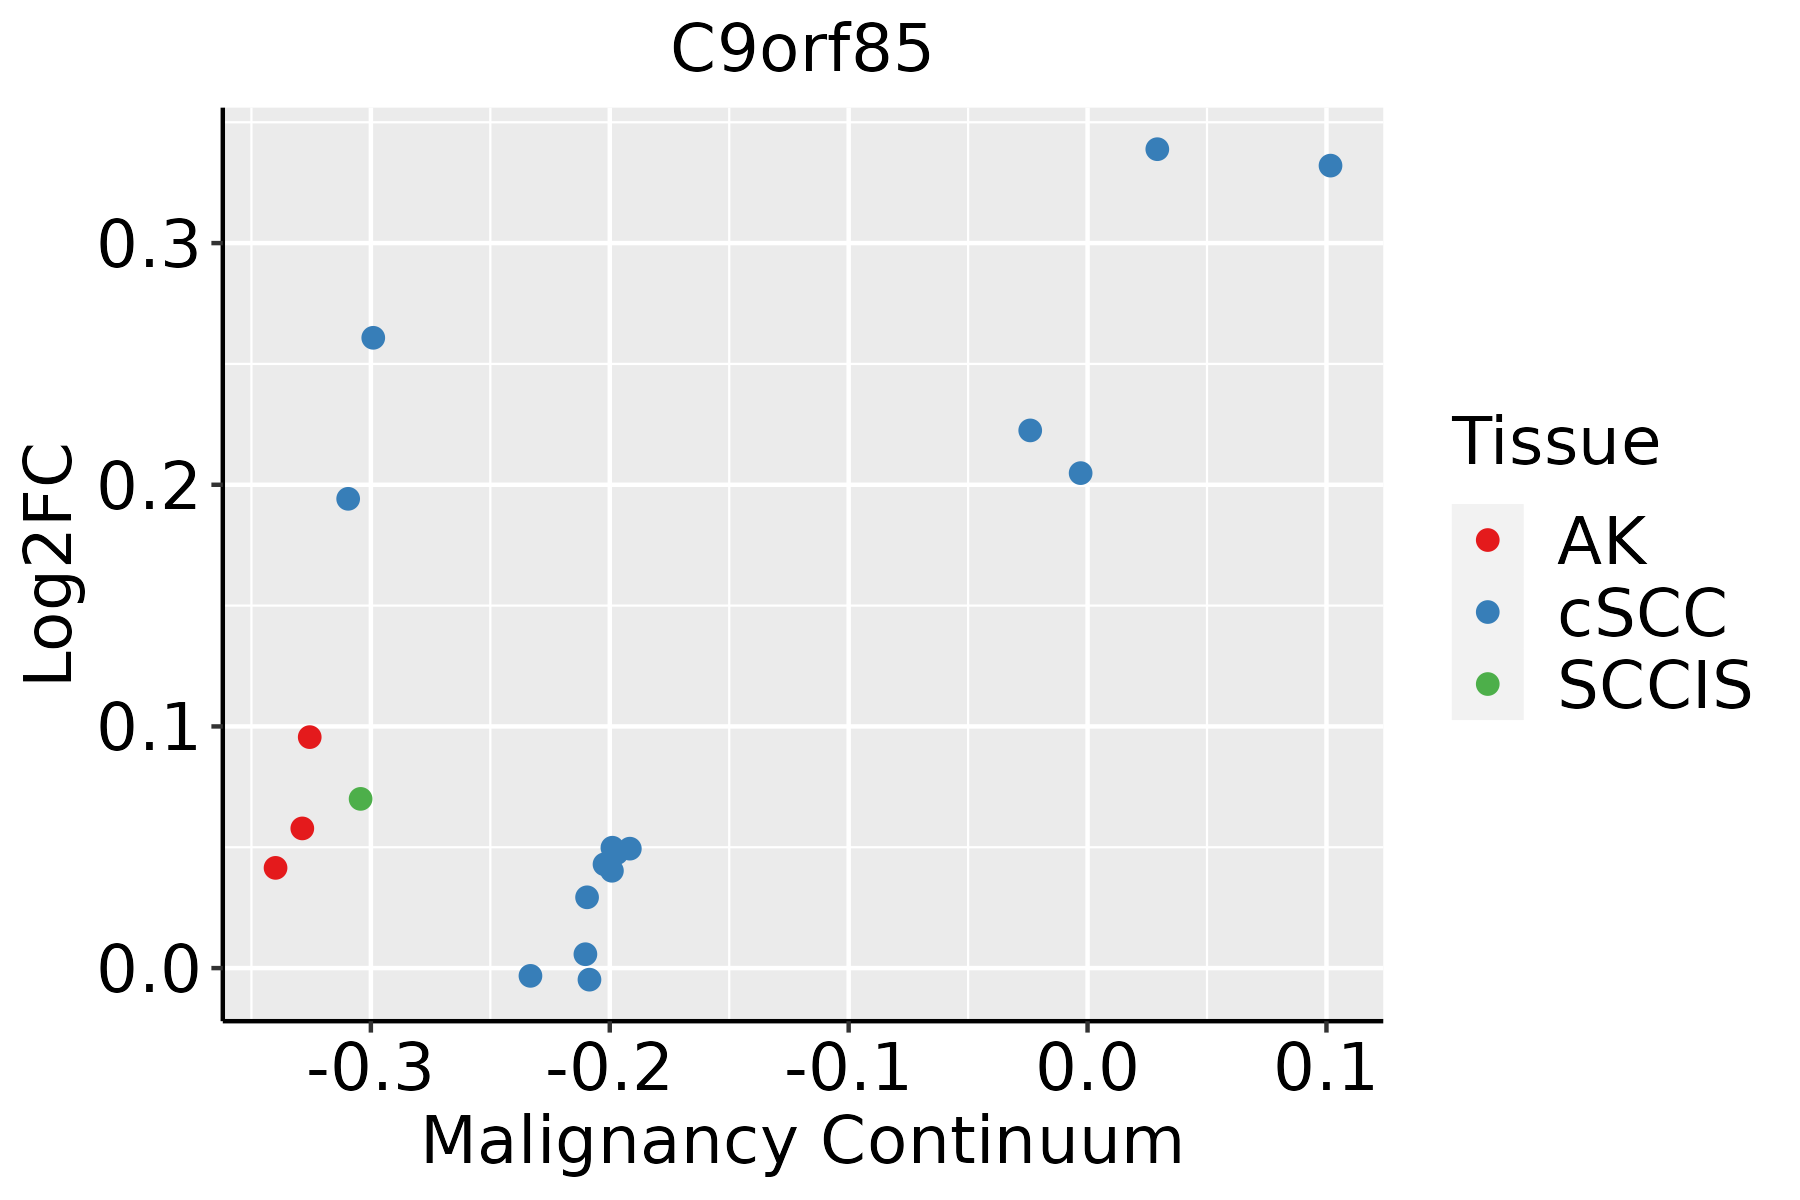 | AK: Actinic keratosis |
| cSCC: Cutaneous squamous cell carcinoma | ||
| SCCIS:squamous cell carcinoma in situ |
| ∗log2FC in expression of this searched gene in stem-like cells from each diseased tissue sample relative to stem-like cells in normal samples in each tissue plotted against the malignancy continuum. Samples are colored based on if they are from different disease stage. |
Top |
Malignant transformation related pathway analysis |
| Find out the enriched GO biological processes and KEGG pathways involved in transition from healthy to precancer to cancer |
| Tissue | Disease Stage | Enriched GO biological Processes |
| Colorectum | AD |  |
| Colorectum | SER |  |
| Colorectum | MSS |  |
| Colorectum | MSI-H |  |
| Colorectum | FAP |  |
| ∗Top 15 enriched GO BP terms are showed in the bar plot of each disease state in each tissue. Each row represents a significant GO biological process which is colored according to the -log10(p.adjust). |
| Page: 1 2 3 4 5 6 7 8 9 |
| GO ID | Tissue | Disease Stage | Description | Gene Ratio | Bg Ratio | pvalue | p.adjust | Count |
| Page: 1 |
| Pathway ID | Tissue | Disease Stage | Description | Gene Ratio | Bg Ratio | pvalue | p.adjust | qvalue | Count |
| Page: 1 |
Top |
Cell-cell communication analysis |
| Identification of potential cell-cell interactions between two cell types and their ligand-receptor pairs for different disease states |
| Ligand | Receptor | LRpair | Pathway | Tissue | Disease Stage |
| Page: 1 |
Top |
Single-cell gene regulatory network inference analysis |
| Find out the significant the regulons (TFs) and the target genes of each regulon across cell types for different disease states |
| TF | Cell Type | Tissue | Disease Stage | Target Gene | RSS | Regulon Activity |
| ∗The dot plots of a searched regulon are shown for all cell subpopulations in each disease state of each tissue based on the regulon specific score inferred using pySCENIC and by calculating the average expression. |
| Page: 1 |
Top |
Somatic mutation of malignant transformation related genes |
| Annotation of somatic variants for genes involved in malignant transformation |
| Hugo Symbol | Variant Class | Variant Classification | dbSNP RS | HGVSc | HGVSp | HGVSp Short | SWISSPROT | BIOTYPE | SIFT | PolyPhen | Tumor Sample Barcode | Tissue | Histology | Sex | Age | Stage | Therapy Types | Drugs | Outcome |
| C9orf85 | SNV | Missense_Mutation | novel | c.207N>C | p.Lys69Asn | p.K69N | Q96MD7 | protein_coding | deleterious(0) | probably_damaging(0.943) | TCGA-A2-A4S1-01 | Breast | breast invasive carcinoma | Female | >=65 | I/II | Unknown | Unknown | SD |
| C9orf85 | SNV | Missense_Mutation | rs373529335 | c.406N>A | p.Glu136Lys | p.E136K | Q96MD7 | protein_coding | tolerated(0.3) | benign(0.001) | TCGA-VS-A953-01 | Cervix | cervical & endocervical cancer | Female | <65 | I/II | Unknown | Unknown | PD |
| C9orf85 | deletion | Frame_Shift_Del | novel | c.341delN | p.Ile116Ter | p.I116* | Q96MD7 | protein_coding | TCGA-EA-A3HU-01 | Cervix | cervical & endocervical cancer | Female | <65 | I/II | Unknown | Unknown | SD | ||
| C9orf85 | SNV | Missense_Mutation | c.119N>G | p.Leu40Arg | p.L40R | Q96MD7 | protein_coding | tolerated(0.31) | possibly_damaging(0.748) | TCGA-A6-6141-01 | Colorectum | colon adenocarcinoma | Male | <65 | I/II | Chemotherapy | 5-fu | SD | |
| C9orf85 | SNV | Missense_Mutation | c.19N>G | p.Asn7Asp | p.N7D | Q96MD7 | protein_coding | deleterious(0) | probably_damaging(0.997) | TCGA-AA-3672-01 | Colorectum | colon adenocarcinoma | Female | >=65 | III/IV | Unknown | Unknown | SD | |
| C9orf85 | SNV | Missense_Mutation | novel | c.56C>T | p.Thr19Met | p.T19M | Q96MD7 | protein_coding | deleterious(0.03) | benign(0.08) | TCGA-B5-A3FA-01 | Endometrium | uterine corpus endometrioid carcinoma | Female | >=65 | I/II | Unknown | Unknown | SD |
| C9orf85 | SNV | Missense_Mutation | novel | c.280N>C | p.Glu94Gln | p.E94Q | Q96MD7 | protein_coding | tolerated(0.05) | possibly_damaging(0.572) | TCGA-B5-A3S1-01 | Endometrium | uterine corpus endometrioid carcinoma | Female | >=65 | III/IV | Chemotherapy | paclitaxel | SD |
| C9orf85 | SNV | Missense_Mutation | novel | c.377N>G | p.Asn126Ser | p.N126S | Q96MD7 | protein_coding | tolerated(0.72) | benign(0.003) | TCGA-DI-A1BU-01 | Endometrium | uterine corpus endometrioid carcinoma | Female | <65 | I/II | Chemotherapy | paclitaxel | SD |
| C9orf85 | insertion | Frame_Shift_Ins | novel | c.340_341insA | p.Ile116AsnfsTer5 | p.I116Nfs*5 | Q96MD7 | protein_coding | TCGA-B5-A1MX-01 | Endometrium | uterine corpus endometrioid carcinoma | Female | <65 | I/II | Hormone Therapy | megace | SD | ||
| C9orf85 | SNV | Missense_Mutation | c.316N>A | p.Val106Ile | p.V106I | Q96MD7 | protein_coding | tolerated(0.11) | benign(0.024) | TCGA-EQ-8122-01 | Stomach | stomach adenocarcinoma | Female | >=65 | I/II | Chemotherapy | 5-fluorouracil | SD |
| Page: 1 2 |
Top |
Related drugs of malignant transformation related genes |
| Identification of chemicals and drugs interact with genes involved in malignant transfromation |
| (DGIdb 4.0) |
| Entrez ID | Symbol | Category | Interaction Types | Drug Claim Name | Drug Name | PMIDs |
| Page: 1 |

Copyright 2023-Present -The University of Texas Health Science Center at Houston |