
|
|||||
|
 | |
| |
| |
| |
| |
| |
|
Gene: C7orf26 |
Gene summary for C7ORF26 |
| Gene information | Species | Human | Gene symbol | C7orf26 | Gene ID | 79034 |
| Gene name | chromosome 7 open reading frame 26 | |
| Gene Alias | C7orf26 | |
| Cytomap | 7p22.1 | |
| Gene Type | protein-coding | GO ID | NA | UniProtAcc | Q96N11 |
Top |
Malignant transformation analysis |
| Identification of the aberrant gene expression in precancerous and cancerous lesions by comparing the gene expression of stem-like cells in diseased tissues with normal stem cells |
| Entrez ID | Symbol | Replicates | Species | Organ | Tissue | Adj P-value | Log2FC | Malignancy |
| 79034 | C7orf26 | S014 | Human | Liver | HCC | 1.30e-17 | 5.24e-01 | 0.2254 |
| 79034 | C7orf26 | S015 | Human | Liver | HCC | 6.79e-07 | 3.07e-01 | 0.2375 |
| 79034 | C7orf26 | S016 | Human | Liver | HCC | 1.93e-14 | 3.86e-01 | 0.2243 |
| 79034 | C7orf26 | S027 | Human | Liver | HCC | 1.66e-06 | 4.19e-01 | 0.2446 |
| 79034 | C7orf26 | S028 | Human | Liver | HCC | 1.48e-18 | 5.55e-01 | 0.2503 |
| 79034 | C7orf26 | S029 | Human | Liver | HCC | 9.59e-13 | 4.47e-01 | 0.2581 |
| 79034 | C7orf26 | C04 | Human | Oral cavity | OSCC | 1.13e-03 | 3.59e-01 | 0.2633 |
| 79034 | C7orf26 | C21 | Human | Oral cavity | OSCC | 1.69e-23 | 5.98e-01 | 0.2678 |
| 79034 | C7orf26 | C30 | Human | Oral cavity | OSCC | 1.35e-23 | 9.52e-01 | 0.3055 |
| 79034 | C7orf26 | C38 | Human | Oral cavity | OSCC | 1.48e-05 | 6.59e-01 | 0.172 |
| 79034 | C7orf26 | C43 | Human | Oral cavity | OSCC | 6.38e-25 | 3.77e-01 | 0.1704 |
| 79034 | C7orf26 | C46 | Human | Oral cavity | OSCC | 2.05e-12 | 2.13e-01 | 0.1673 |
| 79034 | C7orf26 | C51 | Human | Oral cavity | OSCC | 6.23e-03 | 2.18e-01 | 0.2674 |
| 79034 | C7orf26 | C08 | Human | Oral cavity | OSCC | 2.21e-15 | 2.94e-01 | 0.1919 |
| 79034 | C7orf26 | LN46 | Human | Oral cavity | OSCC | 7.74e-03 | 2.49e-01 | 0.1666 |
| 79034 | C7orf26 | LP15 | Human | Oral cavity | LP | 1.53e-04 | 6.14e-01 | 0.2174 |
| 79034 | C7orf26 | SYSMH1 | Human | Oral cavity | OSCC | 1.35e-06 | 1.07e-01 | 0.1127 |
| 79034 | C7orf26 | SYSMH2 | Human | Oral cavity | OSCC | 7.10e-18 | 1.43e-01 | 0.2326 |
| 79034 | C7orf26 | SYSMH3 | Human | Oral cavity | OSCC | 3.21e-13 | 1.37e-01 | 0.2442 |
| 79034 | C7orf26 | SYSMH4 | Human | Oral cavity | OSCC | 1.87e-05 | 2.77e-02 | 0.1226 |
| Page: 1 2 3 4 5 |
| Tissue | Expression Dynamics | Abbreviation |
| Esophagus |  | ESCC: Esophageal squamous cell carcinoma |
| HGIN: High-grade intraepithelial neoplasias | ||
| LGIN: Low-grade intraepithelial neoplasias | ||
| Liver | 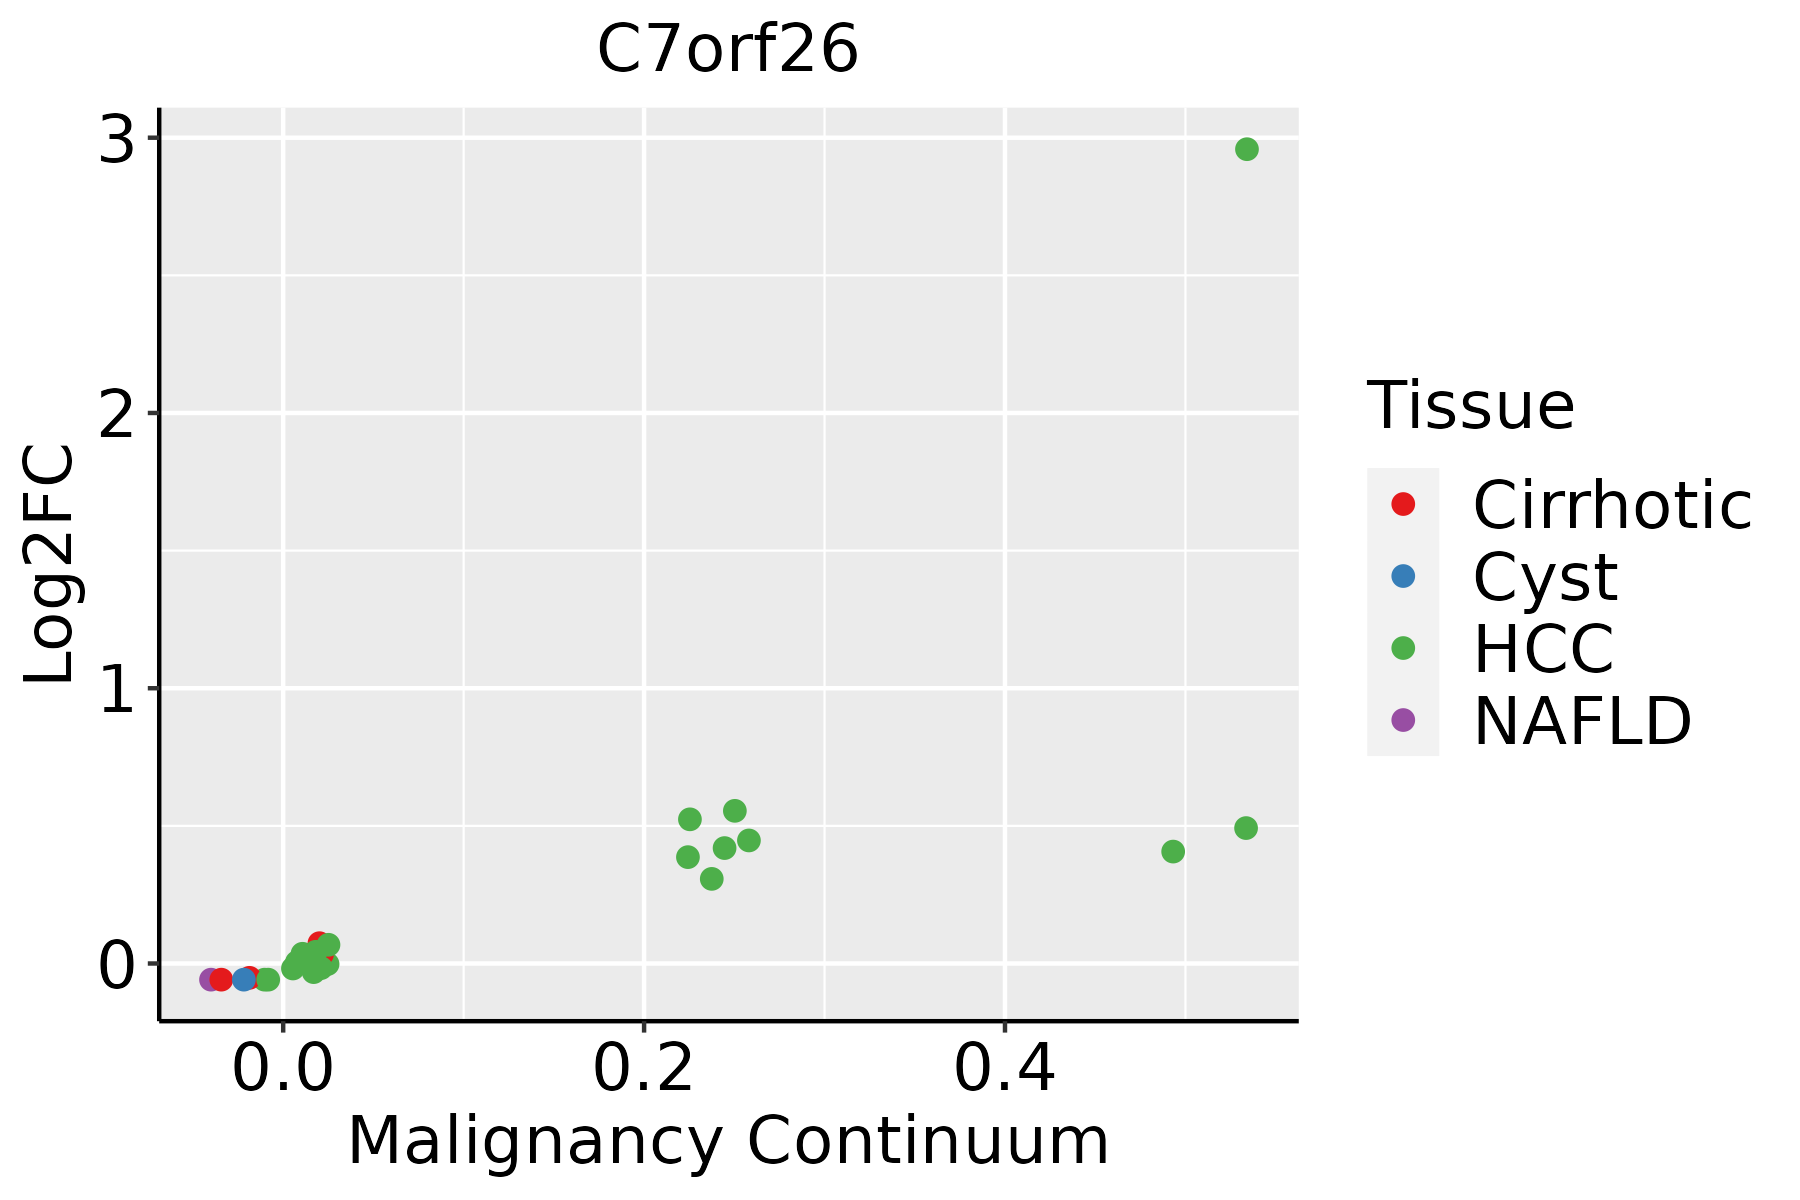 | HCC: Hepatocellular carcinoma |
| NAFLD: Non-alcoholic fatty liver disease | ||
| Oral Cavity | 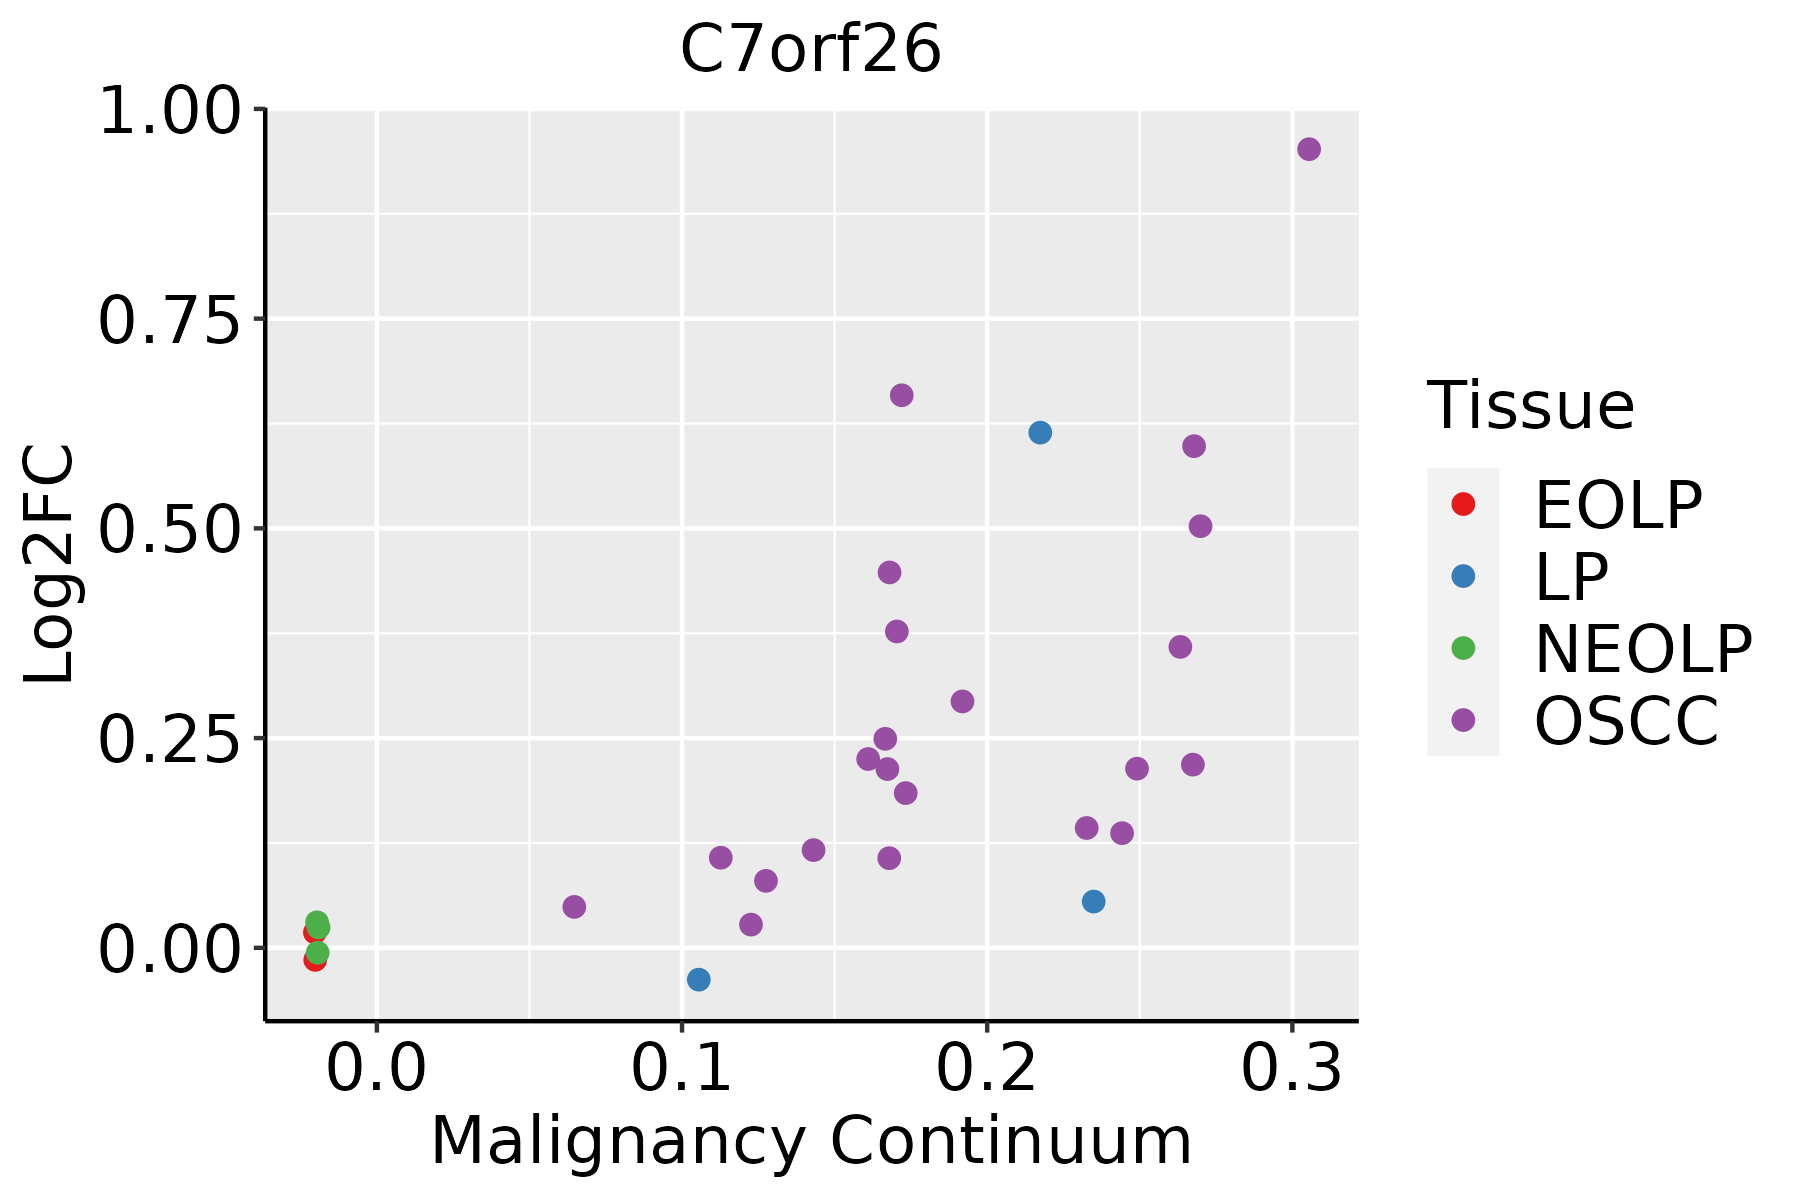 | EOLP: Erosive Oral lichen planus |
| LP: leukoplakia | ||
| NEOLP: Non-erosive oral lichen planus | ||
| OSCC: Oral squamous cell carcinoma | ||
| Thyroid |  | ATC: Anaplastic thyroid cancer |
| HT: Hashimoto's thyroiditis | ||
| PTC: Papillary thyroid cancer |
| ∗log2FC in expression of this searched gene in stem-like cells from each diseased tissue sample relative to stem-like cells in normal samples in each tissue plotted against the malignancy continuum. Samples are colored based on if they are from different disease stage. |
Top |
Malignant transformation related pathway analysis |
| Find out the enriched GO biological processes and KEGG pathways involved in transition from healthy to precancer to cancer |
| Tissue | Disease Stage | Enriched GO biological Processes |
| Colorectum | AD |  |
| Colorectum | SER |  |
| Colorectum | MSS |  |
| Colorectum | MSI-H |  |
| Colorectum | FAP |  |
| ∗Top 15 enriched GO BP terms are showed in the bar plot of each disease state in each tissue. Each row represents a significant GO biological process which is colored according to the -log10(p.adjust). |
| Page: 1 2 3 4 5 6 7 8 9 |
| GO ID | Tissue | Disease Stage | Description | Gene Ratio | Bg Ratio | pvalue | p.adjust | Count |
| Page: 1 |
| Pathway ID | Tissue | Disease Stage | Description | Gene Ratio | Bg Ratio | pvalue | p.adjust | qvalue | Count |
| Page: 1 |
Top |
Cell-cell communication analysis |
| Identification of potential cell-cell interactions between two cell types and their ligand-receptor pairs for different disease states |
| Ligand | Receptor | LRpair | Pathway | Tissue | Disease Stage |
| Page: 1 |
Top |
Single-cell gene regulatory network inference analysis |
| Find out the significant the regulons (TFs) and the target genes of each regulon across cell types for different disease states |
| TF | Cell Type | Tissue | Disease Stage | Target Gene | RSS | Regulon Activity |
| ∗The dot plots of a searched regulon are shown for all cell subpopulations in each disease state of each tissue based on the regulon specific score inferred using pySCENIC and by calculating the average expression. |
| Page: 1 |
Top |
Somatic mutation of malignant transformation related genes |
| Annotation of somatic variants for genes involved in malignant transformation |
| Hugo Symbol | Variant Class | Variant Classification | dbSNP RS | HGVSc | HGVSp | HGVSp Short | SWISSPROT | BIOTYPE | SIFT | PolyPhen | Tumor Sample Barcode | Tissue | Histology | Sex | Age | Stage | Therapy Types | Drugs | Outcome |
| C7orf26 | SNV | Missense_Mutation | rs778024323 | c.713N>T | p.Thr238Ile | p.T238I | Q96N11 | protein_coding | deleterious(0) | possibly_damaging(0.893) | TCGA-AR-A2LN-01 | Breast | breast invasive carcinoma | Female | >=65 | I/II | Hormone Therapy | letrozole | SD |
| C7orf26 | insertion | Frame_Shift_Ins | novel | c.1006_1007insGGTTGATTCTCATCACT | p.Leu336ArgfsTer7 | p.L336Rfs*7 | Q96N11 | protein_coding | TCGA-A8-A09D-01 | Breast | breast invasive carcinoma | Female | <65 | I/II | Chemotherapy | doxorubicin | CR | ||
| C7orf26 | SNV | Missense_Mutation | rs755583704 | c.958N>A | p.Asp320Asn | p.D320N | Q96N11 | protein_coding | tolerated(0.12) | possibly_damaging(0.879) | TCGA-EK-A3GJ-01 | Cervix | cervical & endocervical cancer | Female | <65 | I/II | Unknown | Unknown | SD |
| C7orf26 | SNV | Missense_Mutation | novel | c.1036N>C | p.Glu346Gln | p.E346Q | Q96N11 | protein_coding | tolerated(0.63) | probably_damaging(0.996) | TCGA-MY-A5BF-01 | Cervix | cervical & endocervical cancer | Female | >=65 | I/II | Chemotherapy | cisplatin | CR |
| C7orf26 | SNV | Missense_Mutation | novel | c.794G>A | p.Gly265Asp | p.G265D | Q96N11 | protein_coding | tolerated(0.05) | probably_damaging(0.999) | TCGA-VS-A94Z-01 | Cervix | cervical & endocervical cancer | Female | <65 | I/II | Chemotherapy | cisplatin | CR |
| C7orf26 | SNV | Missense_Mutation | rs760205435 | c.899C>T | p.Thr300Met | p.T300M | Q96N11 | protein_coding | tolerated(0.28) | benign(0) | TCGA-AA-3984-01 | Colorectum | colon adenocarcinoma | Female | <65 | I/II | Unknown | Unknown | SD |
| C7orf26 | SNV | Missense_Mutation | c.779N>T | p.Pro260Leu | p.P260L | Q96N11 | protein_coding | tolerated(0.11) | benign(0) | TCGA-AY-A69D-01 | Colorectum | colon adenocarcinoma | Female | <65 | I/II | Unknown | Unknown | SD | |
| C7orf26 | SNV | Missense_Mutation | novel | c.583G>T | p.Asp195Tyr | p.D195Y | Q96N11 | protein_coding | deleterious(0.01) | possibly_damaging(0.66) | TCGA-CA-6717-01 | Colorectum | colon adenocarcinoma | Male | <65 | I/II | Chemotherapy | oxaliplatin | CR |
| C7orf26 | SNV | Missense_Mutation | c.842G>A | p.Arg281Lys | p.R281K | Q96N11 | protein_coding | tolerated(0.48) | benign(0) | TCGA-WS-AB45-01 | Colorectum | colon adenocarcinoma | Female | <65 | I/II | Unknown | Unknown | SD | |
| C7orf26 | SNV | Missense_Mutation | rs778178395 | c.1177G>A | p.Val393Met | p.V393M | Q96N11 | protein_coding | tolerated_low_confidence(0.09) | probably_damaging(0.995) | TCGA-WS-AB45-01 | Colorectum | colon adenocarcinoma | Female | <65 | I/II | Unknown | Unknown | SD |
| Page: 1 2 3 4 5 |
Top |
Related drugs of malignant transformation related genes |
| Identification of chemicals and drugs interact with genes involved in malignant transfromation |
| (DGIdb 4.0) |
| Entrez ID | Symbol | Category | Interaction Types | Drug Claim Name | Drug Name | PMIDs |
| Page: 1 |

Copyright 2023-Present -The University of Texas Health Science Center at Houston |