
|
|||||
|
 | |
| |
| |
| |
| |
| |
|
Gene: C5orf51 |
Gene summary for C5ORF51 |
| Gene information | Species | Human | Gene symbol | C5orf51 | Gene ID | 285636 |
| Gene name | chromosome 5 open reading frame 51 | |
| Gene Alias | C5orf51 | |
| Cytomap | 5p13.1 | |
| Gene Type | protein-coding | GO ID | GO:0005575 | UniProtAcc | A6NDU8 |
Top |
Malignant transformation analysis |
| Identification of the aberrant gene expression in precancerous and cancerous lesions by comparing the gene expression of stem-like cells in diseased tissues with normal stem cells |
| Entrez ID | Symbol | Replicates | Species | Organ | Tissue | Adj P-value | Log2FC | Malignancy |
| 285636 | C5orf51 | P126T-E | Human | Esophagus | ESCC | 7.53e-05 | 6.98e-01 | 0.1125 |
| 285636 | C5orf51 | P127T-E | Human | Esophagus | ESCC | 2.86e-33 | 6.65e-01 | 0.0826 |
| 285636 | C5orf51 | P128T-E | Human | Esophagus | ESCC | 2.01e-60 | 1.69e+00 | 0.1241 |
| 285636 | C5orf51 | P130T-E | Human | Esophagus | ESCC | 1.19e-39 | 8.05e-01 | 0.1676 |
| 285636 | C5orf51 | HCC1_Meng | Human | Liver | HCC | 1.81e-28 | 3.13e-02 | 0.0246 |
| 285636 | C5orf51 | HCC2_Meng | Human | Liver | HCC | 3.71e-06 | 2.00e-02 | 0.0107 |
| 285636 | C5orf51 | HCC1 | Human | Liver | HCC | 9.29e-24 | 5.08e+00 | 0.5336 |
| 285636 | C5orf51 | HCC2 | Human | Liver | HCC | 2.87e-27 | 4.33e+00 | 0.5341 |
| 285636 | C5orf51 | Pt14.a | Human | Liver | HCC | 1.09e-03 | 2.20e-01 | 0.0169 |
| 285636 | C5orf51 | S014 | Human | Liver | HCC | 2.04e-21 | 6.26e-01 | 0.2254 |
| 285636 | C5orf51 | S015 | Human | Liver | HCC | 6.25e-21 | 8.08e-01 | 0.2375 |
| 285636 | C5orf51 | S016 | Human | Liver | HCC | 4.31e-26 | 7.06e-01 | 0.2243 |
| 285636 | C5orf51 | S027 | Human | Liver | HCC | 1.97e-07 | 6.74e-01 | 0.2446 |
| 285636 | C5orf51 | S028 | Human | Liver | HCC | 7.59e-23 | 8.48e-01 | 0.2503 |
| 285636 | C5orf51 | S029 | Human | Liver | HCC | 2.83e-20 | 7.66e-01 | 0.2581 |
| 285636 | C5orf51 | C04 | Human | Oral cavity | OSCC | 2.91e-04 | 3.27e-01 | 0.2633 |
| 285636 | C5orf51 | C21 | Human | Oral cavity | OSCC | 2.84e-08 | 3.33e-01 | 0.2678 |
| 285636 | C5orf51 | C30 | Human | Oral cavity | OSCC | 8.38e-10 | 5.03e-01 | 0.3055 |
| 285636 | C5orf51 | C08 | Human | Oral cavity | OSCC | 2.25e-14 | 3.32e-01 | 0.1919 |
| 285636 | C5orf51 | LP15 | Human | Oral cavity | LP | 3.78e-02 | 5.06e-01 | 0.2174 |
| Page: 1 2 3 4 5 |
| Tissue | Expression Dynamics | Abbreviation |
| Esophagus |  | ESCC: Esophageal squamous cell carcinoma |
| HGIN: High-grade intraepithelial neoplasias | ||
| LGIN: Low-grade intraepithelial neoplasias | ||
| Liver | 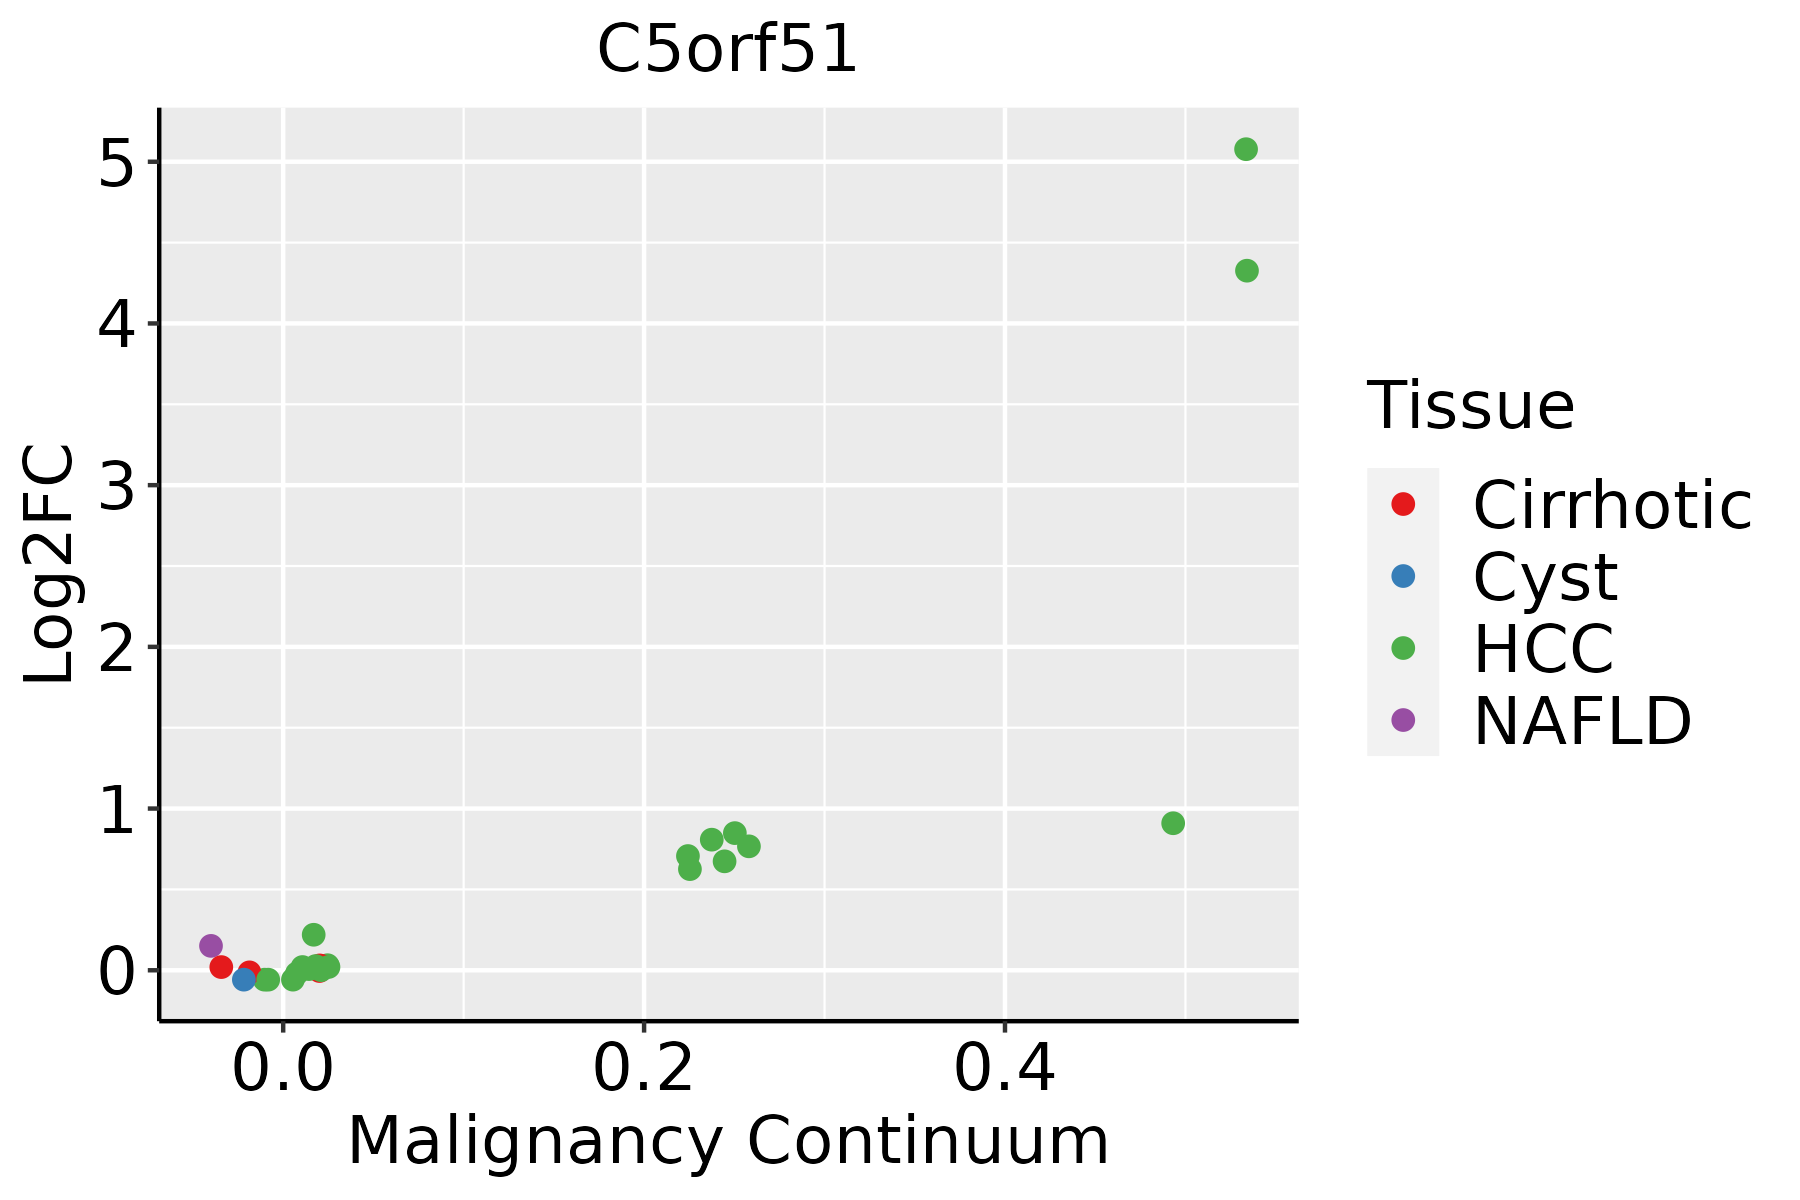 | HCC: Hepatocellular carcinoma |
| NAFLD: Non-alcoholic fatty liver disease | ||
| Oral Cavity | 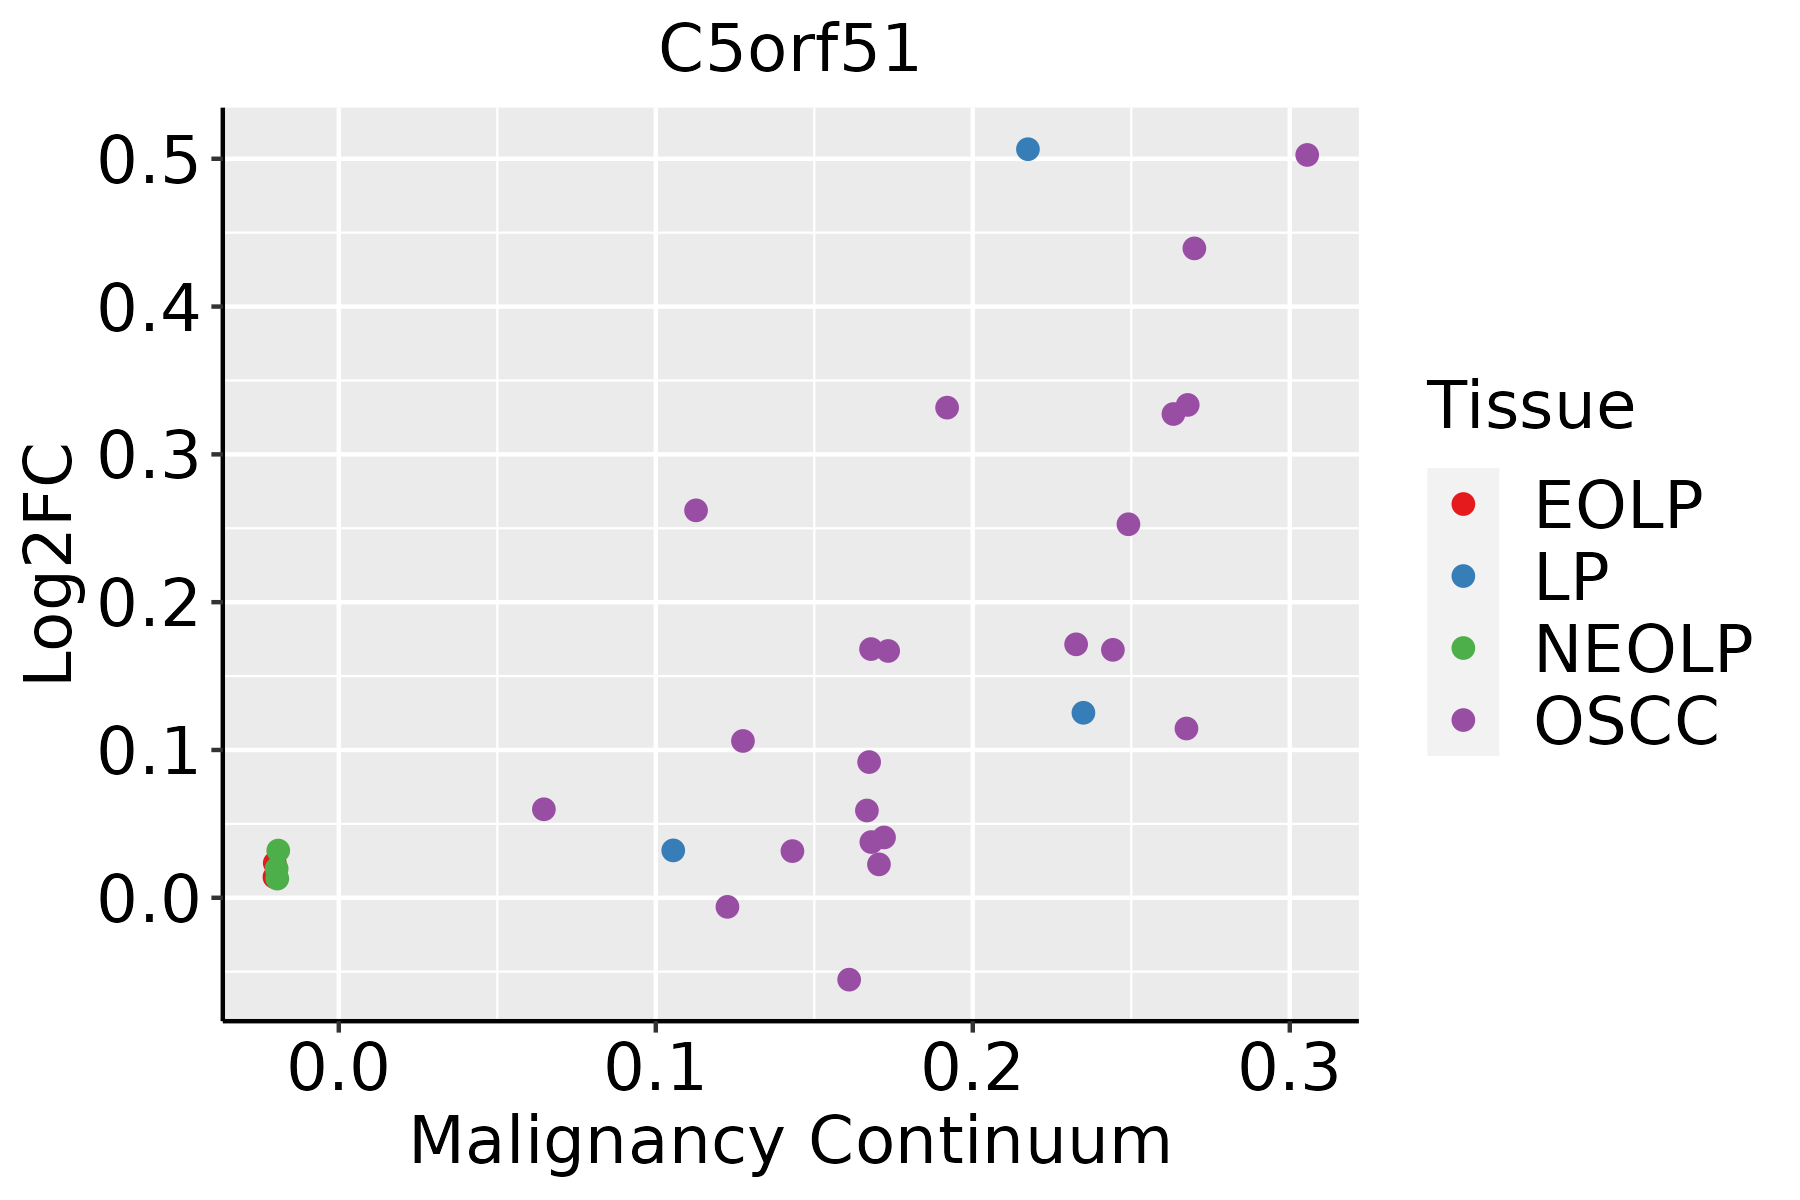 | EOLP: Erosive Oral lichen planus |
| LP: leukoplakia | ||
| NEOLP: Non-erosive oral lichen planus | ||
| OSCC: Oral squamous cell carcinoma |
| ∗log2FC in expression of this searched gene in stem-like cells from each diseased tissue sample relative to stem-like cells in normal samples in each tissue plotted against the malignancy continuum. Samples are colored based on if they are from different disease stage. |
Top |
Malignant transformation related pathway analysis |
| Find out the enriched GO biological processes and KEGG pathways involved in transition from healthy to precancer to cancer |
| Tissue | Disease Stage | Enriched GO biological Processes |
| Colorectum | AD |  |
| Colorectum | SER |  |
| Colorectum | MSS |  |
| Colorectum | MSI-H |  |
| Colorectum | FAP |  |
| ∗Top 15 enriched GO BP terms are showed in the bar plot of each disease state in each tissue. Each row represents a significant GO biological process which is colored according to the -log10(p.adjust). |
| Page: 1 2 3 4 5 6 7 8 9 |
| GO ID | Tissue | Disease Stage | Description | Gene Ratio | Bg Ratio | pvalue | p.adjust | Count |
| Page: 1 |
| Pathway ID | Tissue | Disease Stage | Description | Gene Ratio | Bg Ratio | pvalue | p.adjust | qvalue | Count |
| Page: 1 |
Top |
Cell-cell communication analysis |
| Identification of potential cell-cell interactions between two cell types and their ligand-receptor pairs for different disease states |
| Ligand | Receptor | LRpair | Pathway | Tissue | Disease Stage |
| Page: 1 |
Top |
Single-cell gene regulatory network inference analysis |
| Find out the significant the regulons (TFs) and the target genes of each regulon across cell types for different disease states |
| TF | Cell Type | Tissue | Disease Stage | Target Gene | RSS | Regulon Activity |
| ∗The dot plots of a searched regulon are shown for all cell subpopulations in each disease state of each tissue based on the regulon specific score inferred using pySCENIC and by calculating the average expression. |
| Page: 1 |
Top |
Somatic mutation of malignant transformation related genes |
| Annotation of somatic variants for genes involved in malignant transformation |
| Hugo Symbol | Variant Class | Variant Classification | dbSNP RS | HGVSc | HGVSp | HGVSp Short | SWISSPROT | BIOTYPE | SIFT | PolyPhen | Tumor Sample Barcode | Tissue | Histology | Sex | Age | Stage | Therapy Types | Drugs | Outcome |
| C5orf51 | SNV | Missense_Mutation | novel | c.864N>A | p.Phe288Leu | p.F288L | A6NDU8 | protein_coding | deleterious(0.04) | possibly_damaging(0.487) | TCGA-AN-A046-01 | Breast | breast invasive carcinoma | Female | >=65 | I/II | Unknown | Unknown | SD |
| C5orf51 | SNV | Missense_Mutation | novel | c.770N>C | p.Gly257Ala | p.G257A | A6NDU8 | protein_coding | deleterious(0) | probably_damaging(0.999) | TCGA-BH-A0B6-01 | Breast | breast invasive carcinoma | Female | <65 | I/II | Unknown | Unknown | SD |
| C5orf51 | SNV | Missense_Mutation | c.263N>T | p.Pro88Leu | p.P88L | A6NDU8 | protein_coding | deleterious(0) | probably_damaging(0.976) | TCGA-C8-A1HM-01 | Breast | breast invasive carcinoma | Female | >=65 | I/II | Chemotherapy | doxorubicin | CR | |
| C5orf51 | SNV | Missense_Mutation | c.464N>A | p.Arg155Lys | p.R155K | A6NDU8 | protein_coding | tolerated(0.88) | benign(0.007) | TCGA-D8-A1XU-01 | Breast | breast invasive carcinoma | Female | <65 | I/II | Unknown | Unknown | SD | |
| C5orf51 | deletion | In_Frame_Del | c.31_39delCGAGTGGAA | p.Arg11_Glu13del | p.R11_E13del | A6NDU8 | protein_coding | TCGA-AN-A0FX-01 | Breast | breast invasive carcinoma | Female | <65 | I/II | Unknown | Unknown | SD | |||
| C5orf51 | SNV | Missense_Mutation | c.136A>C | p.Lys46Gln | p.K46Q | A6NDU8 | protein_coding | deleterious(0.01) | possibly_damaging(0.866) | TCGA-A6-6141-01 | Colorectum | colon adenocarcinoma | Male | <65 | I/II | Chemotherapy | 5-fu | SD | |
| C5orf51 | SNV | Missense_Mutation | rs370411797 | c.533N>A | p.Arg178Gln | p.R178Q | A6NDU8 | protein_coding | deleterious(0) | probably_damaging(0.997) | TCGA-AZ-4315-01 | Colorectum | colon adenocarcinoma | Male | <65 | I/II | Unknown | Unknown | SD |
| C5orf51 | SNV | Missense_Mutation | c.324N>G | p.Ile108Met | p.I108M | A6NDU8 | protein_coding | tolerated(0.24) | possibly_damaging(0.549) | TCGA-AX-A0J0-01 | Endometrium | uterine corpus endometrioid carcinoma | Female | <65 | I/II | Unknown | Unknown | SD | |
| C5orf51 | SNV | Missense_Mutation | novel | c.166G>A | p.Glu56Lys | p.E56K | A6NDU8 | protein_coding | deleterious(0.04) | benign(0.006) | TCGA-B5-A3FA-01 | Endometrium | uterine corpus endometrioid carcinoma | Female | >=65 | I/II | Unknown | Unknown | SD |
| C5orf51 | SNV | Missense_Mutation | c.162N>T | p.Glu54Asp | p.E54D | A6NDU8 | protein_coding | tolerated(0.78) | benign(0) | TCGA-BS-A0UV-01 | Endometrium | uterine corpus endometrioid carcinoma | Female | <65 | III/IV | Unknown | Unknown | SD |
| Page: 1 2 3 |
Top |
Related drugs of malignant transformation related genes |
| Identification of chemicals and drugs interact with genes involved in malignant transfromation |
| (DGIdb 4.0) |
| Entrez ID | Symbol | Category | Interaction Types | Drug Claim Name | Drug Name | PMIDs |
| Page: 1 |

Copyright 2023-Present -The University of Texas Health Science Center at Houston |