
|
|||||
|
 | |
| |
| |
| |
| |
| |
|
Gene: C2orf49 |
Gene summary for C2ORF49 |
| Gene information | Species | Human | Gene symbol | C2orf49 | Gene ID | 79074 |
| Gene name | chromosome 2 open reading frame 49 | |
| Gene Alias | asw | |
| Cytomap | 2q12.2 | |
| Gene Type | protein-coding | GO ID | GO:0007275 | UniProtAcc | C9J4K0 |
Top |
Malignant transformation analysis |
| Identification of the aberrant gene expression in precancerous and cancerous lesions by comparing the gene expression of stem-like cells in diseased tissues with normal stem cells |
| Entrez ID | Symbol | Replicates | Species | Organ | Tissue | Adj P-value | Log2FC | Malignancy |
| 79074 | C2orf49 | P130T-E | Human | Esophagus | ESCC | 3.06e-28 | 5.34e-01 | 0.1676 |
| 79074 | C2orf49 | HCC1_Meng | Human | Liver | HCC | 1.09e-62 | 7.63e-02 | 0.0246 |
| 79074 | C2orf49 | HCC2_Meng | Human | Liver | HCC | 1.07e-25 | 1.31e-01 | 0.0107 |
| 79074 | C2orf49 | cirrhotic2 | Human | Liver | Cirrhotic | 1.16e-03 | 4.48e-02 | 0.0201 |
| 79074 | C2orf49 | HCC1 | Human | Liver | HCC | 8.45e-11 | 3.91e+00 | 0.5336 |
| 79074 | C2orf49 | HCC2 | Human | Liver | HCC | 4.07e-16 | 3.38e+00 | 0.5341 |
| 79074 | C2orf49 | Pt13.b | Human | Liver | HCC | 3.51e-05 | 8.55e-02 | 0.0251 |
| 79074 | C2orf49 | S015 | Human | Liver | HCC | 3.25e-09 | 4.34e-01 | 0.2375 |
| 79074 | C2orf49 | S016 | Human | Liver | HCC | 5.87e-07 | 3.29e-01 | 0.2243 |
| 79074 | C2orf49 | S028 | Human | Liver | HCC | 4.60e-09 | 3.31e-01 | 0.2503 |
| 79074 | C2orf49 | S029 | Human | Liver | HCC | 2.30e-08 | 3.92e-01 | 0.2581 |
| 79074 | C2orf49 | C04 | Human | Oral cavity | OSCC | 6.59e-10 | 5.95e-01 | 0.2633 |
| 79074 | C2orf49 | C21 | Human | Oral cavity | OSCC | 3.21e-22 | 7.34e-01 | 0.2678 |
| 79074 | C2orf49 | C30 | Human | Oral cavity | OSCC | 9.41e-21 | 9.09e-01 | 0.3055 |
| 79074 | C2orf49 | C43 | Human | Oral cavity | OSCC | 8.99e-15 | 2.58e-01 | 0.1704 |
| 79074 | C2orf49 | C46 | Human | Oral cavity | OSCC | 7.30e-04 | 2.47e-01 | 0.1673 |
| 79074 | C2orf49 | C51 | Human | Oral cavity | OSCC | 1.37e-03 | 3.14e-01 | 0.2674 |
| 79074 | C2orf49 | C57 | Human | Oral cavity | OSCC | 3.92e-03 | 1.97e-01 | 0.1679 |
| 79074 | C2orf49 | C06 | Human | Oral cavity | OSCC | 2.62e-04 | 8.32e-01 | 0.2699 |
| 79074 | C2orf49 | C08 | Human | Oral cavity | OSCC | 2.11e-13 | 2.79e-01 | 0.1919 |
| Page: 1 2 3 4 5 |
| Tissue | Expression Dynamics | Abbreviation |
| Esophagus |  | ESCC: Esophageal squamous cell carcinoma |
| HGIN: High-grade intraepithelial neoplasias | ||
| LGIN: Low-grade intraepithelial neoplasias | ||
| Liver | 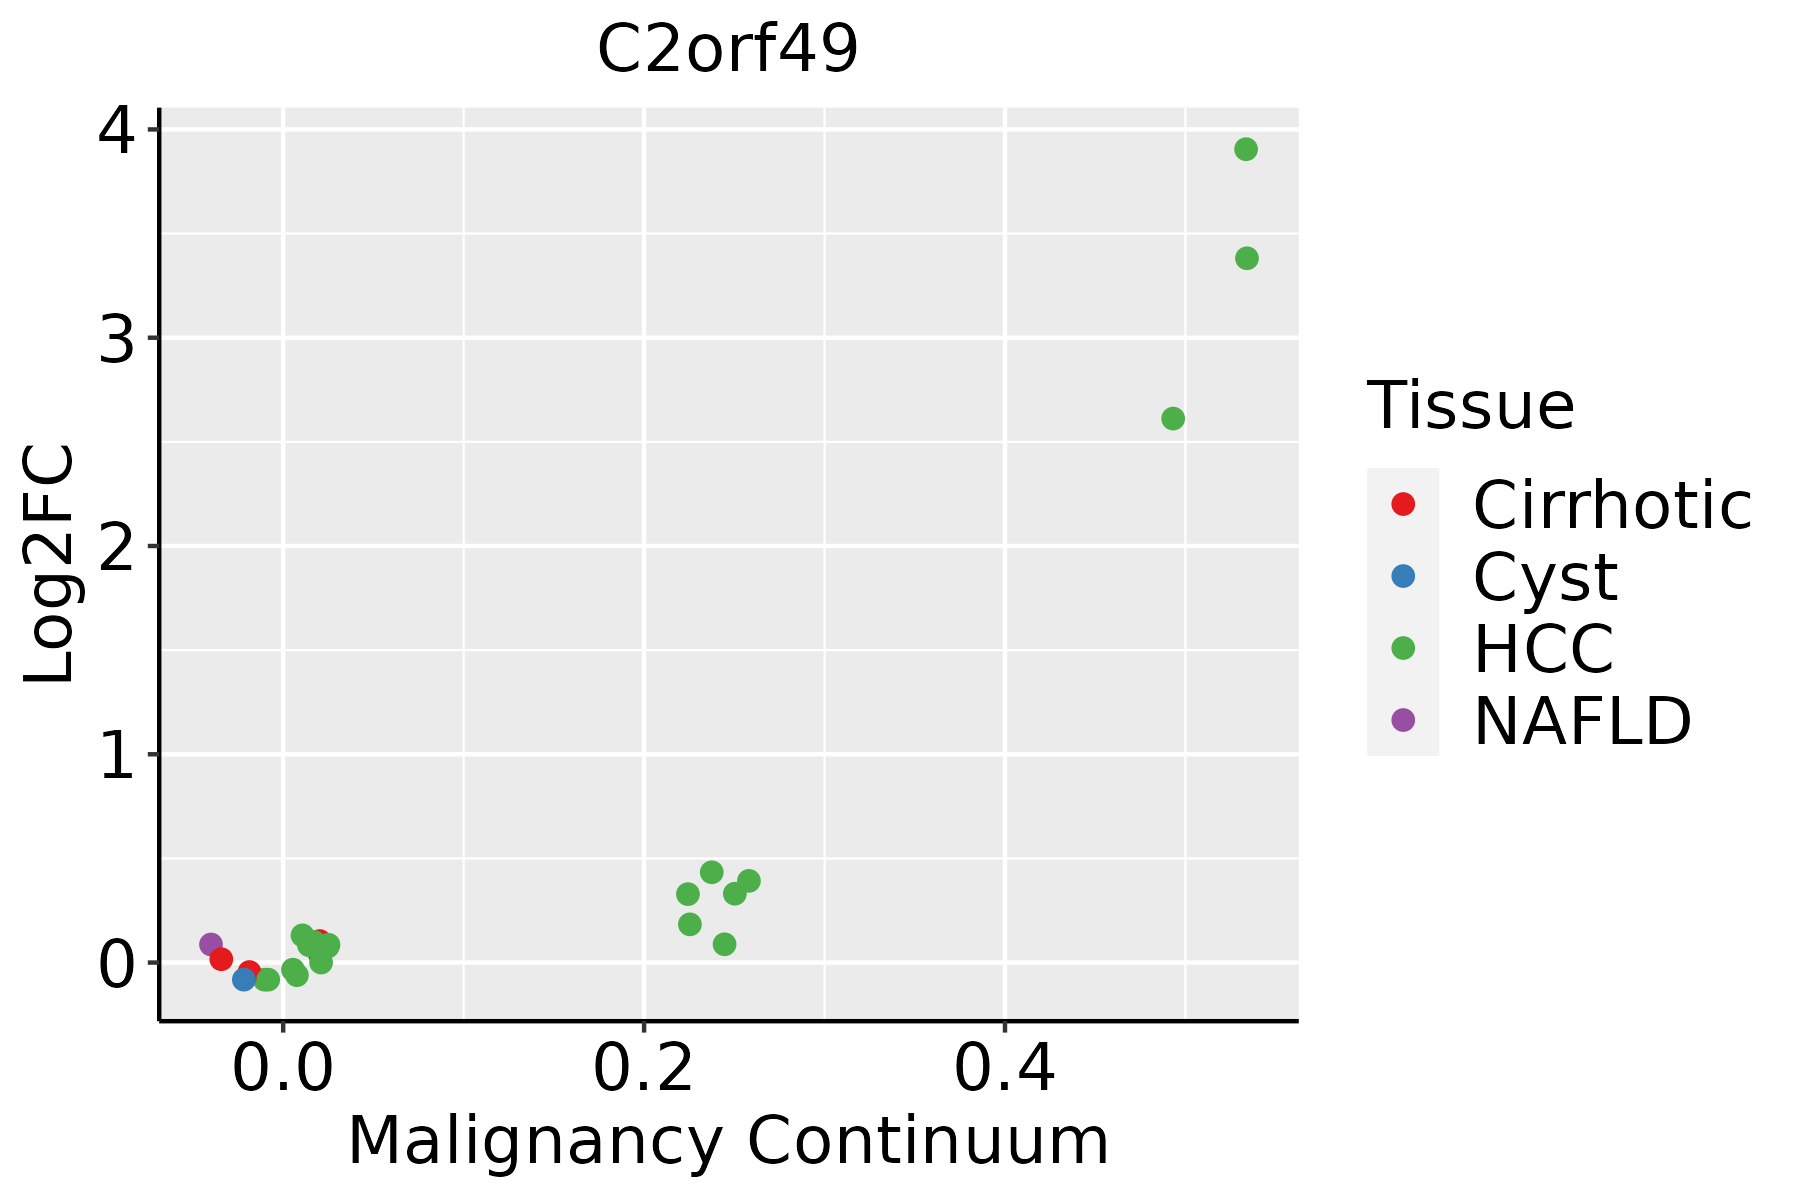 | HCC: Hepatocellular carcinoma |
| NAFLD: Non-alcoholic fatty liver disease | ||
| Oral Cavity | 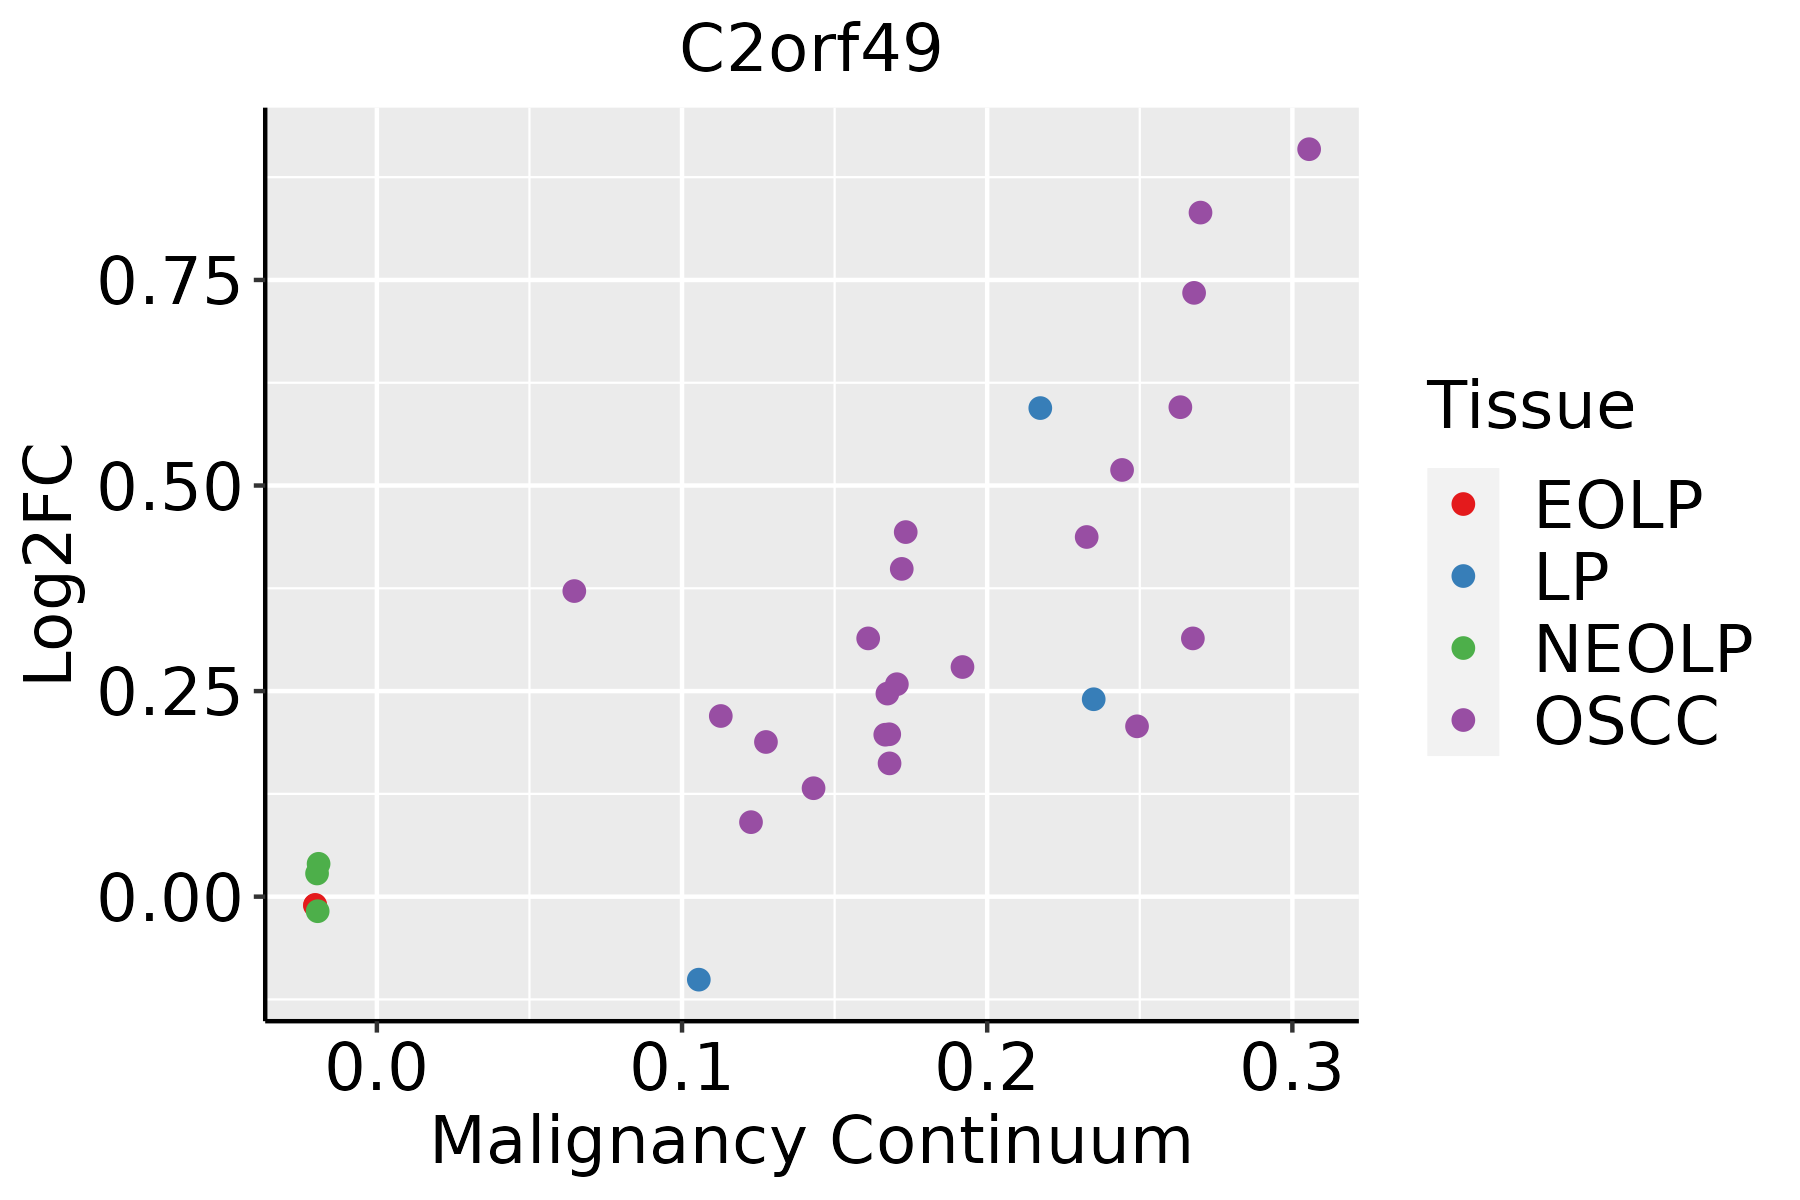 | EOLP: Erosive Oral lichen planus |
| LP: leukoplakia | ||
| NEOLP: Non-erosive oral lichen planus | ||
| OSCC: Oral squamous cell carcinoma | ||
| Thyroid | 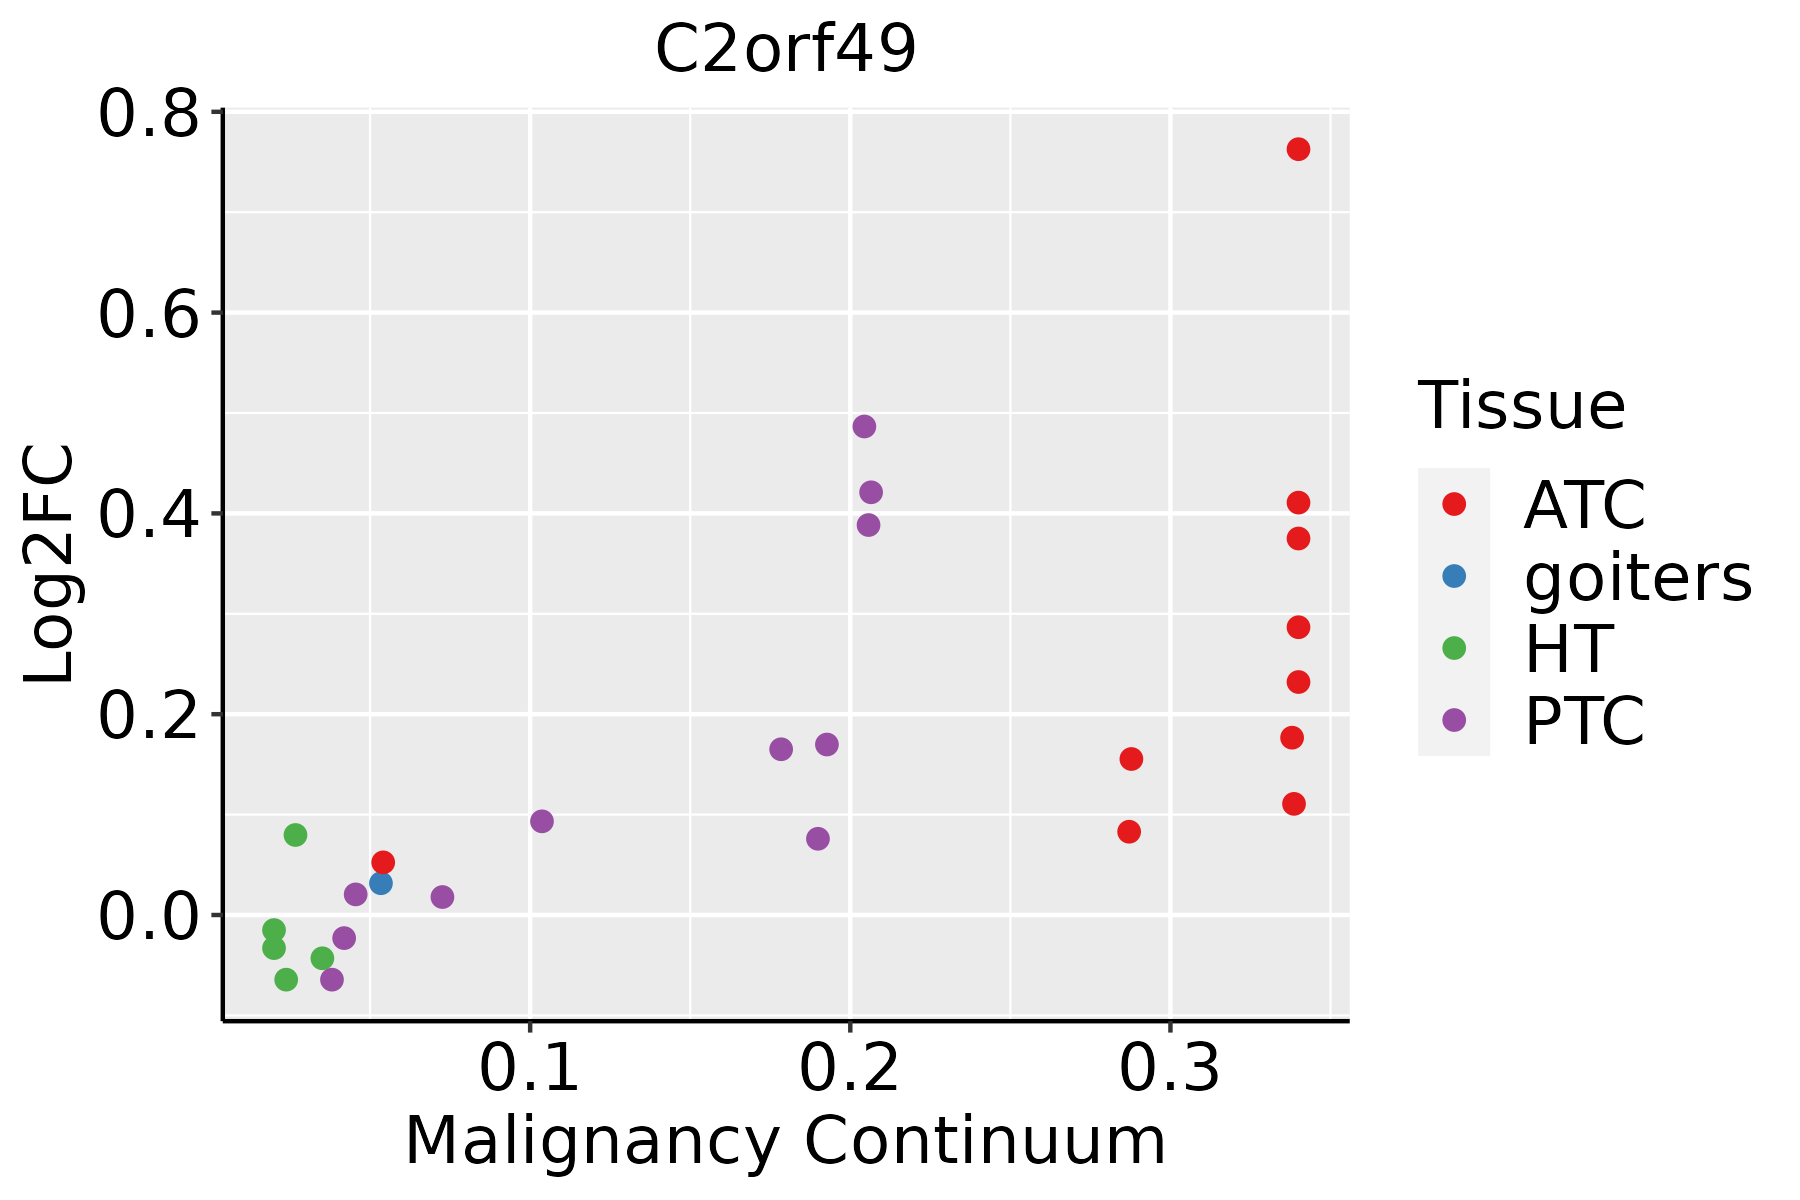 | ATC: Anaplastic thyroid cancer |
| HT: Hashimoto's thyroiditis | ||
| PTC: Papillary thyroid cancer |
| ∗log2FC in expression of this searched gene in stem-like cells from each diseased tissue sample relative to stem-like cells in normal samples in each tissue plotted against the malignancy continuum. Samples are colored based on if they are from different disease stage. |
Top |
Malignant transformation related pathway analysis |
| Find out the enriched GO biological processes and KEGG pathways involved in transition from healthy to precancer to cancer |
| Tissue | Disease Stage | Enriched GO biological Processes |
| Colorectum | AD |  |
| Colorectum | SER |  |
| Colorectum | MSS |  |
| Colorectum | MSI-H |  |
| Colorectum | FAP |  |
| ∗Top 15 enriched GO BP terms are showed in the bar plot of each disease state in each tissue. Each row represents a significant GO biological process which is colored according to the -log10(p.adjust). |
| Page: 1 2 3 4 5 6 7 8 9 |
| GO ID | Tissue | Disease Stage | Description | Gene Ratio | Bg Ratio | pvalue | p.adjust | Count |
| Page: 1 |
| Pathway ID | Tissue | Disease Stage | Description | Gene Ratio | Bg Ratio | pvalue | p.adjust | qvalue | Count |
| Page: 1 |
Top |
Cell-cell communication analysis |
| Identification of potential cell-cell interactions between two cell types and their ligand-receptor pairs for different disease states |
| Ligand | Receptor | LRpair | Pathway | Tissue | Disease Stage |
| Page: 1 |
Top |
Single-cell gene regulatory network inference analysis |
| Find out the significant the regulons (TFs) and the target genes of each regulon across cell types for different disease states |
| TF | Cell Type | Tissue | Disease Stage | Target Gene | RSS | Regulon Activity |
| ∗The dot plots of a searched regulon are shown for all cell subpopulations in each disease state of each tissue based on the regulon specific score inferred using pySCENIC and by calculating the average expression. |
| Page: 1 |
Top |
Somatic mutation of malignant transformation related genes |
| Annotation of somatic variants for genes involved in malignant transformation |
| Hugo Symbol | Variant Class | Variant Classification | dbSNP RS | HGVSc | HGVSp | HGVSp Short | SWISSPROT | BIOTYPE | SIFT | PolyPhen | Tumor Sample Barcode | Tissue | Histology | Sex | Age | Stage | Therapy Types | Drugs | Outcome |
| C2orf49 | SNV | Missense_Mutation | novel | c.419N>A | p.Arg140Lys | p.R140K | Q9BVC5 | protein_coding | tolerated(0.11) | benign(0.037) | TCGA-A8-A094-01 | Breast | breast invasive carcinoma | Female | >=65 | I/II | Unknown | Unknown | SD |
| C2orf49 | SNV | Missense_Mutation | c.176N>G | p.Pro59Arg | p.P59R | Q9BVC5 | protein_coding | deleterious(0) | probably_damaging(0.999) | TCGA-AC-A23H-01 | Breast | breast invasive carcinoma | Female | >=65 | I/II | Unknown | Unknown | PD | |
| C2orf49 | SNV | Missense_Mutation | c.296N>A | p.Arg99Lys | p.R99K | Q9BVC5 | protein_coding | deleterious(0) | probably_damaging(0.986) | TCGA-BH-A0HF-01 | Breast | breast invasive carcinoma | Female | >=65 | I/II | Hormone Therapy | arimidex | SD | |
| C2orf49 | SNV | Missense_Mutation | rs765886202 | c.214N>G | p.Lys72Glu | p.K72E | Q9BVC5 | protein_coding | deleterious(0.03) | possibly_damaging(0.78) | TCGA-AA-3672-01 | Colorectum | colon adenocarcinoma | Female | >=65 | III/IV | Unknown | Unknown | SD |
| C2orf49 | SNV | Missense_Mutation | c.440C>T | p.Ser147Leu | p.S147L | Q9BVC5 | protein_coding | tolerated(0.06) | benign(0.262) | TCGA-AA-3984-01 | Colorectum | colon adenocarcinoma | Female | <65 | I/II | Unknown | Unknown | SD | |
| C2orf49 | SNV | Missense_Mutation | rs368281845 | c.566N>T | p.Ser189Leu | p.S189L | Q9BVC5 | protein_coding | tolerated(0.6) | benign(0.003) | TCGA-AY-6197-01 | Colorectum | colon adenocarcinoma | Male | <65 | I/II | Unknown | Unknown | SD |
| C2orf49 | SNV | Missense_Mutation | novel | c.635A>G | p.Glu212Gly | p.E212G | Q9BVC5 | protein_coding | deleterious(0.03) | possibly_damaging(0.726) | TCGA-G4-6321-01 | Colorectum | colon adenocarcinoma | Female | <65 | III/IV | Chemotherapy | fluorouracil | SD |
| C2orf49 | SNV | Missense_Mutation | c.440N>T | p.Ser147Leu | p.S147L | Q9BVC5 | protein_coding | tolerated(0.06) | benign(0.262) | TCGA-F5-6814-01 | Colorectum | rectum adenocarcinoma | Male | <65 | I/II | Unknown | Unknown | SD | |
| C2orf49 | SNV | Missense_Mutation | rs368281845 | c.566N>T | p.Ser189Leu | p.S189L | Q9BVC5 | protein_coding | tolerated(0.6) | benign(0.003) | TCGA-A5-A0G2-01 | Endometrium | uterine corpus endometrioid carcinoma | Female | <65 | III/IV | Unknown | Unknown | SD |
| C2orf49 | SNV | Missense_Mutation | novel | c.175N>T | p.Pro59Ser | p.P59S | Q9BVC5 | protein_coding | deleterious(0) | probably_damaging(0.998) | TCGA-A5-A2K5-01 | Endometrium | uterine corpus endometrioid carcinoma | Female | >=65 | I/II | Unknown | Unknown | SD |
| Page: 1 2 3 |
Top |
Related drugs of malignant transformation related genes |
| Identification of chemicals and drugs interact with genes involved in malignant transfromation |
| (DGIdb 4.0) |
| Entrez ID | Symbol | Category | Interaction Types | Drug Claim Name | Drug Name | PMIDs |
| Page: 1 |

Copyright 2023-Present -The University of Texas Health Science Center at Houston |