
|
|||||
|
 | |
| |
| |
| |
| |
| |
|
Gene: C1orf35 |
Gene summary for C1ORF35 |
| Gene information | Species | Human | Gene symbol | C1orf35 | Gene ID | 79169 |
| Gene name | chromosome 1 open reading frame 35 | |
| Gene Alias | MMTAG2 | |
| Cytomap | 1q42.13 | |
| Gene Type | protein-coding | GO ID | GO:0005575 | UniProtAcc | Q9BU76 |
Top |
Malignant transformation analysis |
| Identification of the aberrant gene expression in precancerous and cancerous lesions by comparing the gene expression of stem-like cells in diseased tissues with normal stem cells |
| Entrez ID | Symbol | Replicates | Species | Organ | Tissue | Adj P-value | Log2FC | Malignancy |
| 79169 | C1orf35 | P91T-E | Human | Esophagus | ESCC | 8.16e-15 | 1.68e+00 | 0.1828 |
| 79169 | C1orf35 | P94T-E | Human | Esophagus | ESCC | 1.68e-02 | 5.85e-01 | 0.0879 |
| 79169 | C1orf35 | P104T-E | Human | Esophagus | ESCC | 1.40e-04 | 5.65e-01 | 0.0931 |
| 79169 | C1orf35 | P107T-E | Human | Esophagus | ESCC | 1.02e-44 | 9.96e-01 | 0.171 |
| 79169 | C1orf35 | P126T-E | Human | Esophagus | ESCC | 8.55e-07 | 8.77e-01 | 0.1125 |
| 79169 | C1orf35 | P127T-E | Human | Esophagus | ESCC | 3.02e-33 | 5.76e-01 | 0.0826 |
| 79169 | C1orf35 | P128T-E | Human | Esophagus | ESCC | 2.79e-37 | 1.03e+00 | 0.1241 |
| 79169 | C1orf35 | P130T-E | Human | Esophagus | ESCC | 1.84e-103 | 1.88e+00 | 0.1676 |
| 79169 | C1orf35 | S43 | Human | Liver | Cirrhotic | 9.68e-04 | -1.30e-01 | -0.0187 |
| 79169 | C1orf35 | HCC1_Meng | Human | Liver | HCC | 6.47e-72 | 9.58e-02 | 0.0246 |
| 79169 | C1orf35 | HCC2_Meng | Human | Liver | HCC | 5.51e-26 | 2.01e-01 | 0.0107 |
| 79169 | C1orf35 | cirrhotic1 | Human | Liver | Cirrhotic | 1.33e-05 | 2.12e-01 | 0.0202 |
| 79169 | C1orf35 | HCC1 | Human | Liver | HCC | 2.07e-02 | 3.39e+00 | 0.5336 |
| 79169 | C1orf35 | HCC2 | Human | Liver | HCC | 3.15e-06 | 2.99e+00 | 0.5341 |
| 79169 | C1orf35 | Pt13.b | Human | Liver | HCC | 1.03e-08 | 1.51e-01 | 0.0251 |
| 79169 | C1orf35 | Pt14.a | Human | Liver | HCC | 1.85e-05 | 3.15e-01 | 0.0169 |
| 79169 | C1orf35 | S014 | Human | Liver | HCC | 1.08e-23 | 1.08e+00 | 0.2254 |
| 79169 | C1orf35 | S015 | Human | Liver | HCC | 4.27e-13 | 6.76e-01 | 0.2375 |
| 79169 | C1orf35 | S016 | Human | Liver | HCC | 4.82e-22 | 8.08e-01 | 0.2243 |
| 79169 | C1orf35 | S027 | Human | Liver | HCC | 4.61e-16 | 1.41e+00 | 0.2446 |
| Page: 1 2 3 4 5 6 7 |
| Tissue | Expression Dynamics | Abbreviation |
| Esophagus | 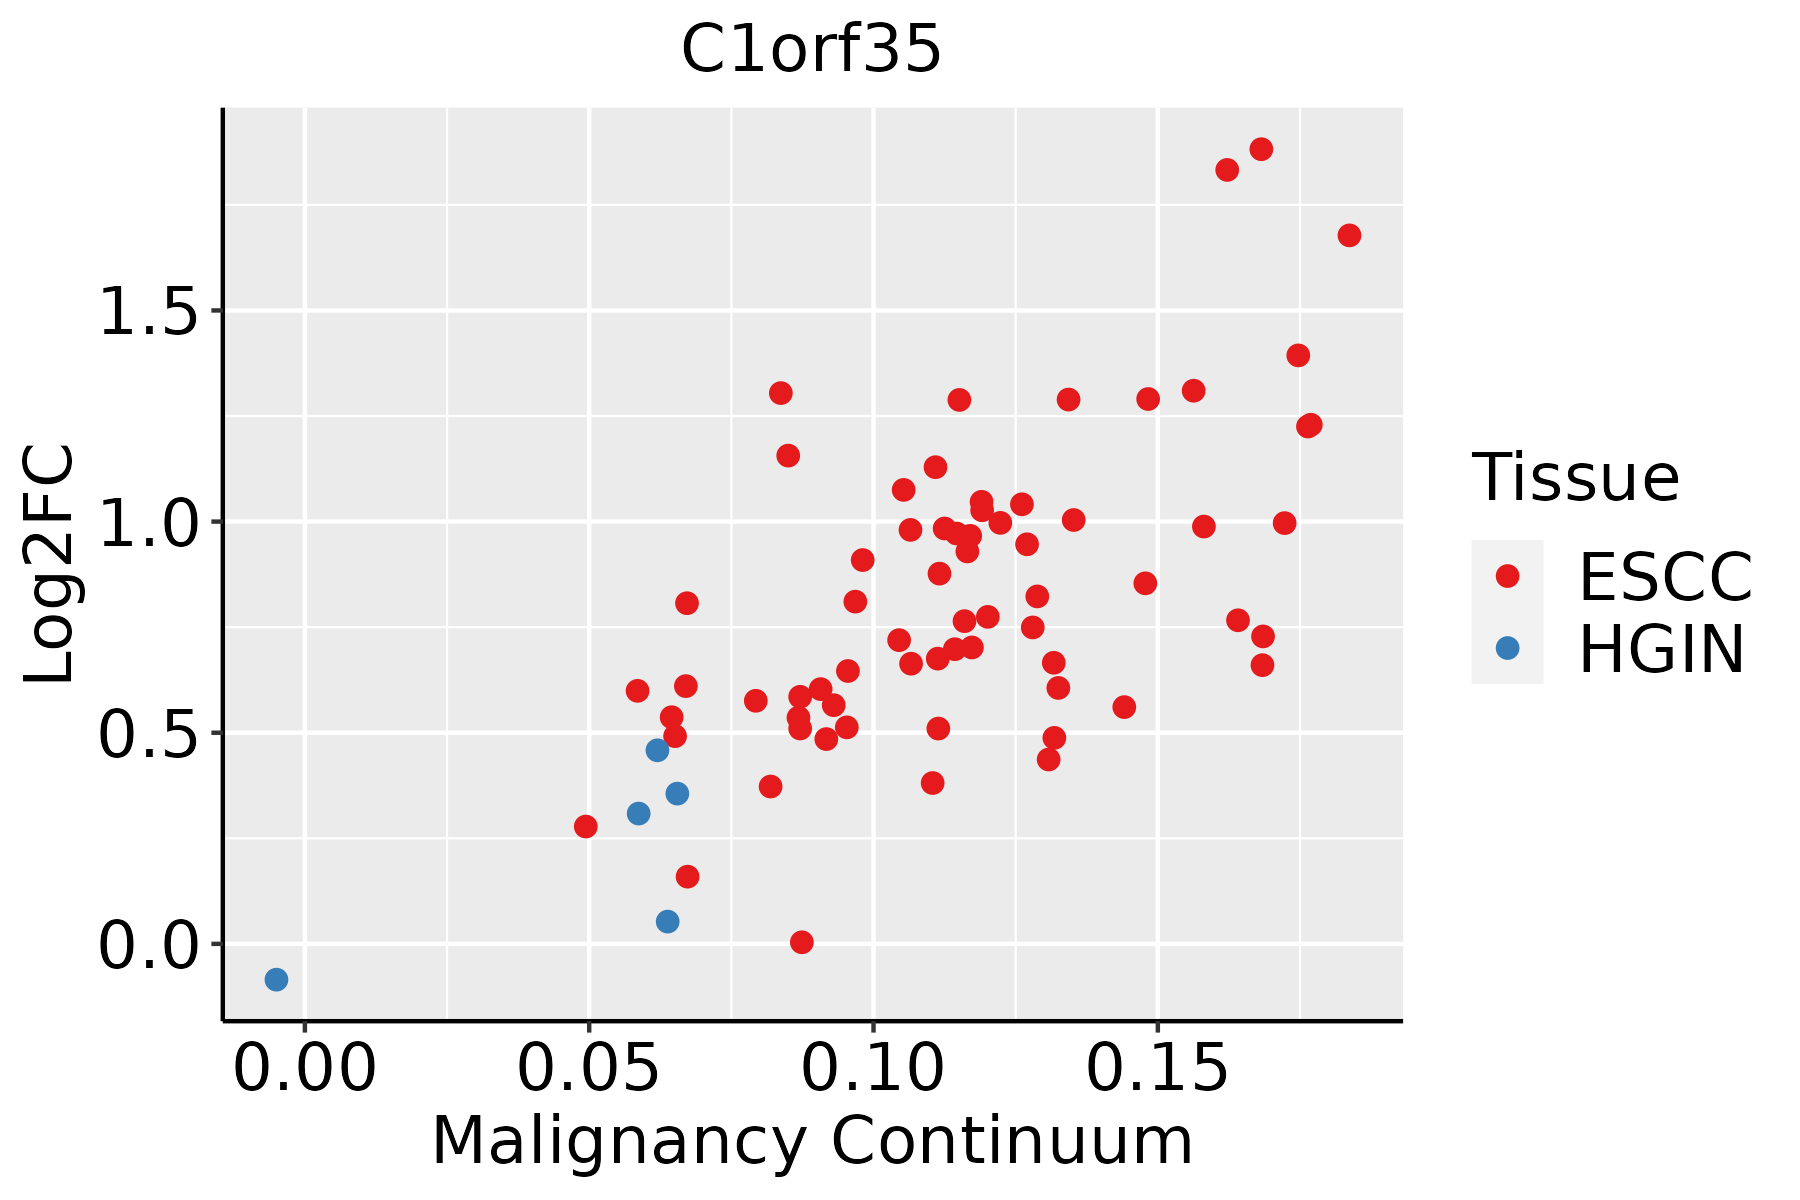 | ESCC: Esophageal squamous cell carcinoma |
| HGIN: High-grade intraepithelial neoplasias | ||
| LGIN: Low-grade intraepithelial neoplasias | ||
| Liver |  | HCC: Hepatocellular carcinoma |
| NAFLD: Non-alcoholic fatty liver disease | ||
| Oral Cavity |  | EOLP: Erosive Oral lichen planus |
| LP: leukoplakia | ||
| NEOLP: Non-erosive oral lichen planus | ||
| OSCC: Oral squamous cell carcinoma | ||
| Prostate |  | BPH: Benign Prostatic Hyperplasia |
| Skin | 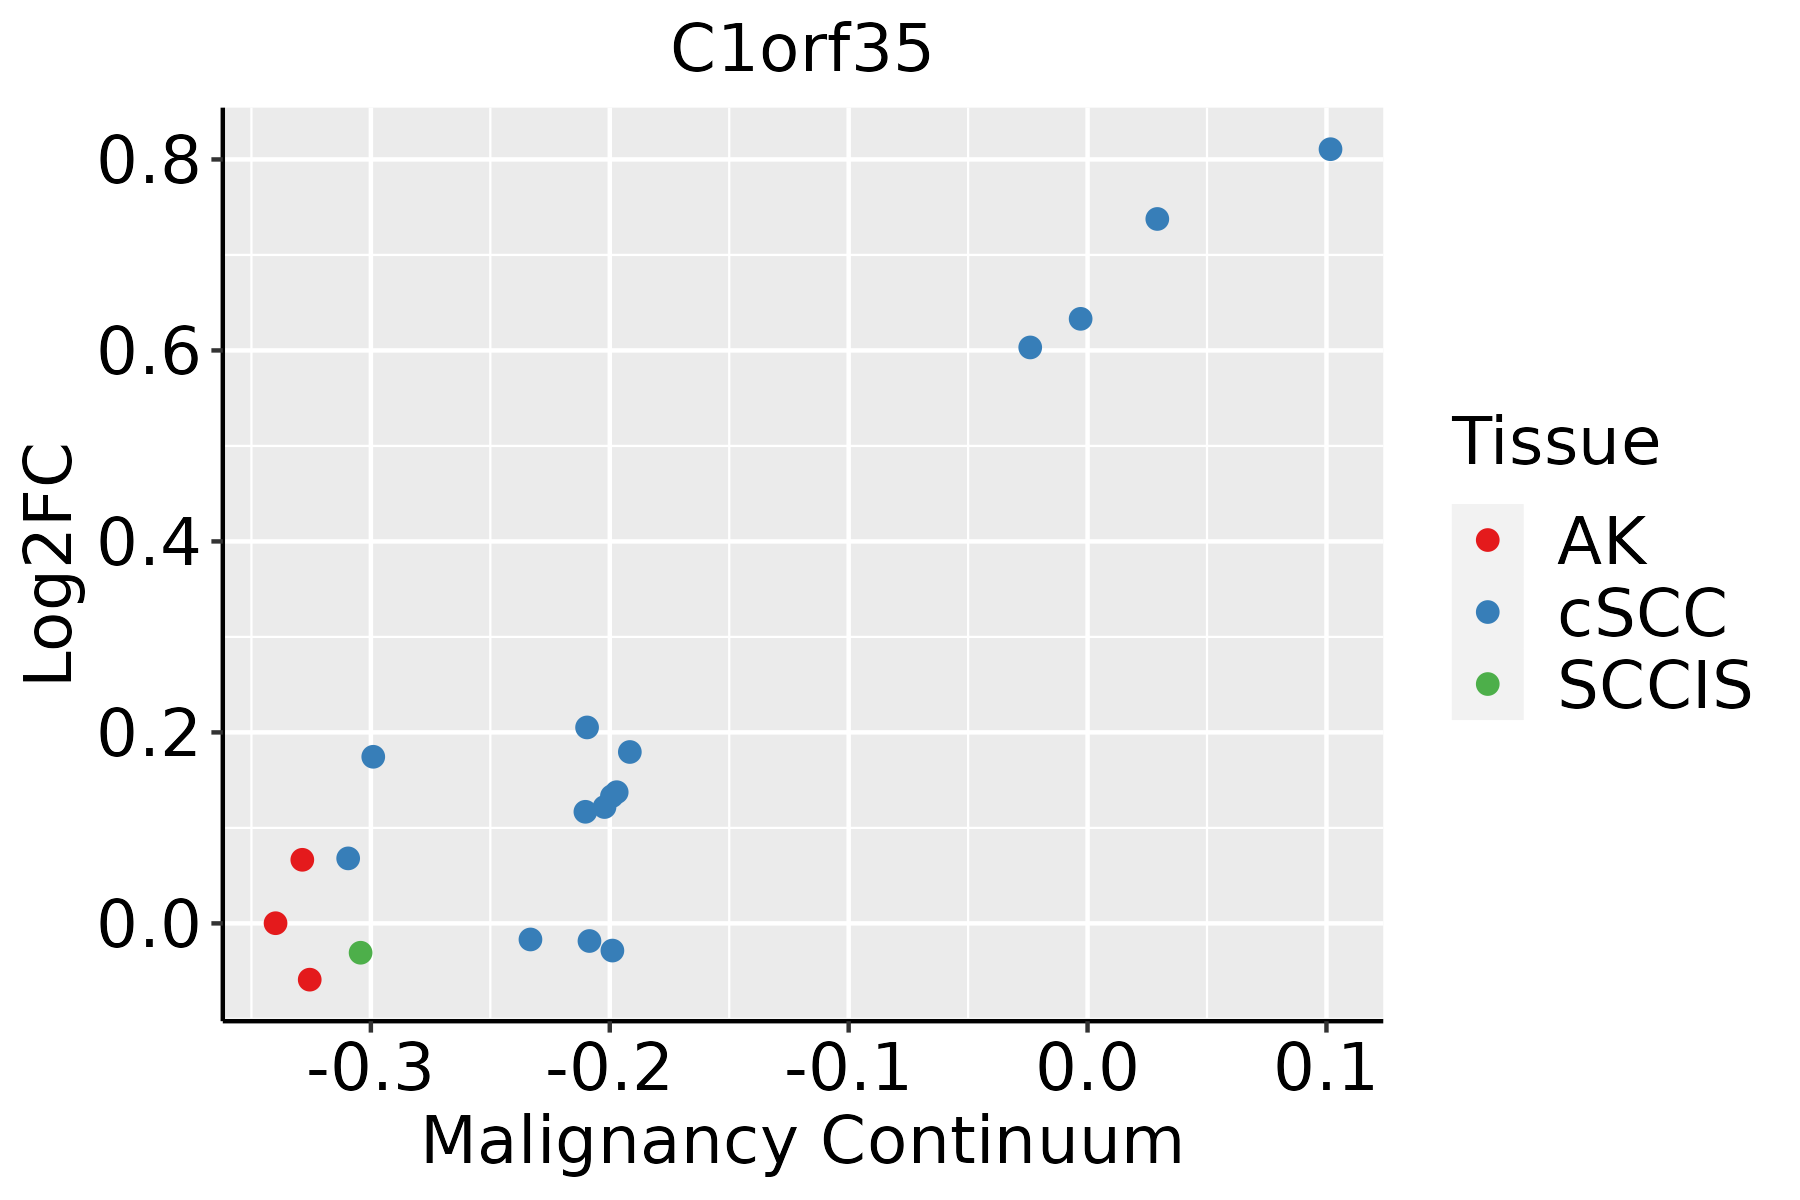 | AK: Actinic keratosis |
| cSCC: Cutaneous squamous cell carcinoma | ||
| SCCIS:squamous cell carcinoma in situ | ||
| Thyroid | 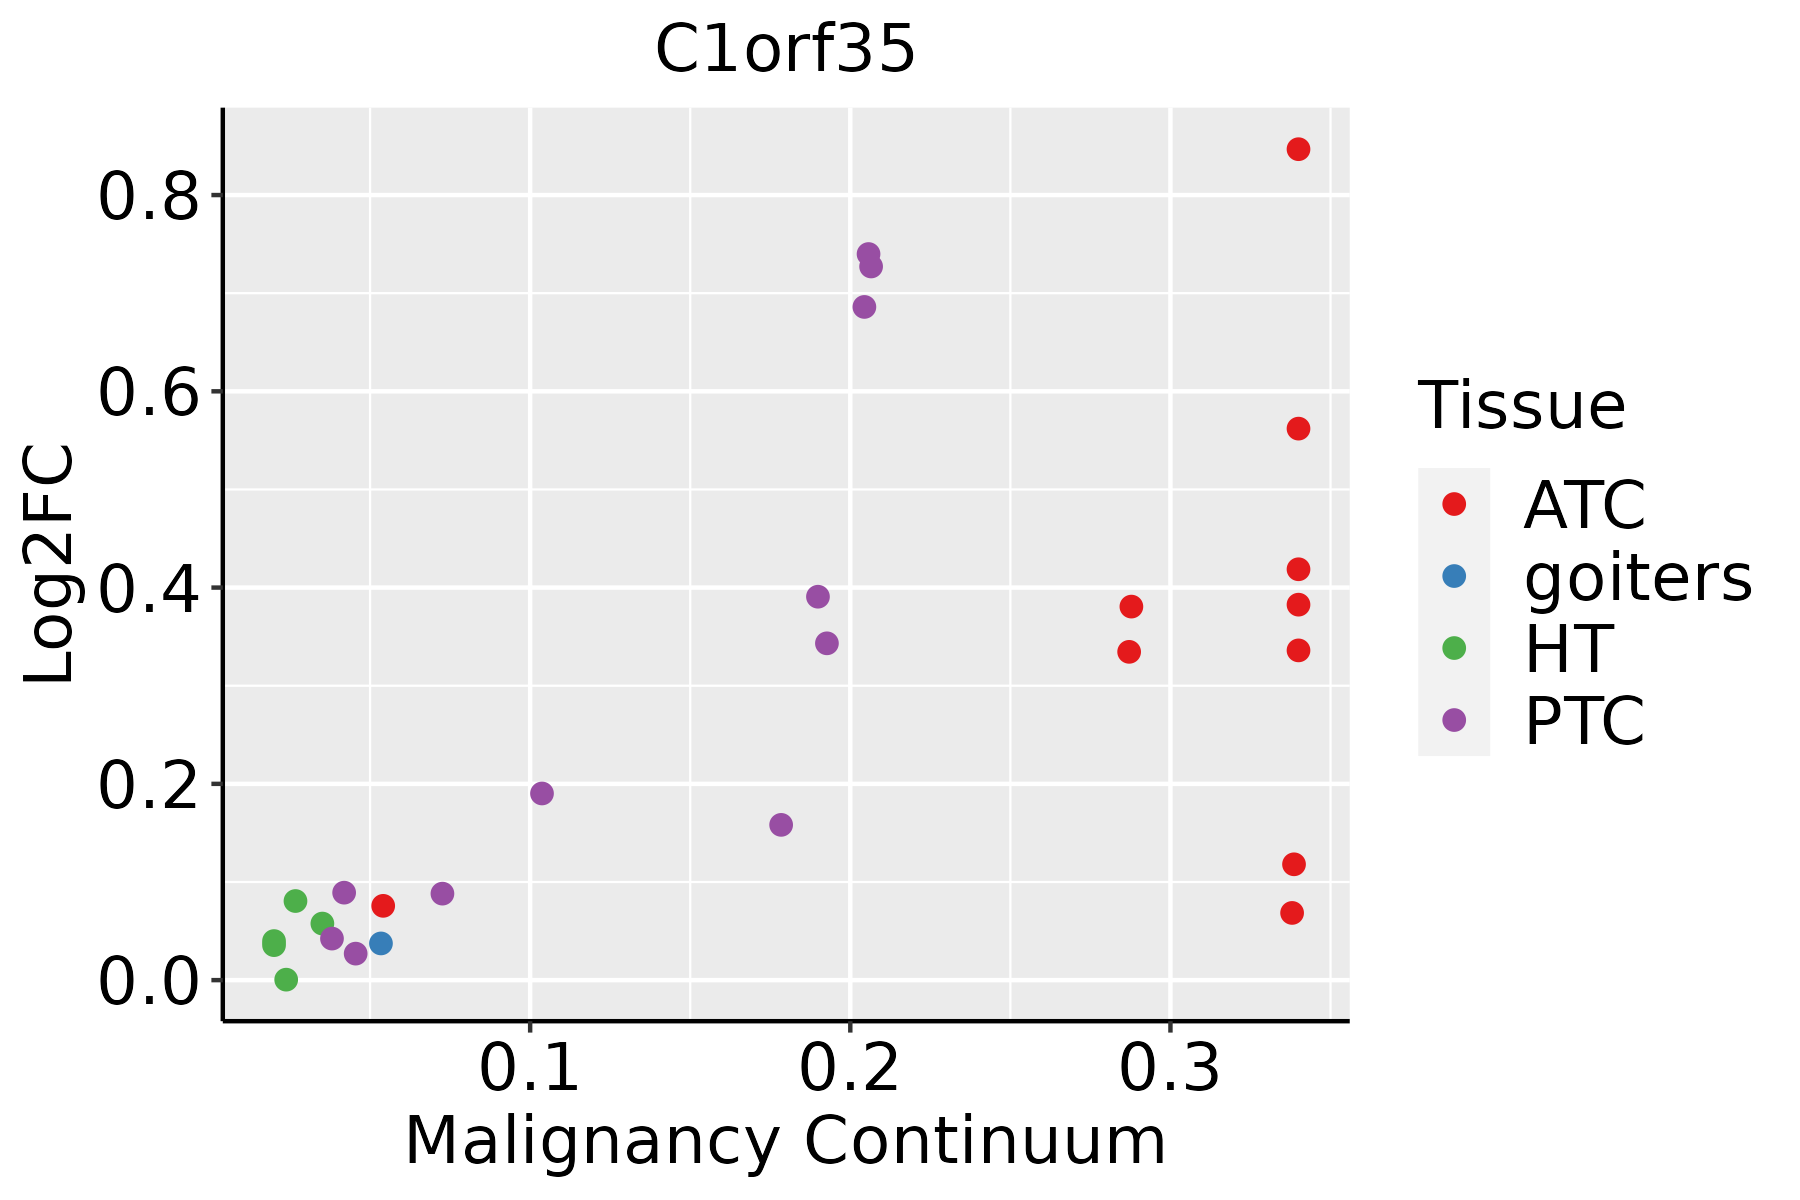 | ATC: Anaplastic thyroid cancer |
| HT: Hashimoto's thyroiditis | ||
| PTC: Papillary thyroid cancer |
| ∗log2FC in expression of this searched gene in stem-like cells from each diseased tissue sample relative to stem-like cells in normal samples in each tissue plotted against the malignancy continuum. Samples are colored based on if they are from different disease stage. |
Top |
Malignant transformation related pathway analysis |
| Find out the enriched GO biological processes and KEGG pathways involved in transition from healthy to precancer to cancer |
| Tissue | Disease Stage | Enriched GO biological Processes |
| Colorectum | AD |  |
| Colorectum | SER |  |
| Colorectum | MSS |  |
| Colorectum | MSI-H |  |
| Colorectum | FAP |  |
| ∗Top 15 enriched GO BP terms are showed in the bar plot of each disease state in each tissue. Each row represents a significant GO biological process which is colored according to the -log10(p.adjust). |
| Page: 1 2 3 4 5 6 7 8 9 |
| GO ID | Tissue | Disease Stage | Description | Gene Ratio | Bg Ratio | pvalue | p.adjust | Count |
| Page: 1 |
| Pathway ID | Tissue | Disease Stage | Description | Gene Ratio | Bg Ratio | pvalue | p.adjust | qvalue | Count |
| Page: 1 |
Top |
Cell-cell communication analysis |
| Identification of potential cell-cell interactions between two cell types and their ligand-receptor pairs for different disease states |
| Ligand | Receptor | LRpair | Pathway | Tissue | Disease Stage |
| Page: 1 |
Top |
Single-cell gene regulatory network inference analysis |
| Find out the significant the regulons (TFs) and the target genes of each regulon across cell types for different disease states |
| TF | Cell Type | Tissue | Disease Stage | Target Gene | RSS | Regulon Activity |
| ∗The dot plots of a searched regulon are shown for all cell subpopulations in each disease state of each tissue based on the regulon specific score inferred using pySCENIC and by calculating the average expression. |
| Page: 1 |
Top |
Somatic mutation of malignant transformation related genes |
| Annotation of somatic variants for genes involved in malignant transformation |
| Hugo Symbol | Variant Class | Variant Classification | dbSNP RS | HGVSc | HGVSp | HGVSp Short | SWISSPROT | BIOTYPE | SIFT | PolyPhen | Tumor Sample Barcode | Tissue | Histology | Sex | Age | Stage | Therapy Types | Drugs | Outcome |
| C1orf35 | SNV | Missense_Mutation | c.280N>A | p.Leu94Met | p.L94M | Q9BU76 | protein_coding | deleterious(0) | probably_damaging(0.994) | TCGA-G4-6320-01 | Colorectum | colon adenocarcinoma | Male | >=65 | III/IV | Chemotherapy | oxaliplatin | SD | |
| C1orf35 | SNV | Missense_Mutation | novel | c.264N>T | p.Lys88Asn | p.K88N | Q9BU76 | protein_coding | tolerated(0.06) | benign(0.146) | TCGA-AP-A1DV-01 | Endometrium | uterine corpus endometrioid carcinoma | Female | <65 | I/II | Unknown | Unknown | SD |
| C1orf35 | SNV | Missense_Mutation | novel | c.550N>G | p.Lys184Glu | p.K184E | Q9BU76 | protein_coding | tolerated(0.28) | probably_damaging(0.968) | TCGA-B5-A3FA-01 | Endometrium | uterine corpus endometrioid carcinoma | Female | >=65 | I/II | Unknown | Unknown | SD |
| C1orf35 | SNV | Missense_Mutation | rs748613886 | c.658T>C | p.Ser220Pro | p.S220P | Q9BU76 | protein_coding | tolerated(0.11) | benign(0.202) | TCGA-B5-A3FC-01 | Endometrium | uterine corpus endometrioid carcinoma | Female | <65 | I/II | Unknown | Unknown | SD |
| C1orf35 | SNV | Missense_Mutation | rs534724964 | c.629N>A | p.Arg210Gln | p.R210Q | Q9BU76 | protein_coding | tolerated(0.07) | benign(0) | TCGA-BG-A222-01 | Endometrium | uterine corpus endometrioid carcinoma | Female | <65 | I/II | Unknown | Unknown | SD |
| C1orf35 | SNV | Missense_Mutation | rs140393278 | c.761N>A | p.Arg254His | p.R254H | Q9BU76 | protein_coding | tolerated_low_confidence(0.48) | benign(0) | TCGA-D1-A103-01 | Endometrium | uterine corpus endometrioid carcinoma | Female | >=65 | I/II | Unknown | Unknown | SD |
| C1orf35 | SNV | Missense_Mutation | novel | c.470G>A | p.Gly157Glu | p.G157E | Q9BU76 | protein_coding | tolerated(0.97) | benign(0.08) | TCGA-UB-AA0U-01 | Liver | liver hepatocellular carcinoma | Male | <65 | I/II | Unknown | Unknown | PD |
| C1orf35 | SNV | Missense_Mutation | c.437N>G | p.Ser146Cys | p.S146C | Q9BU76 | protein_coding | deleterious(0) | possibly_damaging(0.87) | TCGA-69-7760-01 | Lung | lung adenocarcinoma | Male | >=65 | I/II | Chemotherapy | carboplatin | SD | |
| C1orf35 | SNV | Missense_Mutation | novel | c.80N>T | p.Arg27Leu | p.R27L | Q9BU76 | protein_coding | deleterious(0) | probably_damaging(0.99) | TCGA-91-6835-01 | Lung | lung adenocarcinoma | Female | >=65 | I/II | Unknown | Unknown | SD |
| C1orf35 | SNV | Missense_Mutation | novel | c.28N>G | p.Arg10Gly | p.R10G | Q9BU76 | protein_coding | deleterious(0) | probably_damaging(0.998) | TCGA-MF-A522-01 | Lung | lung squamous cell carcinoma | Male | <65 | I/II | Chemotherapy | cisplatin | PD |
| Page: 1 2 |
Top |
Related drugs of malignant transformation related genes |
| Identification of chemicals and drugs interact with genes involved in malignant transfromation |
| (DGIdb 4.0) |
| Entrez ID | Symbol | Category | Interaction Types | Drug Claim Name | Drug Name | PMIDs |
| Page: 1 |

Copyright 2023-Present -The University of Texas Health Science Center at Houston |