| Entrez ID | Symbol | Replicates | Species | Organ | Tissue | Adj P-value | Log2FC | Malignancy |
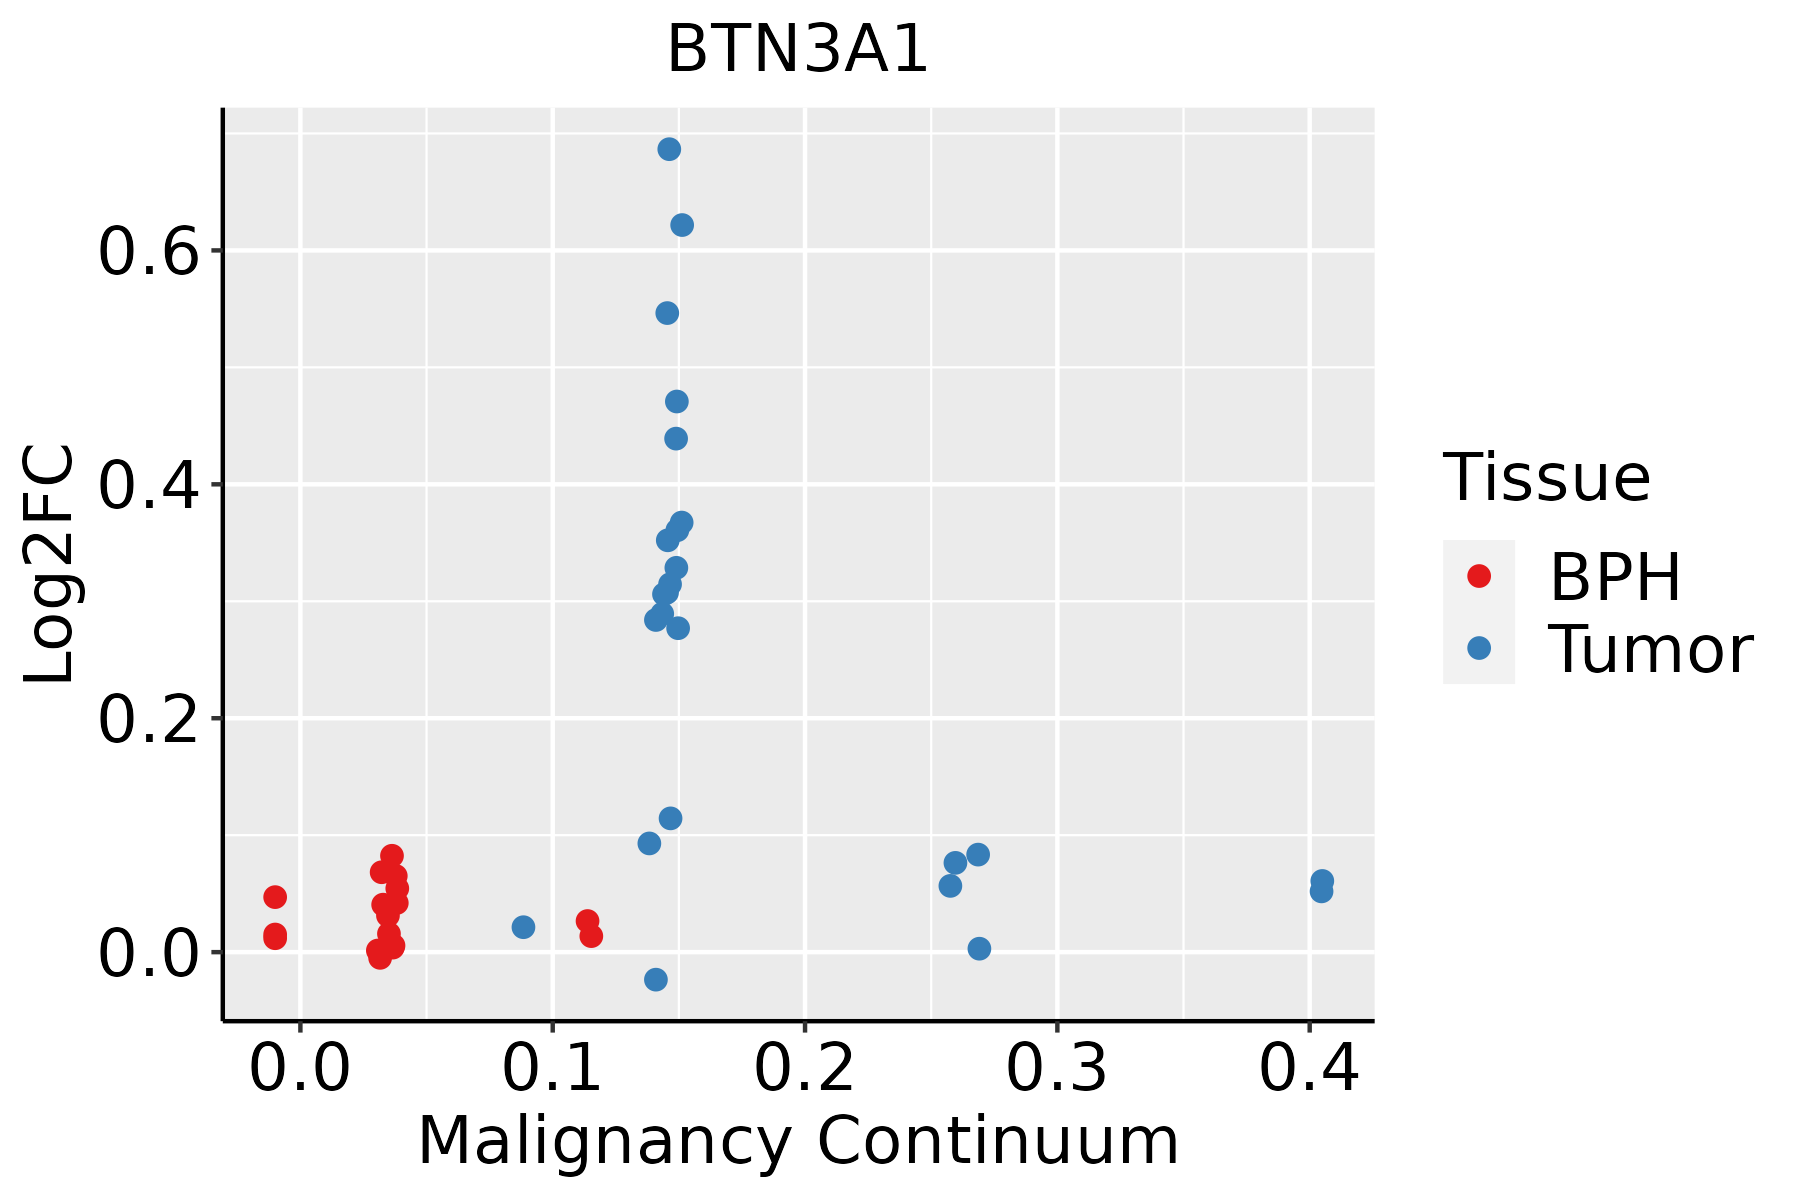
| 11119 | BTN3A1 | Dong_P1 | Human | Prostate | Tumor | 1.55e-06 | 9.57e-02 | 0.035 |
| 11119 | BTN3A1 | Dong_P3 | Human | Prostate | Tumor | 1.24e-04 | 6.93e-02 | 0.0278 |
| 11119 | BTN3A1 | GSM5353217_PA_PB1A_Pool_2_S107_L004 | Human | Prostate | Tumor | 3.28e-02 | 6.78e-01 | 0.156 |
| 11119 | BTN3A1 | GSM5353221_PA_PB2A_Pool_1_3_S25_L001 | Human | Prostate | Tumor | 4.43e-17 | 6.22e-01 | 0.1633 |
| 11119 | BTN3A1 | GSM5353222_PA_PB2B_Pool_1_3_S52_L002 | Human | Prostate | Tumor | 1.09e-05 | 3.29e-01 | 0.1608 |
| 11119 | BTN3A1 | GSM5353223_PA_PB2B_Pool_2_S26_L001 | Human | Prostate | Tumor | 3.18e-08 | 4.71e-01 | 0.1604 |
| 11119 | BTN3A1 | GSM5353224_PA_PR5186_Pool_1_2_3_S27_L001 | Human | Prostate | Tumor | 4.94e-04 | 2.77e-01 | 0.1621 |
| 11119 | BTN3A1 | GSM5353225_PA_PR5196-1_Pool_1_2_3_S53_L002 | Human | Prostate | Tumor | 1.24e-07 | 6.87e-01 | 0.1619 |
| 11119 | BTN3A1 | GSM5353226_PA_PR5196-2_Pool_1_2_3_S54_L002 | Human | Prostate | Tumor | 6.68e-04 | 5.46e-01 | 0.159 |
| 11119 | BTN3A1 | GSM5353227_PA_PR5199-193K_Pool_1_2_3_S55_L002 | Human | Prostate | Tumor | 1.18e-02 | 3.15e-01 | 0.1602 |
| 11119 | BTN3A1 | GSM5353240_PA_PR5254_T1_S15_L001 | Human | Prostate | Tumor | 8.64e-04 | 3.06e-01 | 0.1575 |
| 11119 | BTN3A1 | GSM5353243_PA_PR5261_T1_S23_L002 | Human | Prostate | Tumor | 2.45e-02 | 2.84e-01 | 0.1545 |
| GO ID | Tissue | Disease Stage | Description | Gene Ratio | Bg Ratio | pvalue | p.adjust | Count |
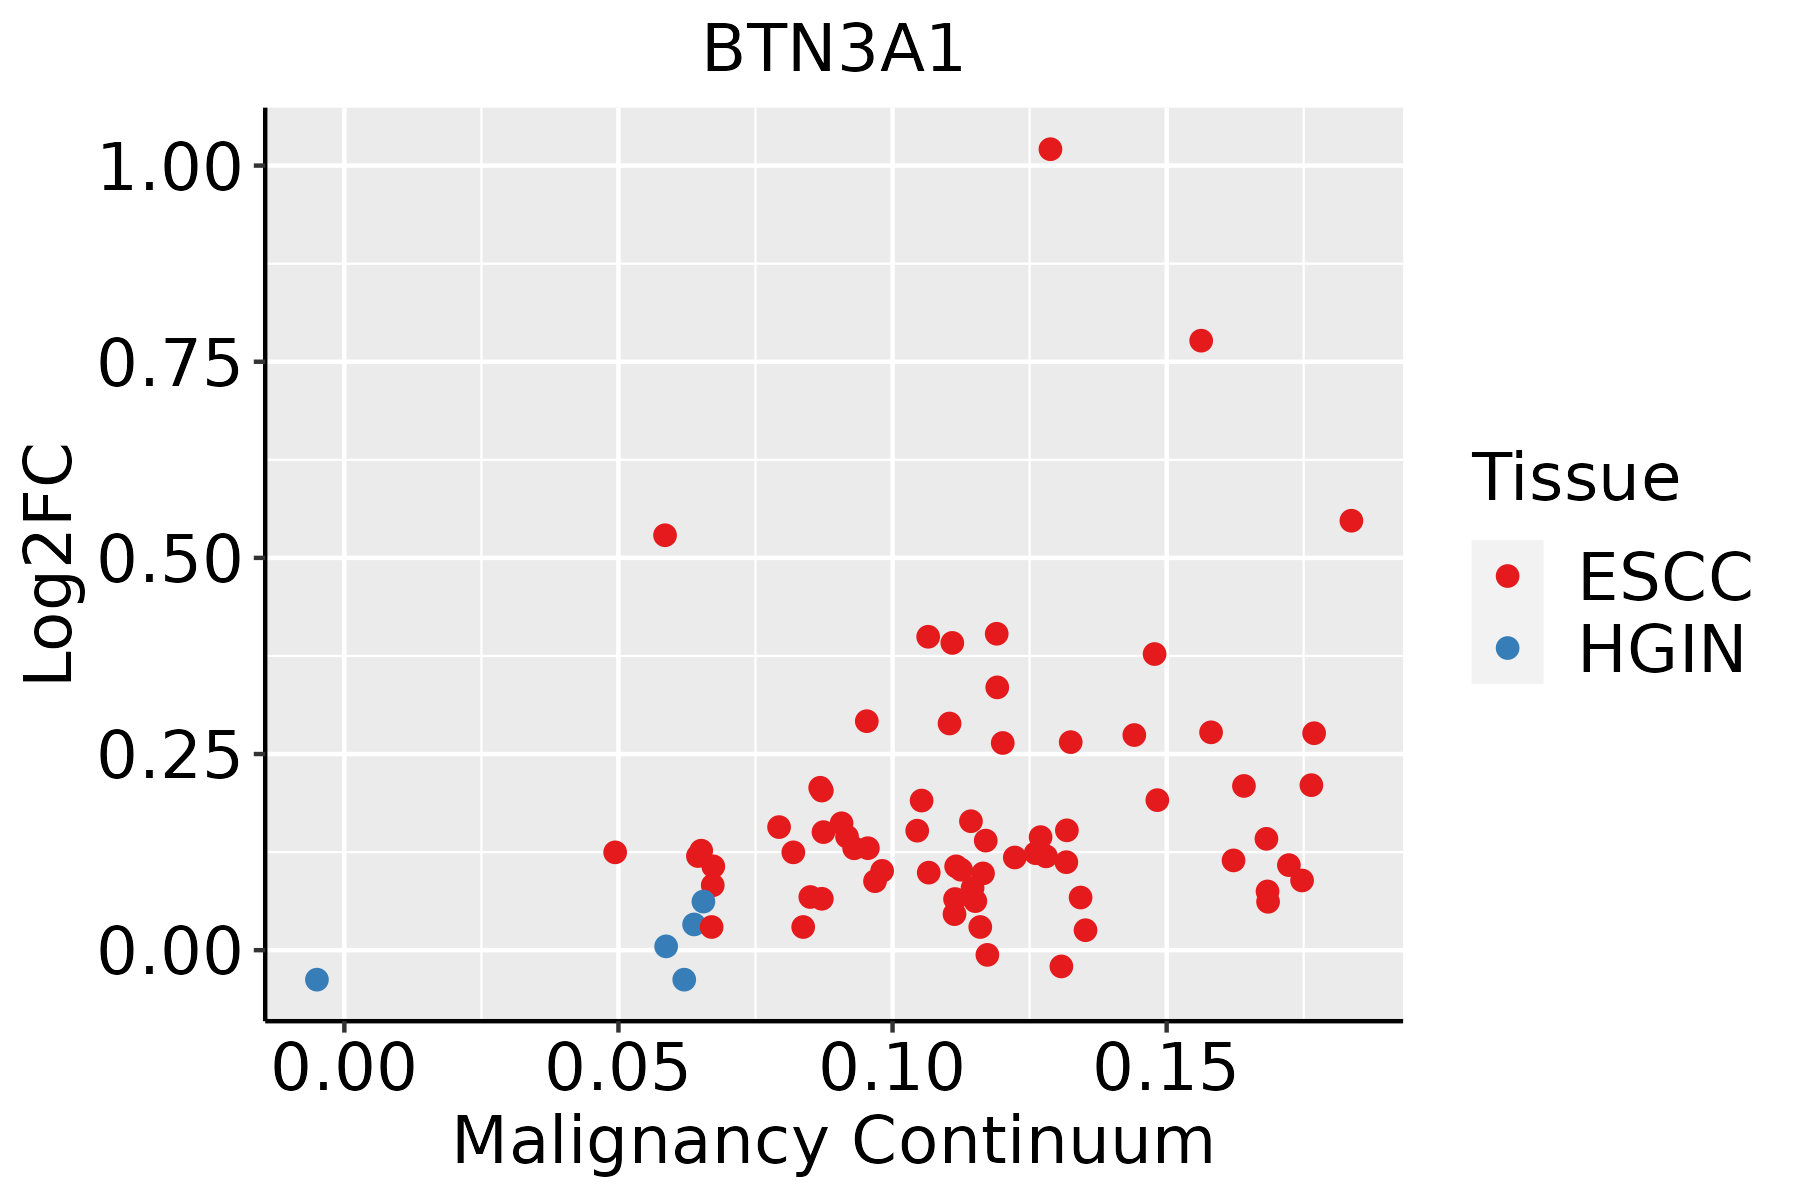
| GO:004211018 | Esophagus | ESCC | T cell activation | 256/8552 | 487/18723 | 1.18e-03 | 5.87e-03 | 256 |
| GO:00508528 | Esophagus | ESCC | T cell receptor signaling pathway | 73/8552 | 123/18723 | 1.54e-03 | 7.24e-03 | 73 |
| GO:000181916 | Esophagus | ESCC | positive regulation of cytokine production | 244/8552 | 467/18723 | 2.29e-03 | 1.01e-02 | 244 |
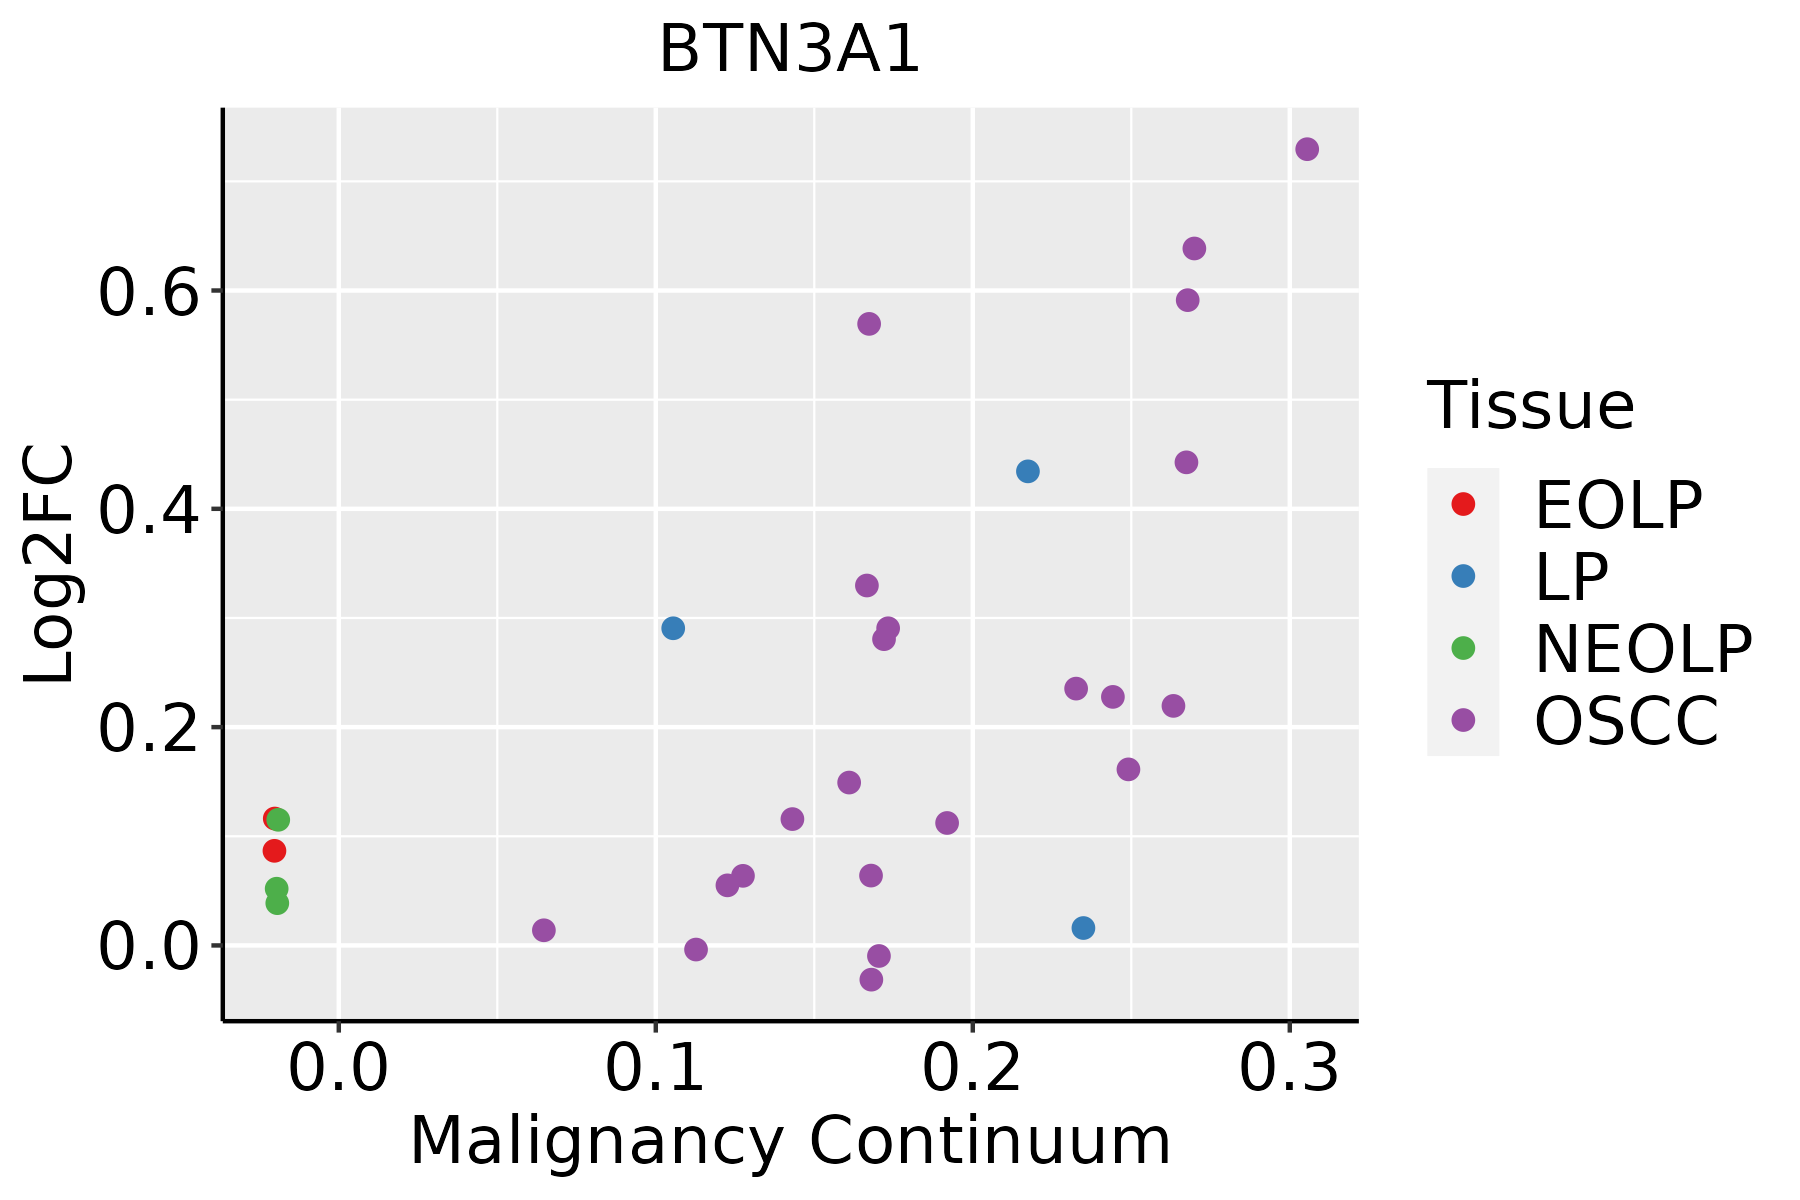
| GO:004211016 | Oral cavity | OSCC | T cell activation | 245/7305 | 487/18723 | 2.00e-07 | 3.22e-06 | 245 |
| GO:00508527 | Oral cavity | OSCC | T cell receptor signaling pathway | 68/7305 | 123/18723 | 1.80e-04 | 1.22e-03 | 68 |
| GO:004209816 | Oral cavity | OSCC | T cell proliferation | 100/7305 | 199/18723 | 7.93e-04 | 4.27e-03 | 100 |
| GO:000181910 | Oral cavity | OSCC | positive regulation of cytokine production | 213/7305 | 467/18723 | 1.93e-03 | 8.96e-03 | 213 |
| GO:00027646 | Oral cavity | OSCC | immune response-regulating signaling pathway | 212/7305 | 468/18723 | 2.93e-03 | 1.27e-02 | 212 |
| GO:00706618 | Oral cavity | OSCC | leukocyte proliferation | 145/7305 | 318/18723 | 9.31e-03 | 3.33e-02 | 145 |
| GO:00466517 | Oral cavity | OSCC | lymphocyte proliferation | 131/7305 | 288/18723 | 1.41e-02 | 4.67e-02 | 131 |
| GO:004211017 | Oral cavity | LP | T cell activation | 146/4623 | 487/18723 | 4.13e-03 | 2.66e-02 | 146 |
| GO:000276413 | Oral cavity | EOLP | immune response-regulating signaling pathway | 108/2218 | 468/18723 | 4.04e-12 | 7.34e-10 | 108 |
| GO:004211023 | Oral cavity | EOLP | T cell activation | 111/2218 | 487/18723 | 4.67e-12 | 8.17e-10 | 111 |
| GO:00027683 | Oral cavity | EOLP | immune response-regulating cell surface receptor signaling pathway | 66/2218 | 315/18723 | 2.44e-06 | 5.45e-05 | 66 |
| GO:005085214 | Oral cavity | EOLP | T cell receptor signaling pathway | 33/2218 | 123/18723 | 4.19e-06 | 8.76e-05 | 33 |
| GO:007066112 | Oral cavity | EOLP | leukocyte proliferation | 65/2218 | 318/18723 | 6.86e-06 | 1.33e-04 | 65 |
| GO:000181915 | Oral cavity | EOLP | positive regulation of cytokine production | 87/2218 | 467/18723 | 1.08e-05 | 1.92e-04 | 87 |
| GO:00024292 | Oral cavity | EOLP | immune response-activating cell surface receptor signaling pathway | 60/2218 | 291/18723 | 1.16e-05 | 2.00e-04 | 60 |
| GO:00027572 | Oral cavity | EOLP | immune response-activating signal transduction | 60/2218 | 291/18723 | 1.16e-05 | 2.00e-04 | 60 |
| GO:00022534 | Oral cavity | EOLP | activation of immune response | 72/2218 | 375/18723 | 2.18e-05 | 3.35e-04 | 72 |
| Hugo Symbol | Variant Class | Variant Classification | dbSNP RS | HGVSc | HGVSp | HGVSp Short | SWISSPROT | BIOTYPE | SIFT | PolyPhen | Tumor Sample Barcode | Tissue | Histology | Sex | Age | Stage | Therapy Types | Drugs | Outcome |
| BTN3A1 | SNV | Missense_Mutation | | c.944N>T | p.Arg315Ile | p.R315I | O00481 | protein_coding | deleterious(0.02) | benign(0.003) | TCGA-A2-A25A-01 | Breast | breast invasive carcinoma | Female | <65 | I/II | Unspecific | Cytoxan | SD |
| BTN3A1 | SNV | Missense_Mutation | novel | c.100N>T | p.Leu34Phe | p.L34F | O00481 | protein_coding | tolerated(0.06) | possibly_damaging(0.812) | TCGA-AN-A0AK-01 | Breast | breast invasive carcinoma | Female | >=65 | I/II | Unknown | Unknown | SD |
| BTN3A1 | SNV | Missense_Mutation | | c.139G>C | p.Asp47His | p.D47H | O00481 | protein_coding | deleterious(0.01) | probably_damaging(0.979) | TCGA-BH-A0AW-01 | Breast | breast invasive carcinoma | Female | <65 | I/II | Chemotherapy | carboplatin | SD |
| BTN3A1 | SNV | Missense_Mutation | | c.206N>C | p.Ser69Thr | p.S69T | O00481 | protein_coding | deleterious(0) | possibly_damaging(0.527) | TCGA-BH-A0H9-01 | Breast | breast invasive carcinoma | Female | >=65 | I/II | Hormone Therapy | arimidex | SD |
| BTN3A1 | SNV | Missense_Mutation | | c.802N>G | p.Tyr268Asp | p.Y268D | O00481 | protein_coding | tolerated(0.07) | benign(0.272) | TCGA-E2-A15S-01 | Breast | breast invasive carcinoma | Female | <65 | I/II | Chemotherapy | doxorubicin | SD |
| BTN3A1 | insertion | Frame_Shift_Ins | novel | c.381_382insAATAATTA | p.Phe128AsnfsTer17 | p.F128Nfs*17 | O00481 | protein_coding | | | TCGA-B6-A0IB-01 | Breast | breast invasive carcinoma | Female | <65 | III/IV | Unknown | Unknown | PD |
| BTN3A1 | deletion | Frame_Shift_Del | rs35139329 | c.833delA | p.Lys278ArgfsTer13 | p.K278Rfs*13 | O00481 | protein_coding | | | TCGA-BH-A0HA-01 | Breast | breast invasive carcinoma | Female | <65 | I/II | Unknown | Unknown | SD |
| BTN3A1 | deletion | Frame_Shift_Del | novel | c.1375delN | p.Val460TrpfsTer42 | p.V460Wfs*42 | O00481 | protein_coding | | | TCGA-PL-A8LY-01 | Breast | breast invasive carcinoma | Female | <65 | I/II | Unknown | Unknown | SD |
| BTN3A1 | SNV | Missense_Mutation | rs754276670 | c.682G>A | p.Gly228Ser | p.G228S | O00481 | protein_coding | tolerated(0.33) | benign(0.02) | TCGA-EA-A410-01 | Cervix | cervical & endocervical cancer | Female | <65 | I/II | Unknown | Unknown | SD |
| BTN3A1 | SNV | Missense_Mutation | | c.974G>C | p.Arg325Thr | p.R325T | O00481 | protein_coding | deleterious(0.02) | benign(0.026) | TCGA-Q1-A73O-01 | Cervix | cervical & endocervical cancer | Female | <65 | I/II | Chemotherapy | cisplatin | CR |