
|
|||||
|
 | |
| |
| |
| |
| |
| |
|
Gene: BRI3BP |
Gene summary for BRI3BP |
| Gene information | Species | Human | Gene symbol | BRI3BP | Gene ID | 140707 |
| Gene name | BRI3 binding protein | |
| Gene Alias | BNAS1 | |
| Cytomap | 12q24.31 | |
| Gene Type | protein-coding | GO ID | GO:0005575 | UniProtAcc | Q8WY22 |
Top |
Malignant transformation analysis |
| Identification of the aberrant gene expression in precancerous and cancerous lesions by comparing the gene expression of stem-like cells in diseased tissues with normal stem cells |
| Entrez ID | Symbol | Replicates | Species | Organ | Tissue | Adj P-value | Log2FC | Malignancy |
| 140707 | BRI3BP | S014 | Human | Liver | HCC | 1.48e-19 | 7.56e-01 | 0.2254 |
| 140707 | BRI3BP | S015 | Human | Liver | HCC | 3.89e-14 | 5.65e-01 | 0.2375 |
| 140707 | BRI3BP | S016 | Human | Liver | HCC | 7.15e-15 | 6.22e-01 | 0.2243 |
| 140707 | BRI3BP | S027 | Human | Liver | HCC | 9.08e-13 | 8.69e-01 | 0.2446 |
| 140707 | BRI3BP | S028 | Human | Liver | HCC | 5.18e-22 | 1.00e+00 | 0.2503 |
| 140707 | BRI3BP | S029 | Human | Liver | HCC | 5.06e-18 | 8.90e-01 | 0.2581 |
| 140707 | BRI3BP | C04 | Human | Oral cavity | OSCC | 3.00e-12 | 5.91e-01 | 0.2633 |
| 140707 | BRI3BP | C21 | Human | Oral cavity | OSCC | 1.15e-34 | 1.07e+00 | 0.2678 |
| 140707 | BRI3BP | C30 | Human | Oral cavity | OSCC | 2.44e-21 | 1.09e+00 | 0.3055 |
| 140707 | BRI3BP | C43 | Human | Oral cavity | OSCC | 1.63e-15 | 3.40e-01 | 0.1704 |
| 140707 | BRI3BP | C46 | Human | Oral cavity | OSCC | 3.53e-05 | 1.64e-01 | 0.1673 |
| 140707 | BRI3BP | C51 | Human | Oral cavity | OSCC | 4.82e-11 | 5.89e-01 | 0.2674 |
| 140707 | BRI3BP | C57 | Human | Oral cavity | OSCC | 6.25e-09 | 4.28e-01 | 0.1679 |
| 140707 | BRI3BP | C06 | Human | Oral cavity | OSCC | 1.22e-02 | 5.49e-01 | 0.2699 |
| 140707 | BRI3BP | C08 | Human | Oral cavity | OSCC | 6.51e-09 | 3.06e-01 | 0.1919 |
| 140707 | BRI3BP | LN22 | Human | Oral cavity | OSCC | 4.66e-08 | 1.02e+00 | 0.1733 |
| 140707 | BRI3BP | SYSMH1 | Human | Oral cavity | OSCC | 3.17e-09 | 2.80e-01 | 0.1127 |
| 140707 | BRI3BP | SYSMH2 | Human | Oral cavity | OSCC | 1.44e-10 | 4.33e-01 | 0.2326 |
| 140707 | BRI3BP | SYSMH3 | Human | Oral cavity | OSCC | 3.21e-36 | 7.98e-01 | 0.2442 |
| 140707 | BRI3BP | SYSMH5 | Human | Oral cavity | OSCC | 2.69e-05 | 2.16e-01 | 0.0647 |
| Page: 1 2 3 4 |
| Tissue | Expression Dynamics | Abbreviation |
| Colorectum (GSE201348) |  | FAP: Familial adenomatous polyposis |
| CRC: Colorectal cancer | ||
| Colorectum (HTA11) |  | AD: Adenomas |
| SER: Sessile serrated lesions | ||
| MSI-H: Microsatellite-high colorectal cancer | ||
| MSS: Microsatellite stable colorectal cancer | ||
| Esophagus | 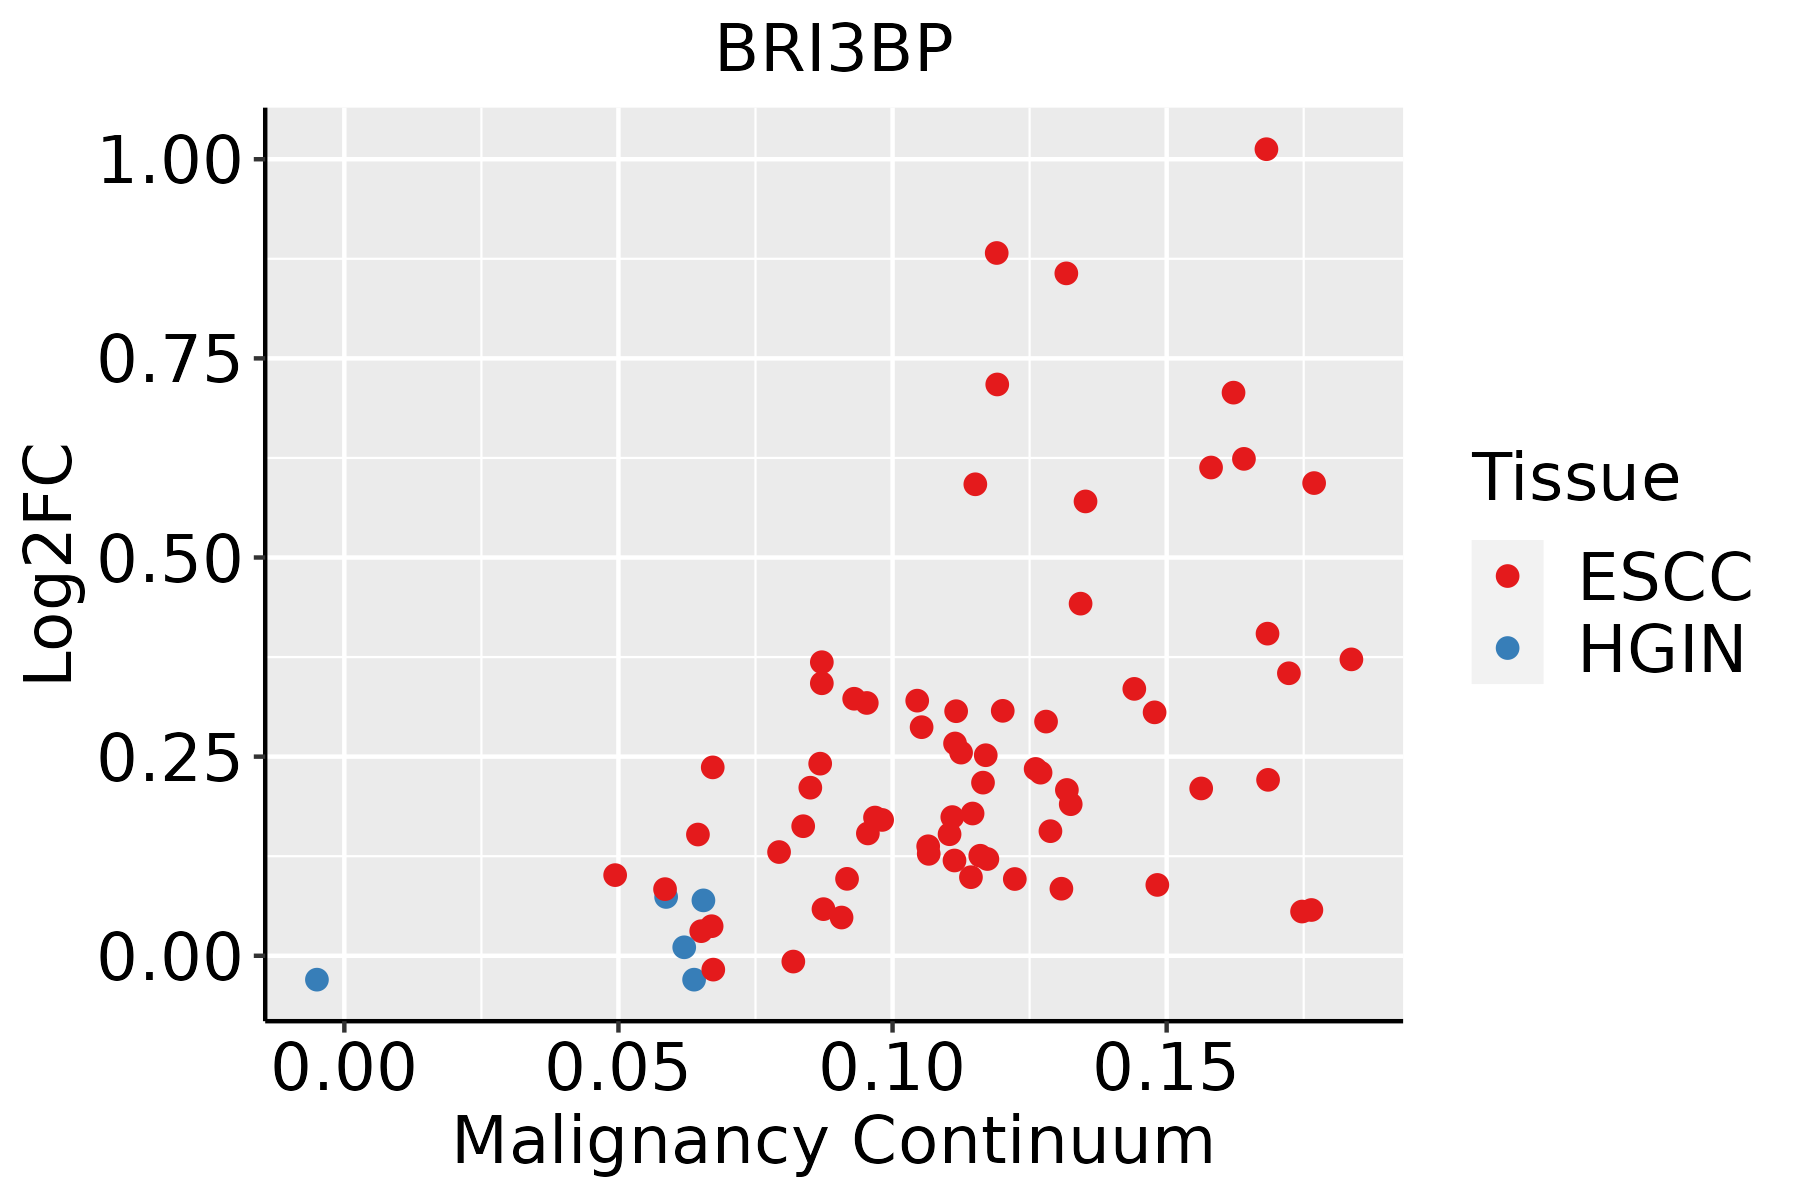 | ESCC: Esophageal squamous cell carcinoma |
| HGIN: High-grade intraepithelial neoplasias | ||
| LGIN: Low-grade intraepithelial neoplasias | ||
| Liver |  | HCC: Hepatocellular carcinoma |
| NAFLD: Non-alcoholic fatty liver disease | ||
| Oral Cavity |  | EOLP: Erosive Oral lichen planus |
| LP: leukoplakia | ||
| NEOLP: Non-erosive oral lichen planus | ||
| OSCC: Oral squamous cell carcinoma |
| ∗log2FC in expression of this searched gene in stem-like cells from each diseased tissue sample relative to stem-like cells in normal samples in each tissue plotted against the malignancy continuum. Samples are colored based on if they are from different disease stage. |
Top |
Malignant transformation related pathway analysis |
| Find out the enriched GO biological processes and KEGG pathways involved in transition from healthy to precancer to cancer |
| Tissue | Disease Stage | Enriched GO biological Processes |
| Colorectum | AD |  |
| Colorectum | SER |  |
| Colorectum | MSS |  |
| Colorectum | MSI-H |  |
| Colorectum | FAP |  |
| ∗Top 15 enriched GO BP terms are showed in the bar plot of each disease state in each tissue. Each row represents a significant GO biological process which is colored according to the -log10(p.adjust). |
| Page: 1 2 3 4 5 6 7 8 9 |
| GO ID | Tissue | Disease Stage | Description | Gene Ratio | Bg Ratio | pvalue | p.adjust | Count |
| Page: 1 |
| Pathway ID | Tissue | Disease Stage | Description | Gene Ratio | Bg Ratio | pvalue | p.adjust | qvalue | Count |
| Page: 1 |
Top |
Cell-cell communication analysis |
| Identification of potential cell-cell interactions between two cell types and their ligand-receptor pairs for different disease states |
| Ligand | Receptor | LRpair | Pathway | Tissue | Disease Stage |
| Page: 1 |
Top |
Single-cell gene regulatory network inference analysis |
| Find out the significant the regulons (TFs) and the target genes of each regulon across cell types for different disease states |
| TF | Cell Type | Tissue | Disease Stage | Target Gene | RSS | Regulon Activity |
| ∗The dot plots of a searched regulon are shown for all cell subpopulations in each disease state of each tissue based on the regulon specific score inferred using pySCENIC and by calculating the average expression. |
| Page: 1 |
Top |
Somatic mutation of malignant transformation related genes |
| Annotation of somatic variants for genes involved in malignant transformation |
| Hugo Symbol | Variant Class | Variant Classification | dbSNP RS | HGVSc | HGVSp | HGVSp Short | SWISSPROT | BIOTYPE | SIFT | PolyPhen | Tumor Sample Barcode | Tissue | Histology | Sex | Age | Stage | Therapy Types | Drugs | Outcome |
| BRI3BP | SNV | Missense_Mutation | c.394N>A | p.Val132Ile | p.V132I | Q8WY22 | protein_coding | tolerated(0.25) | benign(0.041) | TCGA-A6-A565-01 | Colorectum | colon adenocarcinoma | Female | <65 | III/IV | Unspecific | 5FU | PD | |
| BRI3BP | SNV | Missense_Mutation | c.388N>A | p.Gly130Ser | p.G130S | Q8WY22 | protein_coding | deleterious(0.03) | possibly_damaging(0.871) | TCGA-AG-3892-01 | Colorectum | rectum adenocarcinoma | Female | <65 | I/II | Unknown | Unknown | SD | |
| BRI3BP | SNV | Missense_Mutation | novel | c.410N>T | p.Trp137Leu | p.W137L | Q8WY22 | protein_coding | deleterious(0) | probably_damaging(0.997) | TCGA-AP-A059-01 | Endometrium | uterine corpus endometrioid carcinoma | Female | >=65 | I/II | Unknown | Unknown | SD |
| BRI3BP | SNV | Missense_Mutation | c.316N>A | p.Val106Ile | p.V106I | Q8WY22 | protein_coding | deleterious(0.05) | benign(0.123) | TCGA-AX-A1CE-01 | Endometrium | uterine corpus endometrioid carcinoma | Female | <65 | I/II | Unspecific | Paclitaxel | SD | |
| BRI3BP | SNV | Missense_Mutation | c.658N>A | p.Val220Met | p.V220M | Q8WY22 | protein_coding | tolerated_low_confidence(0.06) | benign(0.07) | TCGA-BS-A0TC-01 | Endometrium | uterine corpus endometrioid carcinoma | Female | >=65 | I/II | Unknown | Unknown | SD | |
| BRI3BP | SNV | Missense_Mutation | rs779314883 | c.373N>A | p.Ala125Thr | p.A125T | Q8WY22 | protein_coding | tolerated(0.12) | possibly_damaging(0.69) | TCGA-D1-A17Q-01 | Endometrium | uterine corpus endometrioid carcinoma | Female | <65 | I/II | Unknown | Unknown | SD |
| BRI3BP | SNV | Missense_Mutation | rs752859936 | c.595N>C | p.Gly199Arg | p.G199R | Q8WY22 | protein_coding | deleterious_low_confidence(0) | probably_damaging(1) | TCGA-DF-A2KN-01 | Endometrium | uterine corpus endometrioid carcinoma | Female | Unknown | I/II | Unknown | Unknown | SD |
| BRI3BP | SNV | Missense_Mutation | c.638G>A | p.Ser213Asn | p.S213N | Q8WY22 | protein_coding | tolerated_low_confidence(0.09) | benign(0.242) | TCGA-EC-A1QX-01 | Endometrium | uterine corpus endometrioid carcinoma | Female | >=65 | I/II | Chemotherapy | cyclophosphamide | PD | |
| BRI3BP | SNV | Missense_Mutation | c.316N>A | p.Val106Ile | p.V106I | Q8WY22 | protein_coding | deleterious(0.05) | benign(0.123) | TCGA-EO-A22U-01 | Endometrium | uterine corpus endometrioid carcinoma | Female | >=65 | I/II | Unknown | Unknown | SD | |
| BRI3BP | SNV | Missense_Mutation | novel | c.538G>A | p.Glu180Lys | p.E180K | Q8WY22 | protein_coding | deleterious(0.02) | possibly_damaging(0.749) | TCGA-55-8506-01 | Lung | lung adenocarcinoma | Female | <65 | I/II | Unknown | Unknown | SD |
| Page: 1 2 |
Top |
Related drugs of malignant transformation related genes |
| Identification of chemicals and drugs interact with genes involved in malignant transfromation |
| (DGIdb 4.0) |
| Entrez ID | Symbol | Category | Interaction Types | Drug Claim Name | Drug Name | PMIDs |
| Page: 1 |

Copyright 2023-Present -The University of Texas Health Science Center at Houston |