
|
|||||
|
 | |
| |
| |
| |
| |
| |
|
Gene: B9D2 |
Gene summary for B9D2 |
| Gene information | Species | Human | Gene symbol | B9D2 | Gene ID | 80776 |
| Gene name | B9 domain containing 2 | |
| Gene Alias | ICIS-1 | |
| Cytomap | 19q13.2 | |
| Gene Type | protein-coding | GO ID | GO:0006996 | UniProtAcc | Q9BPU9 |
Top |
Malignant transformation analysis |
| Identification of the aberrant gene expression in precancerous and cancerous lesions by comparing the gene expression of stem-like cells in diseased tissues with normal stem cells |
| Entrez ID | Symbol | Replicates | Species | Organ | Tissue | Adj P-value | Log2FC | Malignancy |
| 80776 | B9D2 | LN22 | Human | Oral cavity | OSCC | 2.23e-07 | 8.75e-01 | 0.1733 |
| 80776 | B9D2 | LN38 | Human | Oral cavity | OSCC | 4.77e-03 | 6.47e-01 | 0.168 |
| 80776 | B9D2 | LN46 | Human | Oral cavity | OSCC | 4.74e-03 | 2.23e-01 | 0.1666 |
| 80776 | B9D2 | LP15 | Human | Oral cavity | LP | 2.74e-04 | 7.06e-01 | 0.2174 |
| 80776 | B9D2 | SYSMH2 | Human | Oral cavity | OSCC | 4.69e-03 | 1.39e-01 | 0.2326 |
| 80776 | B9D2 | SYSMH3 | Human | Oral cavity | OSCC | 1.08e-02 | 1.60e-01 | 0.2442 |
| 80776 | B9D2 | PTC01 | Human | Thyroid | PTC | 3.78e-05 | 6.15e-02 | 0.1899 |
| 80776 | B9D2 | PTC06 | Human | Thyroid | PTC | 1.16e-04 | 1.48e-01 | 0.2057 |
| 80776 | B9D2 | PTC07 | Human | Thyroid | PTC | 8.31e-07 | 1.33e-01 | 0.2044 |
| 80776 | B9D2 | ATC13 | Human | Thyroid | ATC | 2.39e-42 | 9.69e-01 | 0.34 |
| 80776 | B9D2 | ATC2 | Human | Thyroid | ATC | 4.91e-04 | 5.19e-01 | 0.34 |
| 80776 | B9D2 | ATC5 | Human | Thyroid | ATC | 5.59e-47 | 1.04e+00 | 0.34 |
| Page: 1 2 3 4 |
| Tissue | Expression Dynamics | Abbreviation |
| Esophagus | 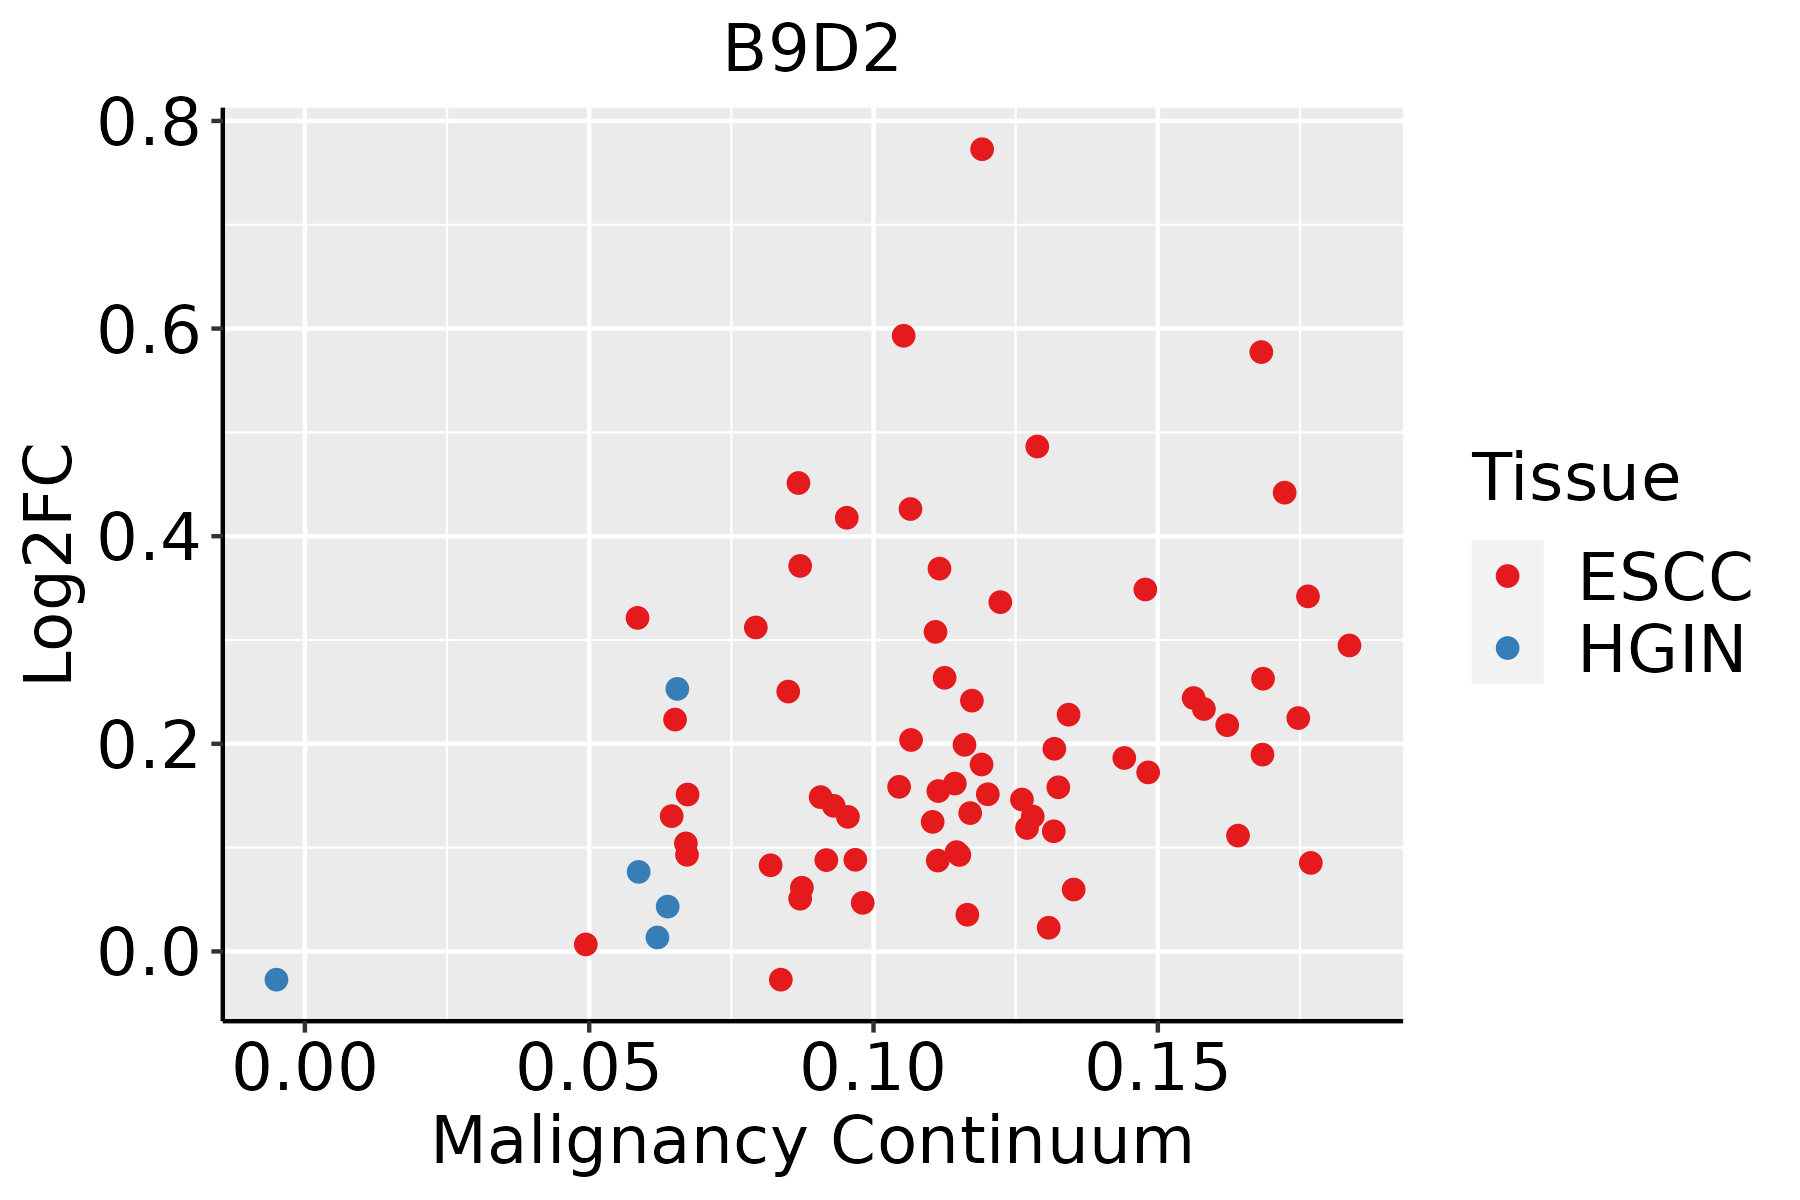 | ESCC: Esophageal squamous cell carcinoma |
| HGIN: High-grade intraepithelial neoplasias | ||
| LGIN: Low-grade intraepithelial neoplasias | ||
| Oral Cavity | 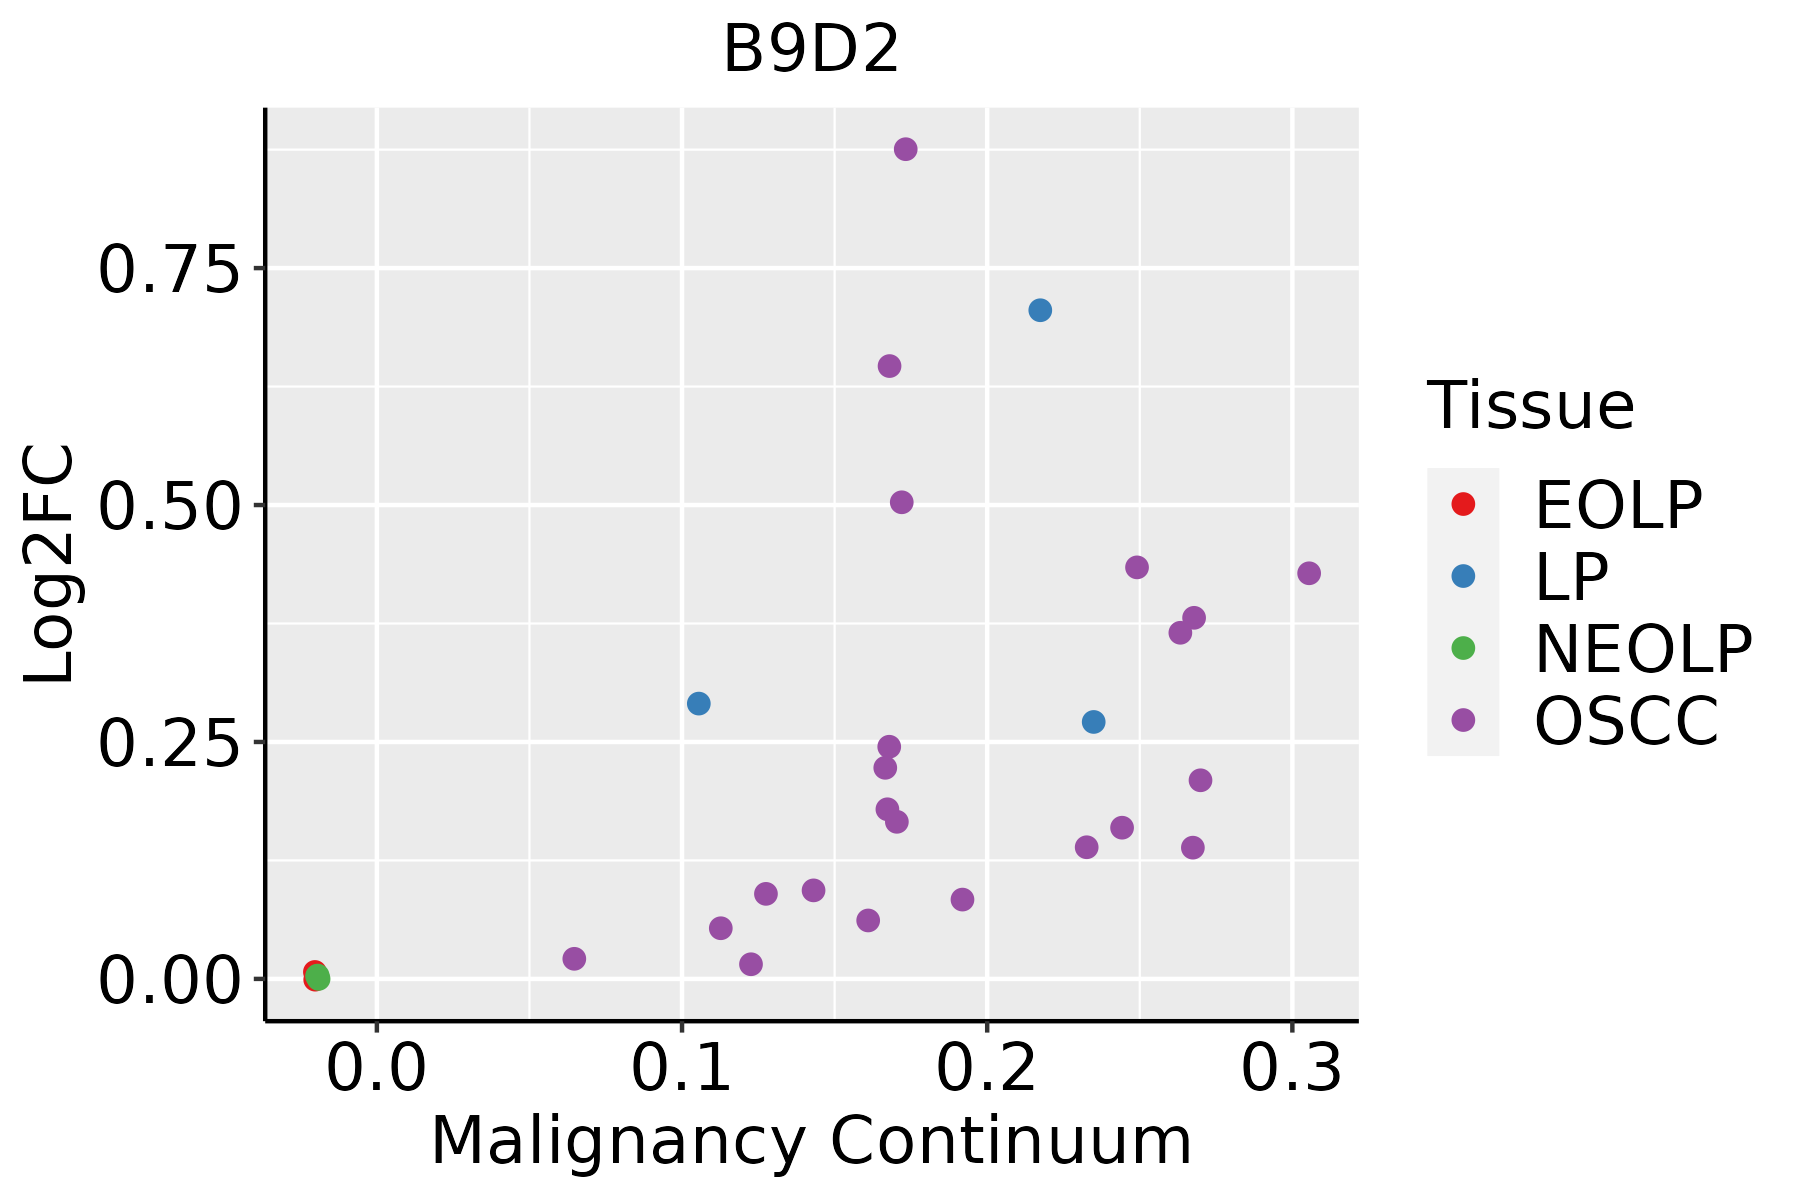 | EOLP: Erosive Oral lichen planus |
| LP: leukoplakia | ||
| NEOLP: Non-erosive oral lichen planus | ||
| OSCC: Oral squamous cell carcinoma | ||
| Thyroid | 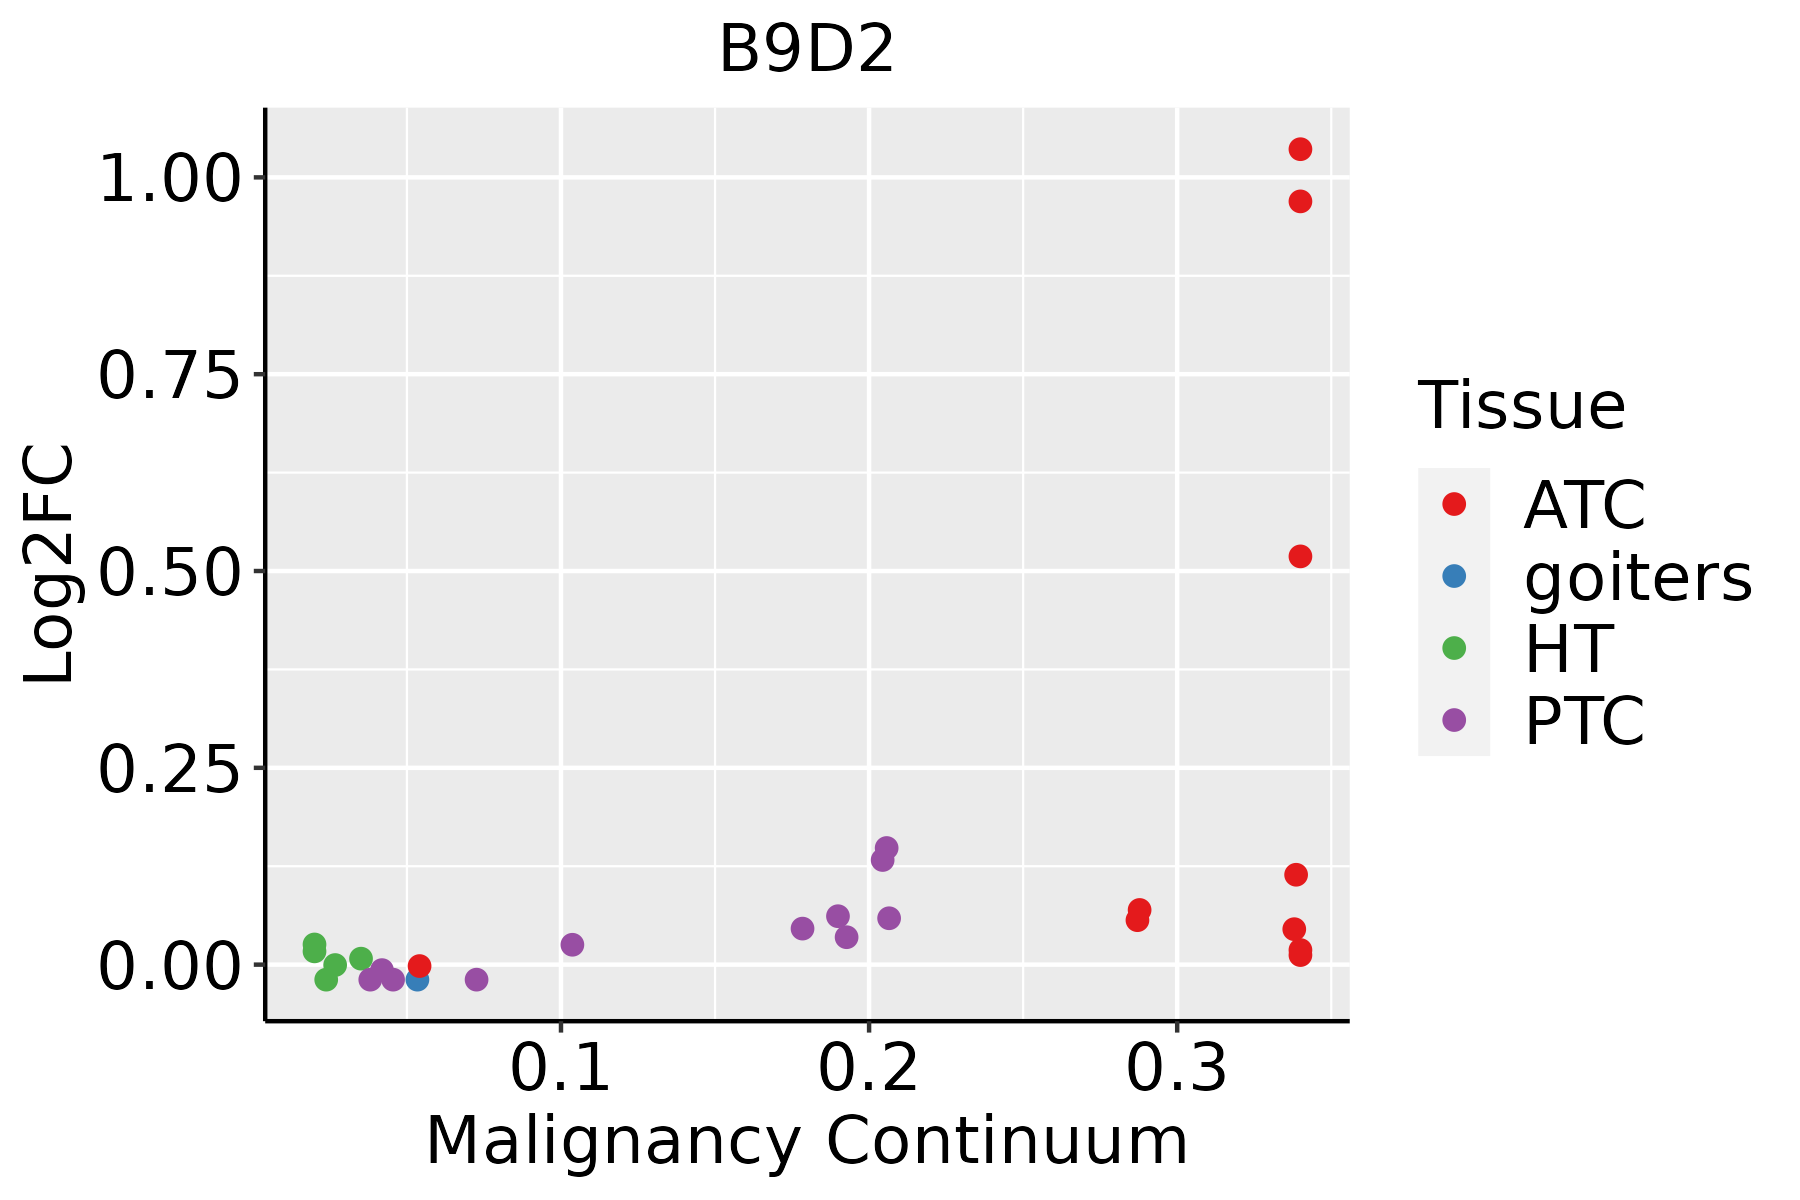 | ATC: Anaplastic thyroid cancer |
| HT: Hashimoto's thyroiditis | ||
| PTC: Papillary thyroid cancer |
| ∗log2FC in expression of this searched gene in stem-like cells from each diseased tissue sample relative to stem-like cells in normal samples in each tissue plotted against the malignancy continuum. Samples are colored based on if they are from different disease stage. |
Top |
Malignant transformation related pathway analysis |
| Find out the enriched GO biological processes and KEGG pathways involved in transition from healthy to precancer to cancer |
| Tissue | Disease Stage | Enriched GO biological Processes |
| Colorectum | AD |  |
| Colorectum | SER |  |
| Colorectum | MSS |  |
| Colorectum | MSI-H |  |
| Colorectum | FAP |  |
| ∗Top 15 enriched GO BP terms are showed in the bar plot of each disease state in each tissue. Each row represents a significant GO biological process which is colored according to the -log10(p.adjust). |
| Page: 1 2 3 4 5 6 7 8 9 |
| GO ID | Tissue | Disease Stage | Description | Gene Ratio | Bg Ratio | pvalue | p.adjust | Count |
| Page: 1 |
| Pathway ID | Tissue | Disease Stage | Description | Gene Ratio | Bg Ratio | pvalue | p.adjust | qvalue | Count |
| Page: 1 |
Top |
Cell-cell communication analysis |
| Identification of potential cell-cell interactions between two cell types and their ligand-receptor pairs for different disease states |
| Ligand | Receptor | LRpair | Pathway | Tissue | Disease Stage |
| Page: 1 |
Top |
Single-cell gene regulatory network inference analysis |
| Find out the significant the regulons (TFs) and the target genes of each regulon across cell types for different disease states |
| TF | Cell Type | Tissue | Disease Stage | Target Gene | RSS | Regulon Activity |
| ∗The dot plots of a searched regulon are shown for all cell subpopulations in each disease state of each tissue based on the regulon specific score inferred using pySCENIC and by calculating the average expression. |
| Page: 1 |
Top |
Somatic mutation of malignant transformation related genes |
| Annotation of somatic variants for genes involved in malignant transformation |
| Hugo Symbol | Variant Class | Variant Classification | dbSNP RS | HGVSc | HGVSp | HGVSp Short | SWISSPROT | BIOTYPE | SIFT | PolyPhen | Tumor Sample Barcode | Tissue | Histology | Sex | Age | Stage | Therapy Types | Drugs | Outcome |
| B9D2 | SNV | Missense_Mutation | c.202N>G | p.Lys68Glu | p.K68E | Q9BPU9 | protein_coding | deleterious(0.01) | possibly_damaging(0.753) | TCGA-A8-A08J-01 | Breast | breast invasive carcinoma | Female | <65 | III/IV | Unknown | Unknown | PD | |
| B9D2 | SNV | Missense_Mutation | rs777610654 | c.275C>A | p.Ala92Glu | p.A92E | Q9BPU9 | protein_coding | tolerated(0.22) | benign(0.007) | TCGA-C5-A7CO-01 | Cervix | cervical & endocervical cancer | Female | >=65 | I/II | Chemotherapy | cisplatin | SD |
| B9D2 | SNV | Missense_Mutation | novel | c.335C>T | p.Thr112Met | p.T112M | Q9BPU9 | protein_coding | deleterious(0.01) | possibly_damaging(0.679) | TCGA-5M-AAT6-01 | Colorectum | colon adenocarcinoma | Female | <65 | III/IV | Unknown | Unknown | PD |
| B9D2 | SNV | Missense_Mutation | rs374581827 | c.359G>A | p.Arg120Gln | p.R120Q | Q9BPU9 | protein_coding | tolerated(0.35) | benign(0.007) | TCGA-AA-A022-01 | Colorectum | colon adenocarcinoma | Female | >=65 | I/II | Unknown | Unknown | SD |
| B9D2 | SNV | Missense_Mutation | rs761918700 | c.308N>T | p.Pro103Leu | p.P103L | Q9BPU9 | protein_coding | deleterious(0) | probably_damaging(0.996) | TCGA-AD-6889-01 | Colorectum | colon adenocarcinoma | Male | >=65 | I/II | Chemotherapy | xeloda | PD |
| B9D2 | SNV | Missense_Mutation | c.4G>A | p.Ala2Thr | p.A2T | Q9BPU9 | protein_coding | deleterious(0) | probably_damaging(0.979) | TCGA-G4-6588-01 | Colorectum | colon adenocarcinoma | Female | <65 | I/II | Unknown | Unknown | SD | |
| B9D2 | SNV | Missense_Mutation | novel | c.5N>T | p.Ala2Val | p.A2V | Q9BPU9 | protein_coding | deleterious(0) | probably_damaging(0.979) | TCGA-A5-A0GP-01 | Endometrium | uterine corpus endometrioid carcinoma | Female | <65 | I/II | Unknown | Unknown | SD |
| B9D2 | SNV | Missense_Mutation | novel | c.271N>A | p.Leu91Ile | p.L91I | Q9BPU9 | protein_coding | tolerated(0.23) | benign(0.217) | TCGA-AJ-A5DW-01 | Endometrium | uterine corpus endometrioid carcinoma | Female | <65 | I/II | Unknown | Unknown | SD |
| B9D2 | SNV | Missense_Mutation | novel | c.335N>T | p.Thr112Met | p.T112M | Q9BPU9 | protein_coding | deleterious(0.01) | possibly_damaging(0.679) | TCGA-AJ-A8CW-01 | Endometrium | uterine corpus endometrioid carcinoma | Female | <65 | I/II | Unknown | Unknown | SD |
| B9D2 | SNV | Missense_Mutation | rs149500212 | c.443G>A | p.Arg148His | p.R148H | Q9BPU9 | protein_coding | deleterious(0.03) | probably_damaging(0.911) | TCGA-AP-A1DK-01 | Endometrium | uterine corpus endometrioid carcinoma | Female | <65 | I/II | Unknown | Unknown | SD |
| Page: 1 2 3 |
Top |
Related drugs of malignant transformation related genes |
| Identification of chemicals and drugs interact with genes involved in malignant transfromation |
| (DGIdb 4.0) |
| Entrez ID | Symbol | Category | Interaction Types | Drug Claim Name | Drug Name | PMIDs |
| Page: 1 |

Copyright 2023-Present -The University of Texas Health Science Center at Houston |