
|
|||||
|
 | |
| |
| |
| |
| |
| |
|
Gene: B4GALNT3 |
Gene summary for B4GALNT3 |
| Gene information | Species | Human | Gene symbol | B4GALNT3 | Gene ID | 283358 |
| Gene name | beta-1,4-N-acetyl-galactosaminyltransferase 3 | |
| Gene Alias | B4GALNT3 | |
| Cytomap | 12p13.33 | |
| Gene Type | protein-coding | GO ID | GO:0005575 | UniProtAcc | Q6L9W6 |
Top |
Malignant transformation analysis |
| Identification of the aberrant gene expression in precancerous and cancerous lesions by comparing the gene expression of stem-like cells in diseased tissues with normal stem cells |
| Entrez ID | Symbol | Replicates | Species | Organ | Tissue | Adj P-value | Log2FC | Malignancy |
| 283358 | B4GALNT3 | P8T-E | Human | Esophagus | ESCC | 1.02e-09 | 1.09e-01 | 0.0889 |
| 283358 | B4GALNT3 | P9T-E | Human | Esophagus | ESCC | 2.71e-05 | 1.89e-01 | 0.1131 |
| 283358 | B4GALNT3 | P10T-E | Human | Esophagus | ESCC | 2.78e-04 | 1.23e-01 | 0.116 |
| 283358 | B4GALNT3 | P12T-E | Human | Esophagus | ESCC | 3.66e-14 | 3.13e-01 | 0.1122 |
| 283358 | B4GALNT3 | P20T-E | Human | Esophagus | ESCC | 1.41e-08 | 1.21e-01 | 0.1124 |
| 283358 | B4GALNT3 | P21T-E | Human | Esophagus | ESCC | 5.94e-04 | 3.60e-02 | 0.1617 |
| 283358 | B4GALNT3 | P22T-E | Human | Esophagus | ESCC | 7.66e-15 | 3.10e-01 | 0.1236 |
| 283358 | B4GALNT3 | P26T-E | Human | Esophagus | ESCC | 2.78e-05 | 1.20e-01 | 0.1276 |
| 283358 | B4GALNT3 | P27T-E | Human | Esophagus | ESCC | 2.15e-10 | 2.74e-01 | 0.1055 |
| 283358 | B4GALNT3 | P28T-E | Human | Esophagus | ESCC | 2.54e-24 | 5.00e-01 | 0.1149 |
| 283358 | B4GALNT3 | P30T-E | Human | Esophagus | ESCC | 7.28e-09 | 2.68e-01 | 0.137 |
| 283358 | B4GALNT3 | P31T-E | Human | Esophagus | ESCC | 1.26e-13 | 2.45e-01 | 0.1251 |
| 283358 | B4GALNT3 | P36T-E | Human | Esophagus | ESCC | 3.21e-07 | 1.23e-01 | 0.1187 |
| 283358 | B4GALNT3 | P37T-E | Human | Esophagus | ESCC | 1.28e-04 | 1.08e-01 | 0.1371 |
| 283358 | B4GALNT3 | P39T-E | Human | Esophagus | ESCC | 7.14e-03 | 5.50e-02 | 0.0894 |
| 283358 | B4GALNT3 | P40T-E | Human | Esophagus | ESCC | 1.63e-04 | 1.47e-01 | 0.109 |
| 283358 | B4GALNT3 | P42T-E | Human | Esophagus | ESCC | 1.72e-07 | 1.09e-01 | 0.1175 |
| 283358 | B4GALNT3 | P48T-E | Human | Esophagus | ESCC | 6.72e-10 | 2.07e-01 | 0.0959 |
| 283358 | B4GALNT3 | P49T-E | Human | Esophagus | ESCC | 2.71e-06 | 3.79e-01 | 0.1768 |
| 283358 | B4GALNT3 | P52T-E | Human | Esophagus | ESCC | 4.44e-04 | 1.59e-01 | 0.1555 |
| Page: 1 2 3 4 5 6 7 8 |
| Tissue | Expression Dynamics | Abbreviation |
| Cervix |  | CC: Cervix cancer |
| HSIL_HPV: HPV-infected high-grade squamous intraepithelial lesions | ||
| N_HPV: HPV-infected normal cervix | ||
| Colorectum (GSE201348) |  | FAP: Familial adenomatous polyposis |
| CRC: Colorectal cancer | ||
| Colorectum (HTA11) |  | AD: Adenomas |
| SER: Sessile serrated lesions | ||
| MSI-H: Microsatellite-high colorectal cancer | ||
| MSS: Microsatellite stable colorectal cancer | ||
| Endometrium | 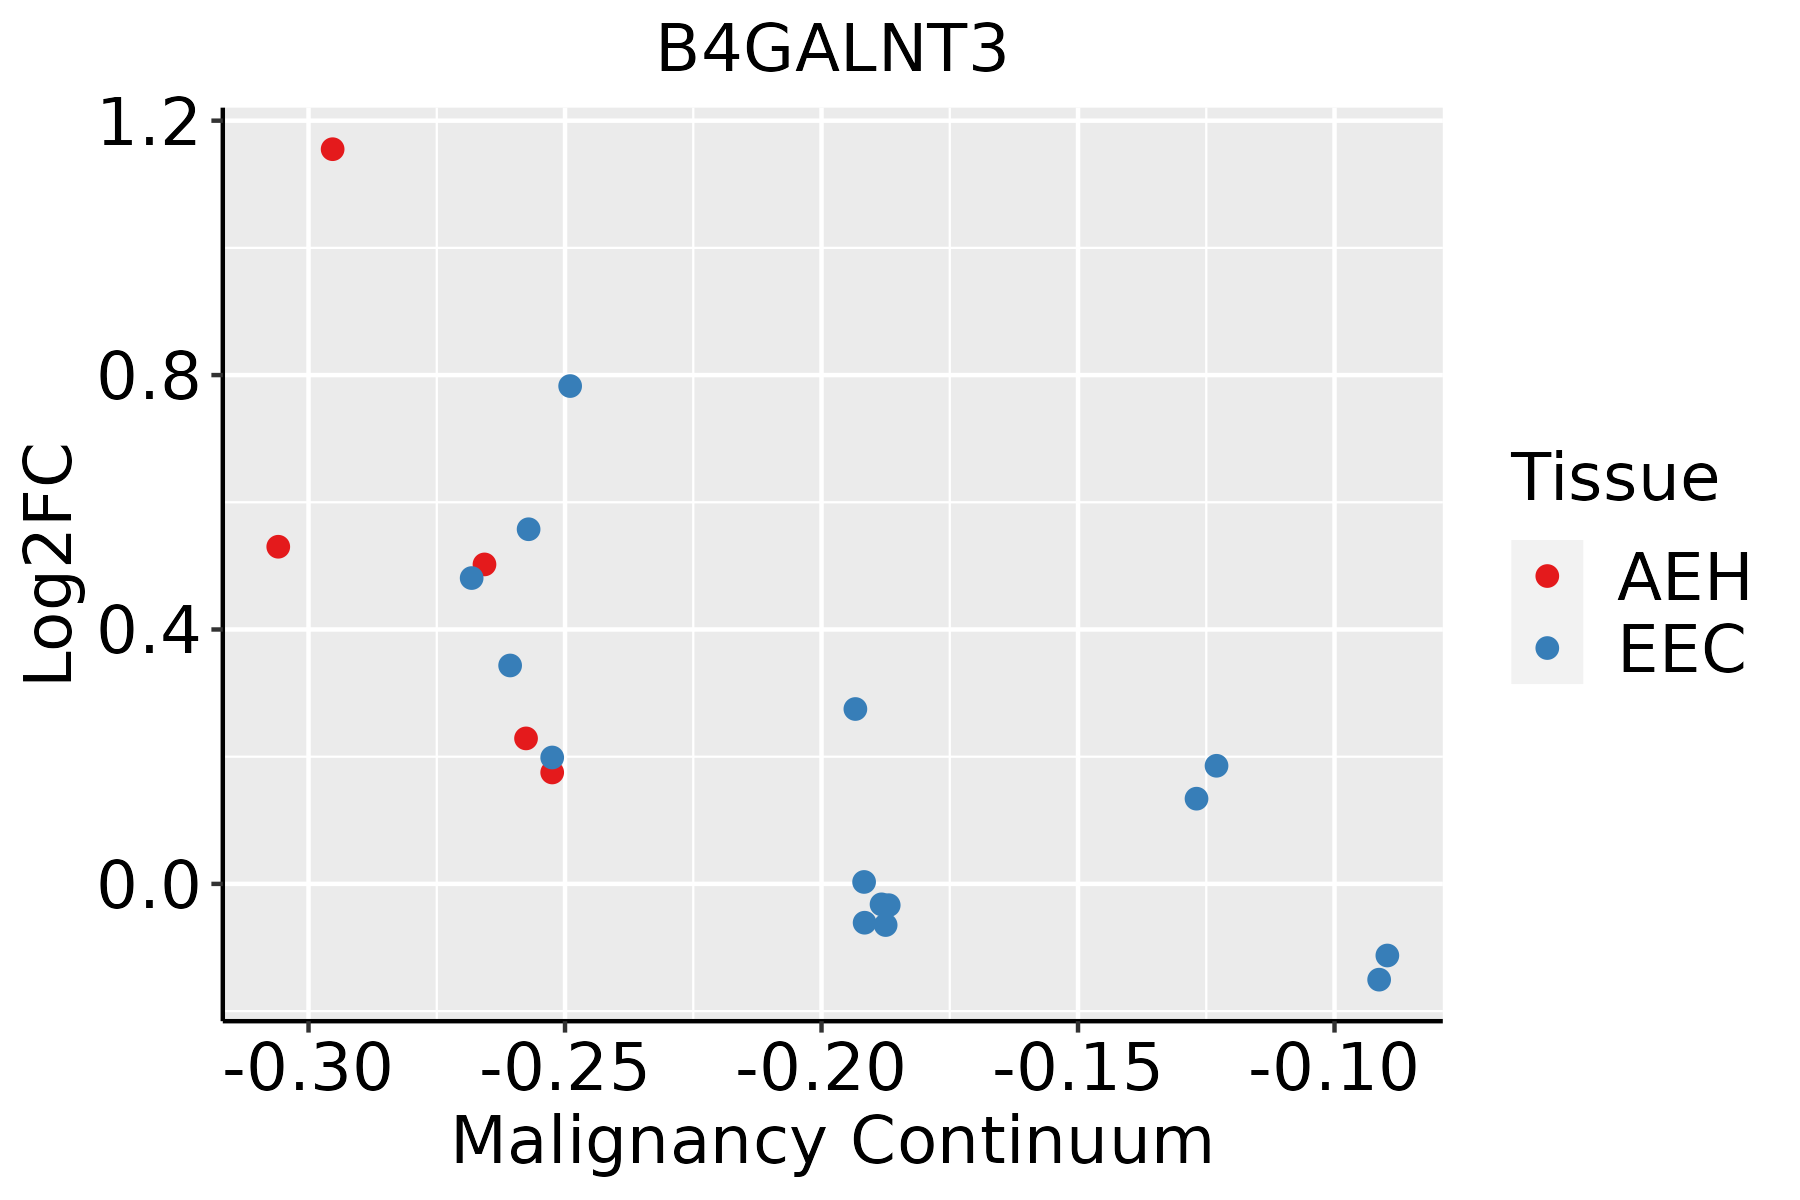 | AEH: Atypical endometrial hyperplasia |
| EEC: Endometrioid Cancer | ||
| Esophagus | 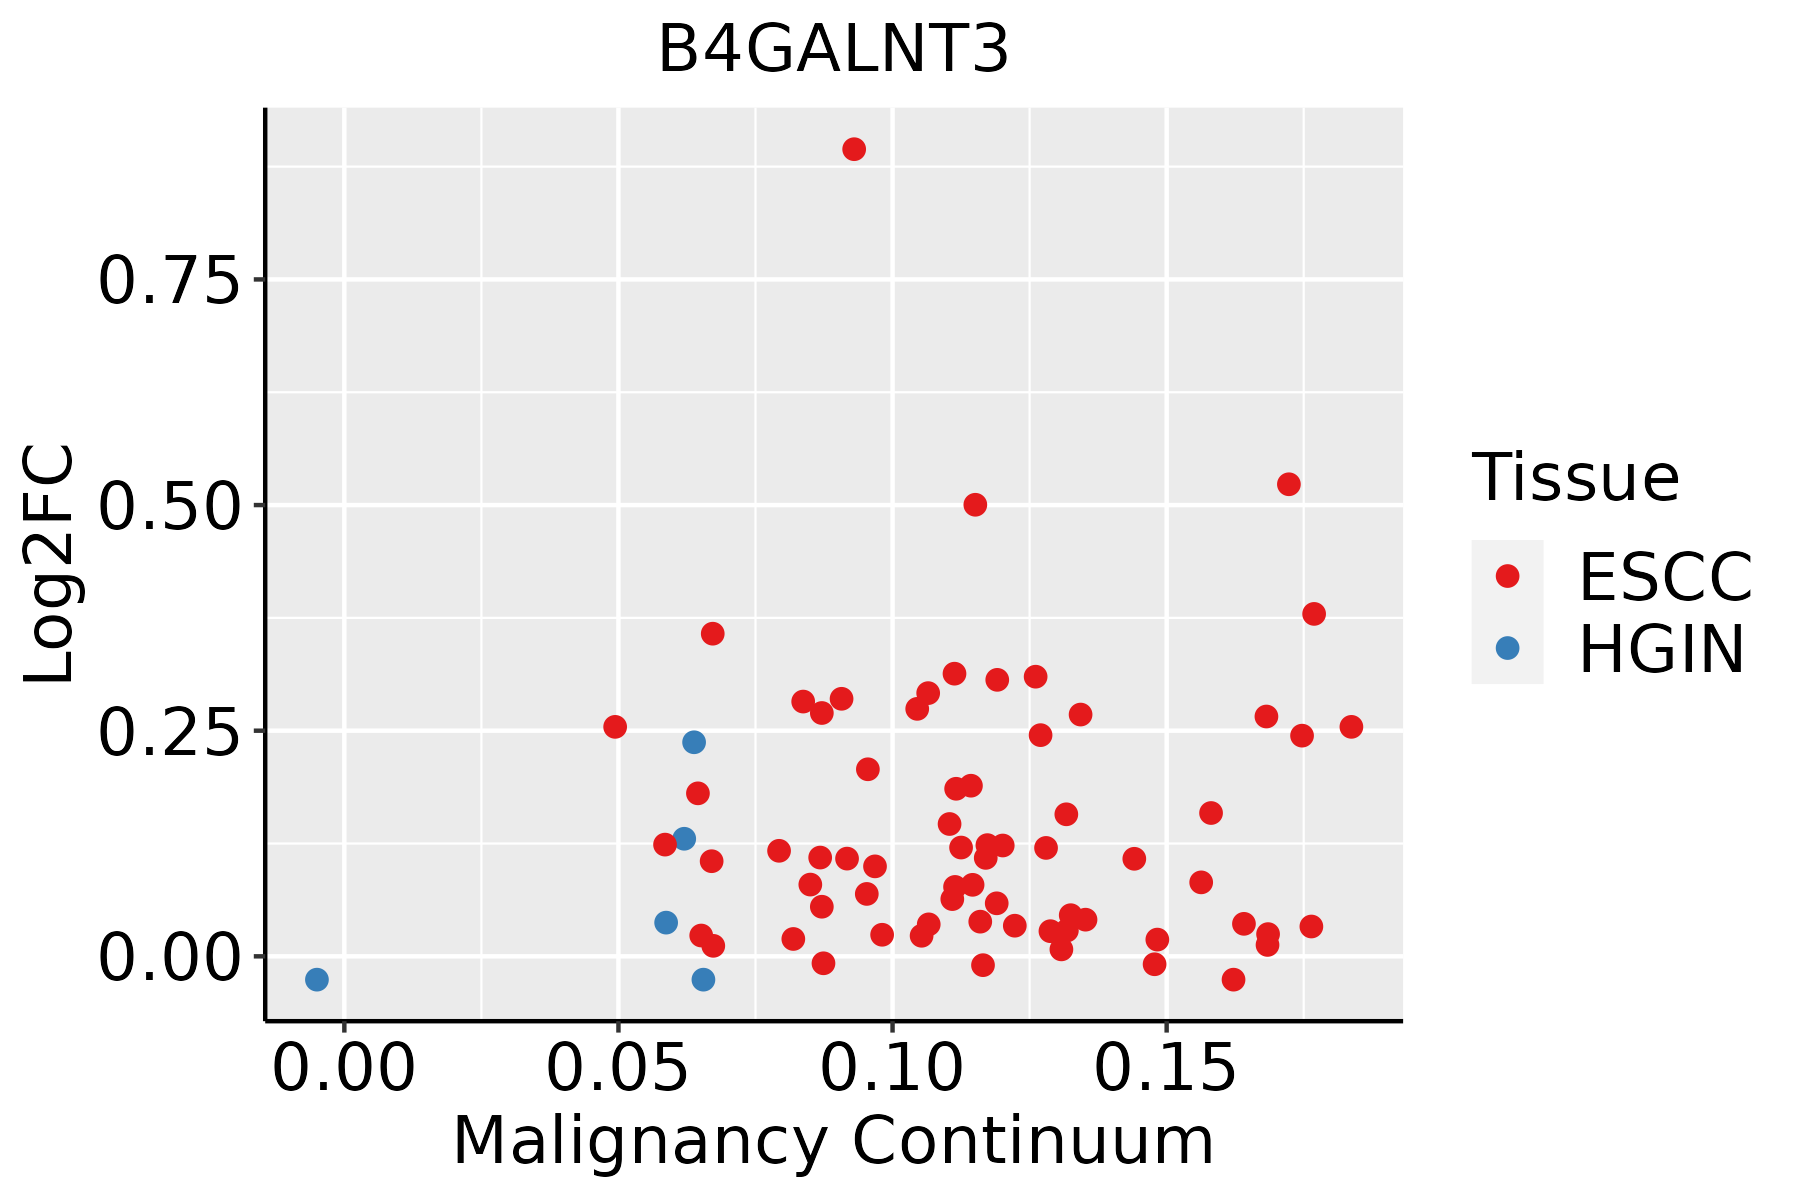 | ESCC: Esophageal squamous cell carcinoma |
| HGIN: High-grade intraepithelial neoplasias | ||
| LGIN: Low-grade intraepithelial neoplasias | ||
| GC | 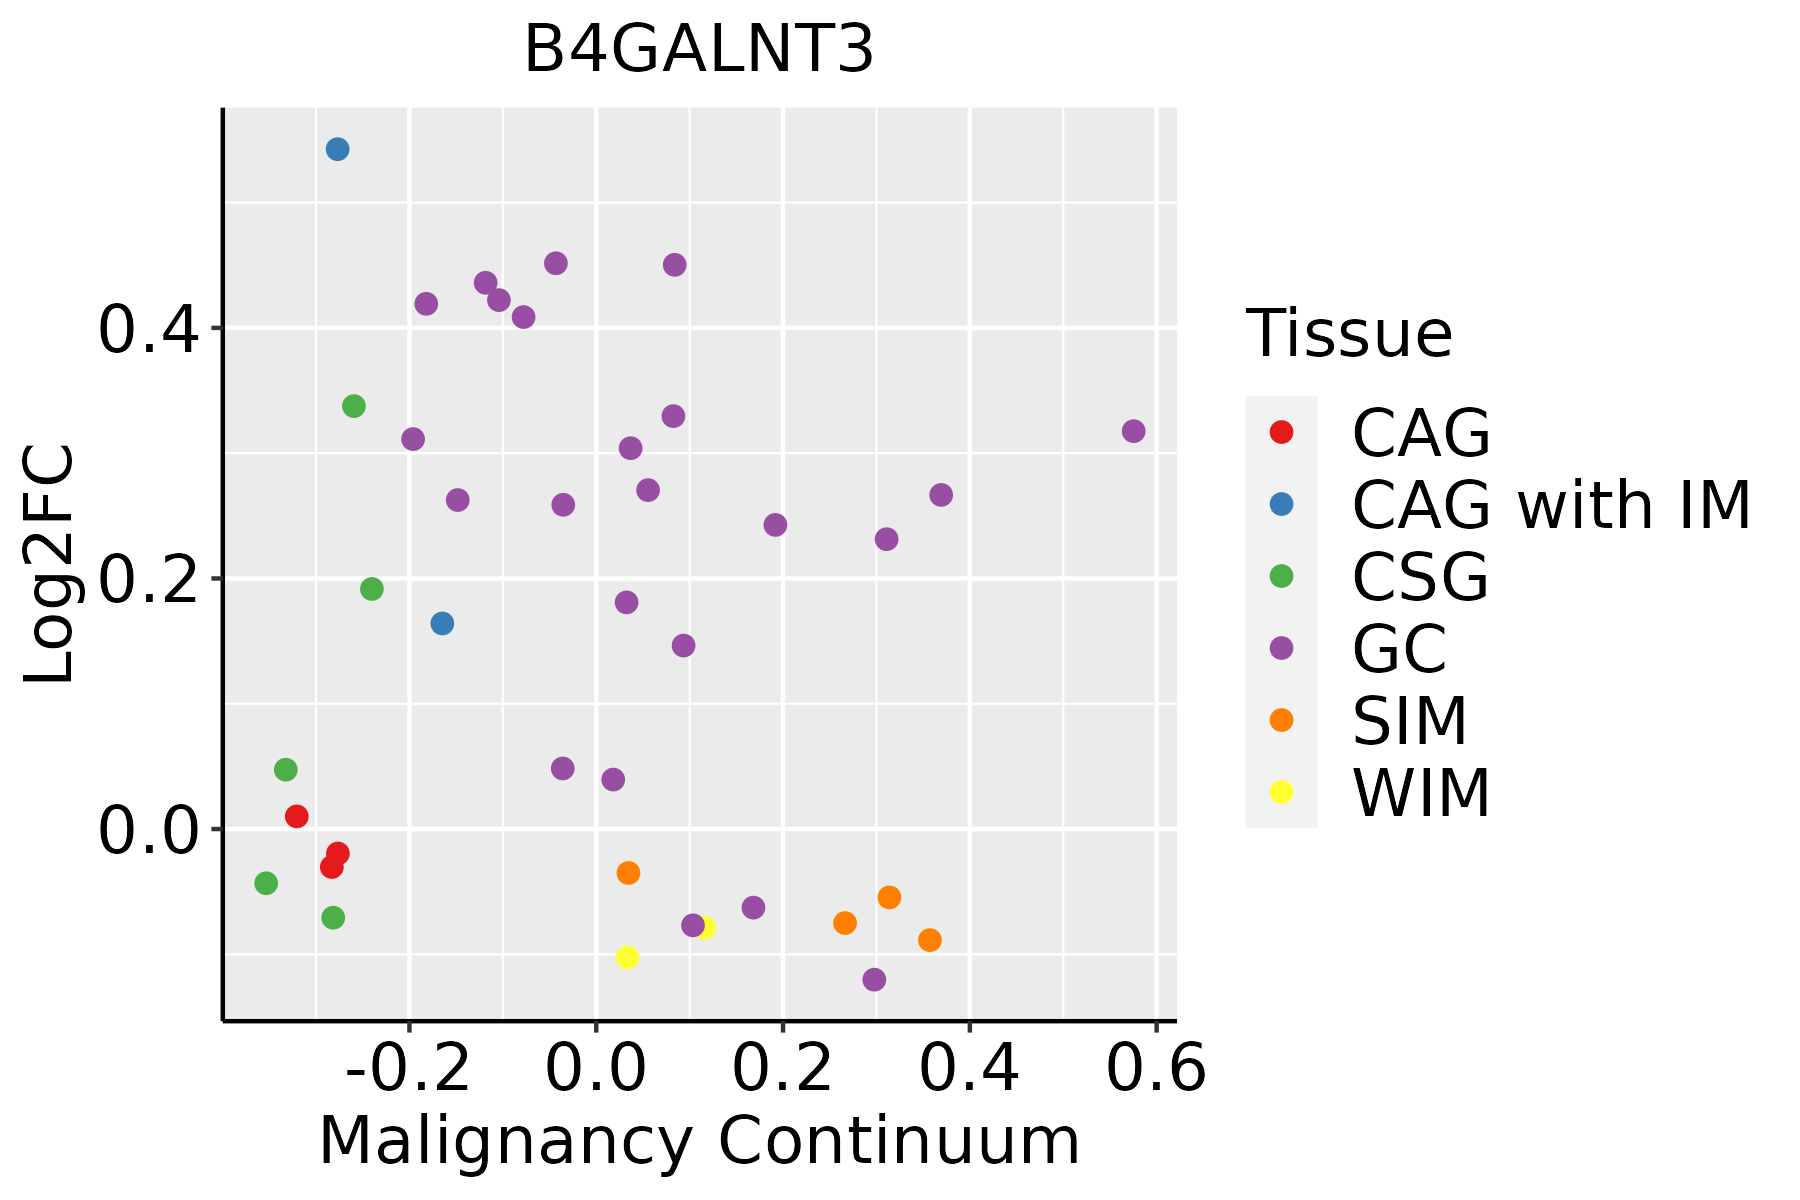 | CAG: Chronic atrophic gastritis |
| CAG with IM: Chronic atrophic gastritis with intestinal metaplasia | ||
| CSG: Chronic superficial gastritis | ||
| GC: Gastric cancer | ||
| SIM: Severe intestinal metaplasia | ||
| WIM: Wild intestinal metaplasia | ||
| Lung | 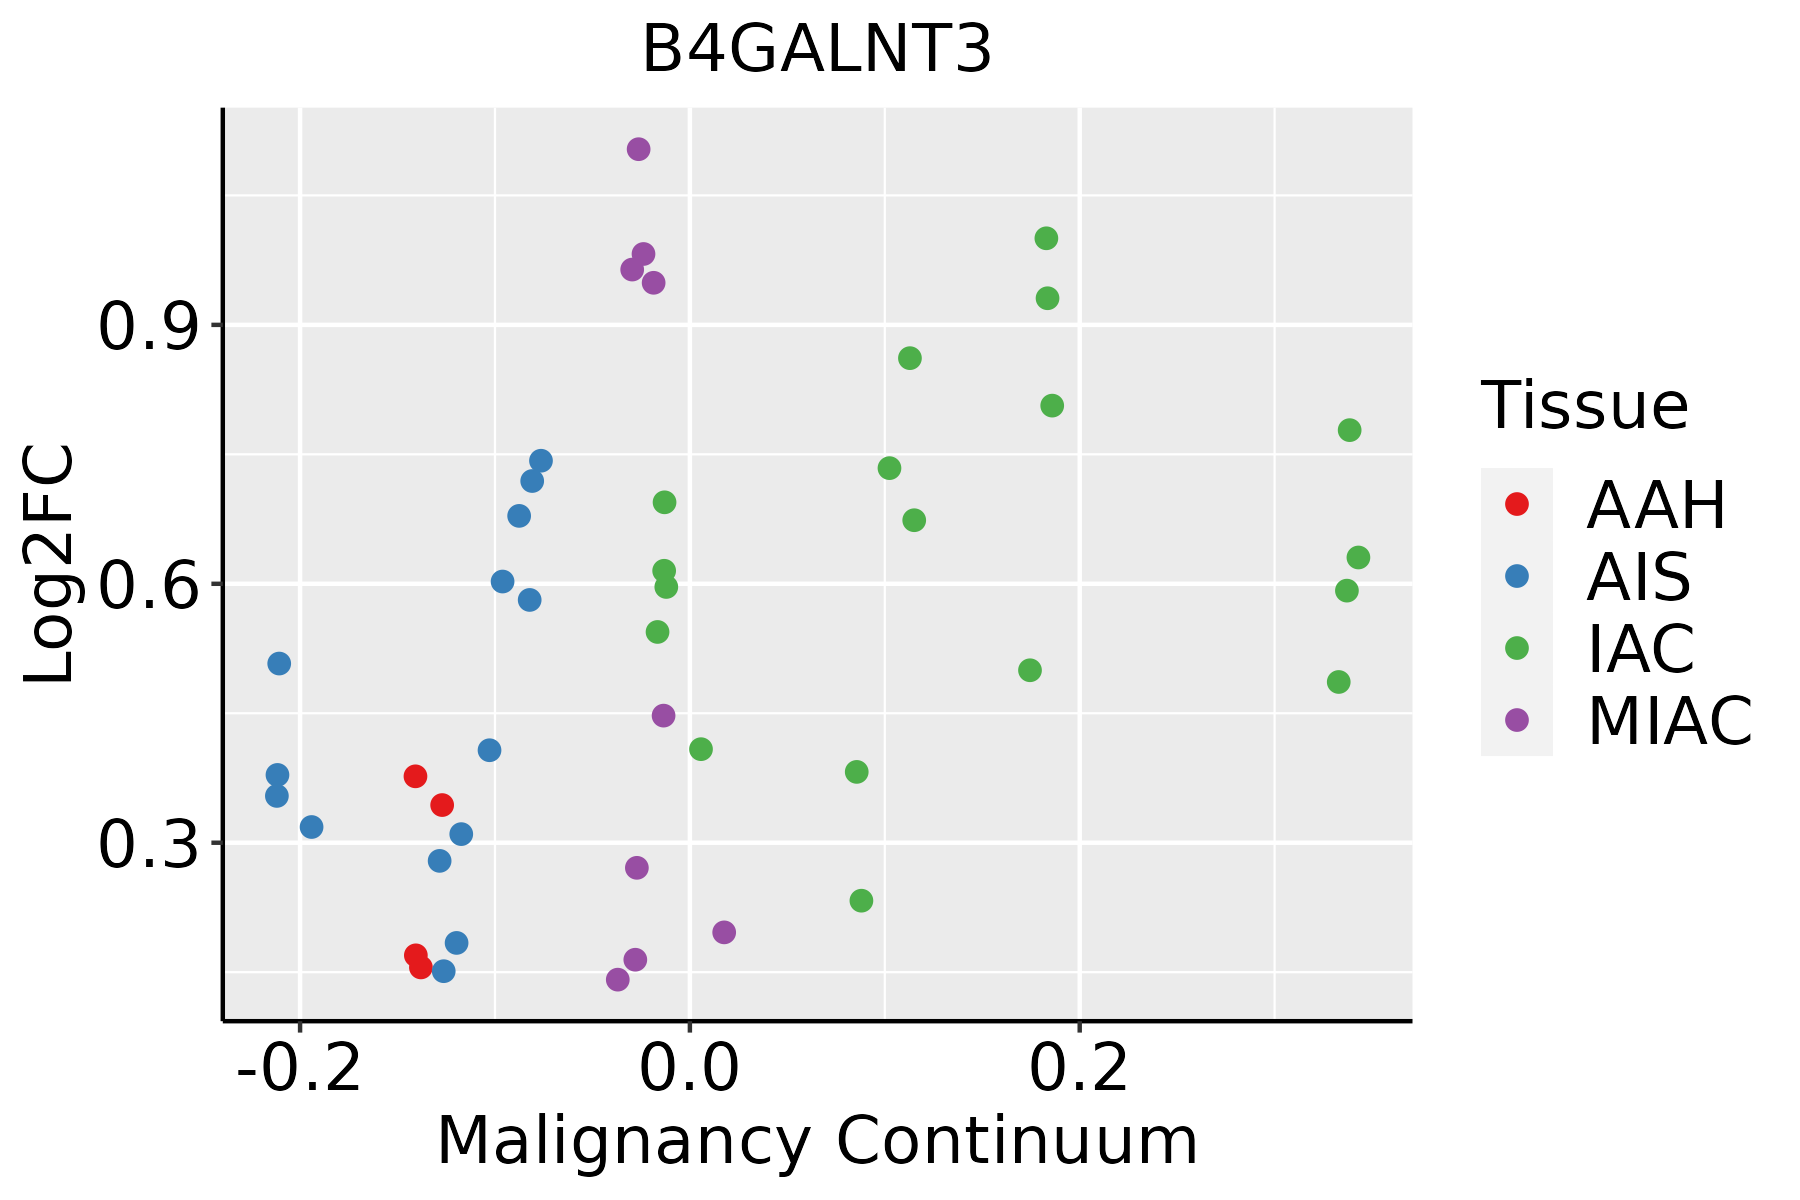 | AAH: Atypical adenomatous hyperplasia |
| AIS: Adenocarcinoma in situ | ||
| IAC: Invasive lung adenocarcinoma | ||
| MIA: Minimally invasive adenocarcinoma | ||
| Skin |  | AK: Actinic keratosis |
| cSCC: Cutaneous squamous cell carcinoma | ||
| SCCIS:squamous cell carcinoma in situ |
| ∗log2FC in expression of this searched gene in stem-like cells from each diseased tissue sample relative to stem-like cells in normal samples in each tissue plotted against the malignancy continuum. Samples are colored based on if they are from different disease stage. |
Top |
Malignant transformation related pathway analysis |
| Find out the enriched GO biological processes and KEGG pathways involved in transition from healthy to precancer to cancer |
| Tissue | Disease Stage | Enriched GO biological Processes |
| Colorectum | AD |  |
| Colorectum | SER |  |
| Colorectum | MSS |  |
| Colorectum | MSI-H |  |
| Colorectum | FAP |  |
| ∗Top 15 enriched GO BP terms are showed in the bar plot of each disease state in each tissue. Each row represents a significant GO biological process which is colored according to the -log10(p.adjust). |
| Page: 1 2 3 4 5 6 7 8 9 |
| GO ID | Tissue | Disease Stage | Description | Gene Ratio | Bg Ratio | pvalue | p.adjust | Count |
| Page: 1 |
| Pathway ID | Tissue | Disease Stage | Description | Gene Ratio | Bg Ratio | pvalue | p.adjust | qvalue | Count |
| hsa00513 | Colorectum | MSS | Various types of N-glycan biosynthesis | 16/1875 | 42/8465 | 1.39e-02 | 4.53e-02 | 2.77e-02 | 16 |
| hsa005131 | Colorectum | MSS | Various types of N-glycan biosynthesis | 16/1875 | 42/8465 | 1.39e-02 | 4.53e-02 | 2.77e-02 | 16 |
| hsa005136 | Esophagus | ESCC | Various types of N-glycan biosynthesis | 31/4205 | 42/8465 | 1.23e-03 | 3.78e-03 | 1.93e-03 | 31 |
| hsa0051313 | Esophagus | ESCC | Various types of N-glycan biosynthesis | 31/4205 | 42/8465 | 1.23e-03 | 3.78e-03 | 1.93e-03 | 31 |
| Page: 1 |
Top |
Cell-cell communication analysis |
| Identification of potential cell-cell interactions between two cell types and their ligand-receptor pairs for different disease states |
| Ligand | Receptor | LRpair | Pathway | Tissue | Disease Stage |
| Page: 1 |
Top |
Single-cell gene regulatory network inference analysis |
| Find out the significant the regulons (TFs) and the target genes of each regulon across cell types for different disease states |
| TF | Cell Type | Tissue | Disease Stage | Target Gene | RSS | Regulon Activity |
| ∗The dot plots of a searched regulon are shown for all cell subpopulations in each disease state of each tissue based on the regulon specific score inferred using pySCENIC and by calculating the average expression. |
| Page: 1 |
Top |
Somatic mutation of malignant transformation related genes |
| Annotation of somatic variants for genes involved in malignant transformation |
| Hugo Symbol | Variant Class | Variant Classification | dbSNP RS | HGVSc | HGVSp | HGVSp Short | SWISSPROT | BIOTYPE | SIFT | PolyPhen | Tumor Sample Barcode | Tissue | Histology | Sex | Age | Stage | Therapy Types | Drugs | Outcome |
| B4GALNT3 | SNV | Missense_Mutation | novel | c.2518A>G | p.Arg840Gly | p.R840G | Q6L9W6 | protein_coding | deleterious(0.05) | benign(0.266) | TCGA-AN-A0AK-01 | Breast | breast invasive carcinoma | Female | >=65 | I/II | Unknown | Unknown | SD |
| B4GALNT3 | SNV | Missense_Mutation | c.1205A>T | p.Asp402Val | p.D402V | Q6L9W6 | protein_coding | deleterious(0.01) | possibly_damaging(0.543) | TCGA-AN-A0AR-01 | Breast | breast invasive carcinoma | Female | <65 | I/II | Unknown | Unknown | SD | |
| B4GALNT3 | SNV | Missense_Mutation | novel | c.2287C>A | p.Gln763Lys | p.Q763K | Q6L9W6 | protein_coding | tolerated(0.44) | benign(0.043) | TCGA-AN-A0FK-01 | Breast | breast invasive carcinoma | Female | >=65 | III/IV | Unknown | Unknown | SD |
| B4GALNT3 | SNV | Missense_Mutation | rs142955460 | c.2078N>A | p.Arg693His | p.R693H | Q6L9W6 | protein_coding | deleterious(0.02) | possibly_damaging(0.88) | TCGA-C8-A12K-01 | Breast | breast invasive carcinoma | Female | >=65 | I/II | Unknown | Unknown | SD |
| B4GALNT3 | deletion | Frame_Shift_Del | novel | c.2779delN | p.Phe928SerfsTer17 | p.F928Sfs*17 | Q6L9W6 | protein_coding | TCGA-EW-A2FV-01 | Breast | breast invasive carcinoma | Female | <65 | III/IV | Chemotherapy | docetaxel | SD | ||
| B4GALNT3 | SNV | Missense_Mutation | rs747342036 | c.775N>A | p.Val259Met | p.V259M | Q6L9W6 | protein_coding | deleterious(0.01) | probably_damaging(1) | TCGA-DS-A1OB-01 | Cervix | cervical & endocervical cancer | Female | <65 | I/II | Chemotherapy | carboplatin | PD |
| B4GALNT3 | SNV | Missense_Mutation | c.1627N>G | p.Gln543Glu | p.Q543E | Q6L9W6 | protein_coding | tolerated(1) | benign(0.003) | TCGA-IR-A3LA-01 | Cervix | cervical & endocervical cancer | Female | <65 | I/II | Chemotherapy | cisplatin | CR | |
| B4GALNT3 | SNV | Missense_Mutation | novel | c.2285N>C | p.Arg762Thr | p.R762T | Q6L9W6 | protein_coding | tolerated(0.12) | benign(0.044) | TCGA-VS-A9UR-01 | Cervix | cervical & endocervical cancer | Female | <65 | I/II | Chemotherapy | cisplatin | PD |
| B4GALNT3 | deletion | Frame_Shift_Del | novel | c.1278delN | p.Glu427LysfsTer4 | p.E427Kfs*4 | Q6L9W6 | protein_coding | TCGA-LP-A4AV-01 | Cervix | cervical & endocervical cancer | Female | <65 | I/II | Unknown | Unknown | SD | ||
| B4GALNT3 | SNV | Missense_Mutation | rs201901859 | c.452N>A | p.Arg151His | p.R151H | Q6L9W6 | protein_coding | deleterious(0) | probably_damaging(1) | TCGA-AA-3510-01 | Colorectum | colon adenocarcinoma | Male | >=65 | I/II | Unknown | Unknown | SD |
| Page: 1 2 3 4 5 6 7 8 |
Top |
Related drugs of malignant transformation related genes |
| Identification of chemicals and drugs interact with genes involved in malignant transfromation |
| (DGIdb 4.0) |
| Entrez ID | Symbol | Category | Interaction Types | Drug Claim Name | Drug Name | PMIDs |
| Page: 1 |

Copyright 2023-Present -The University of Texas Health Science Center at Houston |