
|
|||||
|
 | |
| |
| |
| |
| |
| |
|
Gene: APH1A |
Gene summary for APH1A |
| Gene information | Species | Human | Gene symbol | APH1A | Gene ID | 51107 |
| Gene name | aph-1 homolog A, gamma-secretase subunit | |
| Gene Alias | 6530402N02Rik | |
| Cytomap | 1q21.2 | |
| Gene Type | protein-coding | GO ID | GO:0001655 | UniProtAcc | Q96BI3 |
Top |
Malignant transformation analysis |
| Identification of the aberrant gene expression in precancerous and cancerous lesions by comparing the gene expression of stem-like cells in diseased tissues with normal stem cells |
| Entrez ID | Symbol | Replicates | Species | Organ | Tissue | Adj P-value | Log2FC | Malignancy |
| 51107 | APH1A | LZE8T | Human | Esophagus | ESCC | 1.82e-10 | 6.83e-01 | 0.067 |
| 51107 | APH1A | LZE20T | Human | Esophagus | ESCC | 3.60e-05 | 6.08e-01 | 0.0662 |
| 51107 | APH1A | LZE22T | Human | Esophagus | ESCC | 6.13e-06 | 1.20e+00 | 0.068 |
| 51107 | APH1A | LZE24T | Human | Esophagus | ESCC | 8.64e-24 | 1.25e+00 | 0.0596 |
| 51107 | APH1A | LZE6T | Human | Esophagus | ESCC | 7.38e-07 | 7.83e-01 | 0.0845 |
| 51107 | APH1A | P1T-E | Human | Esophagus | ESCC | 1.75e-05 | 9.11e-01 | 0.0875 |
| 51107 | APH1A | P2T-E | Human | Esophagus | ESCC | 1.16e-82 | 1.62e+00 | 0.1177 |
| 51107 | APH1A | P4T-E | Human | Esophagus | ESCC | 1.09e-43 | 1.23e+00 | 0.1323 |
| 51107 | APH1A | P5T-E | Human | Esophagus | ESCC | 1.09e-47 | 1.08e+00 | 0.1327 |
| 51107 | APH1A | P8T-E | Human | Esophagus | ESCC | 3.67e-68 | 1.33e+00 | 0.0889 |
| 51107 | APH1A | P9T-E | Human | Esophagus | ESCC | 4.84e-30 | 1.19e+00 | 0.1131 |
| 51107 | APH1A | P10T-E | Human | Esophagus | ESCC | 8.65e-87 | 1.60e+00 | 0.116 |
| 51107 | APH1A | P11T-E | Human | Esophagus | ESCC | 2.08e-23 | 1.41e+00 | 0.1426 |
| 51107 | APH1A | P12T-E | Human | Esophagus | ESCC | 4.86e-49 | 9.91e-01 | 0.1122 |
| 51107 | APH1A | P15T-E | Human | Esophagus | ESCC | 7.17e-57 | 1.84e+00 | 0.1149 |
| 51107 | APH1A | P16T-E | Human | Esophagus | ESCC | 1.57e-69 | 1.19e+00 | 0.1153 |
| 51107 | APH1A | P17T-E | Human | Esophagus | ESCC | 2.20e-13 | 1.27e+00 | 0.1278 |
| 51107 | APH1A | P19T-E | Human | Esophagus | ESCC | 3.98e-11 | 1.54e+00 | 0.1662 |
| 51107 | APH1A | P20T-E | Human | Esophagus | ESCC | 4.14e-42 | 1.37e+00 | 0.1124 |
| 51107 | APH1A | P21T-E | Human | Esophagus | ESCC | 4.01e-91 | 1.86e+00 | 0.1617 |
| Page: 1 2 3 4 5 6 7 8 9 10 |
| Tissue | Expression Dynamics | Abbreviation |
| Colorectum (GSE201348) |  | FAP: Familial adenomatous polyposis |
| CRC: Colorectal cancer | ||
| Colorectum (HTA11) |  | AD: Adenomas |
| SER: Sessile serrated lesions | ||
| MSI-H: Microsatellite-high colorectal cancer | ||
| MSS: Microsatellite stable colorectal cancer | ||
| Endometrium | 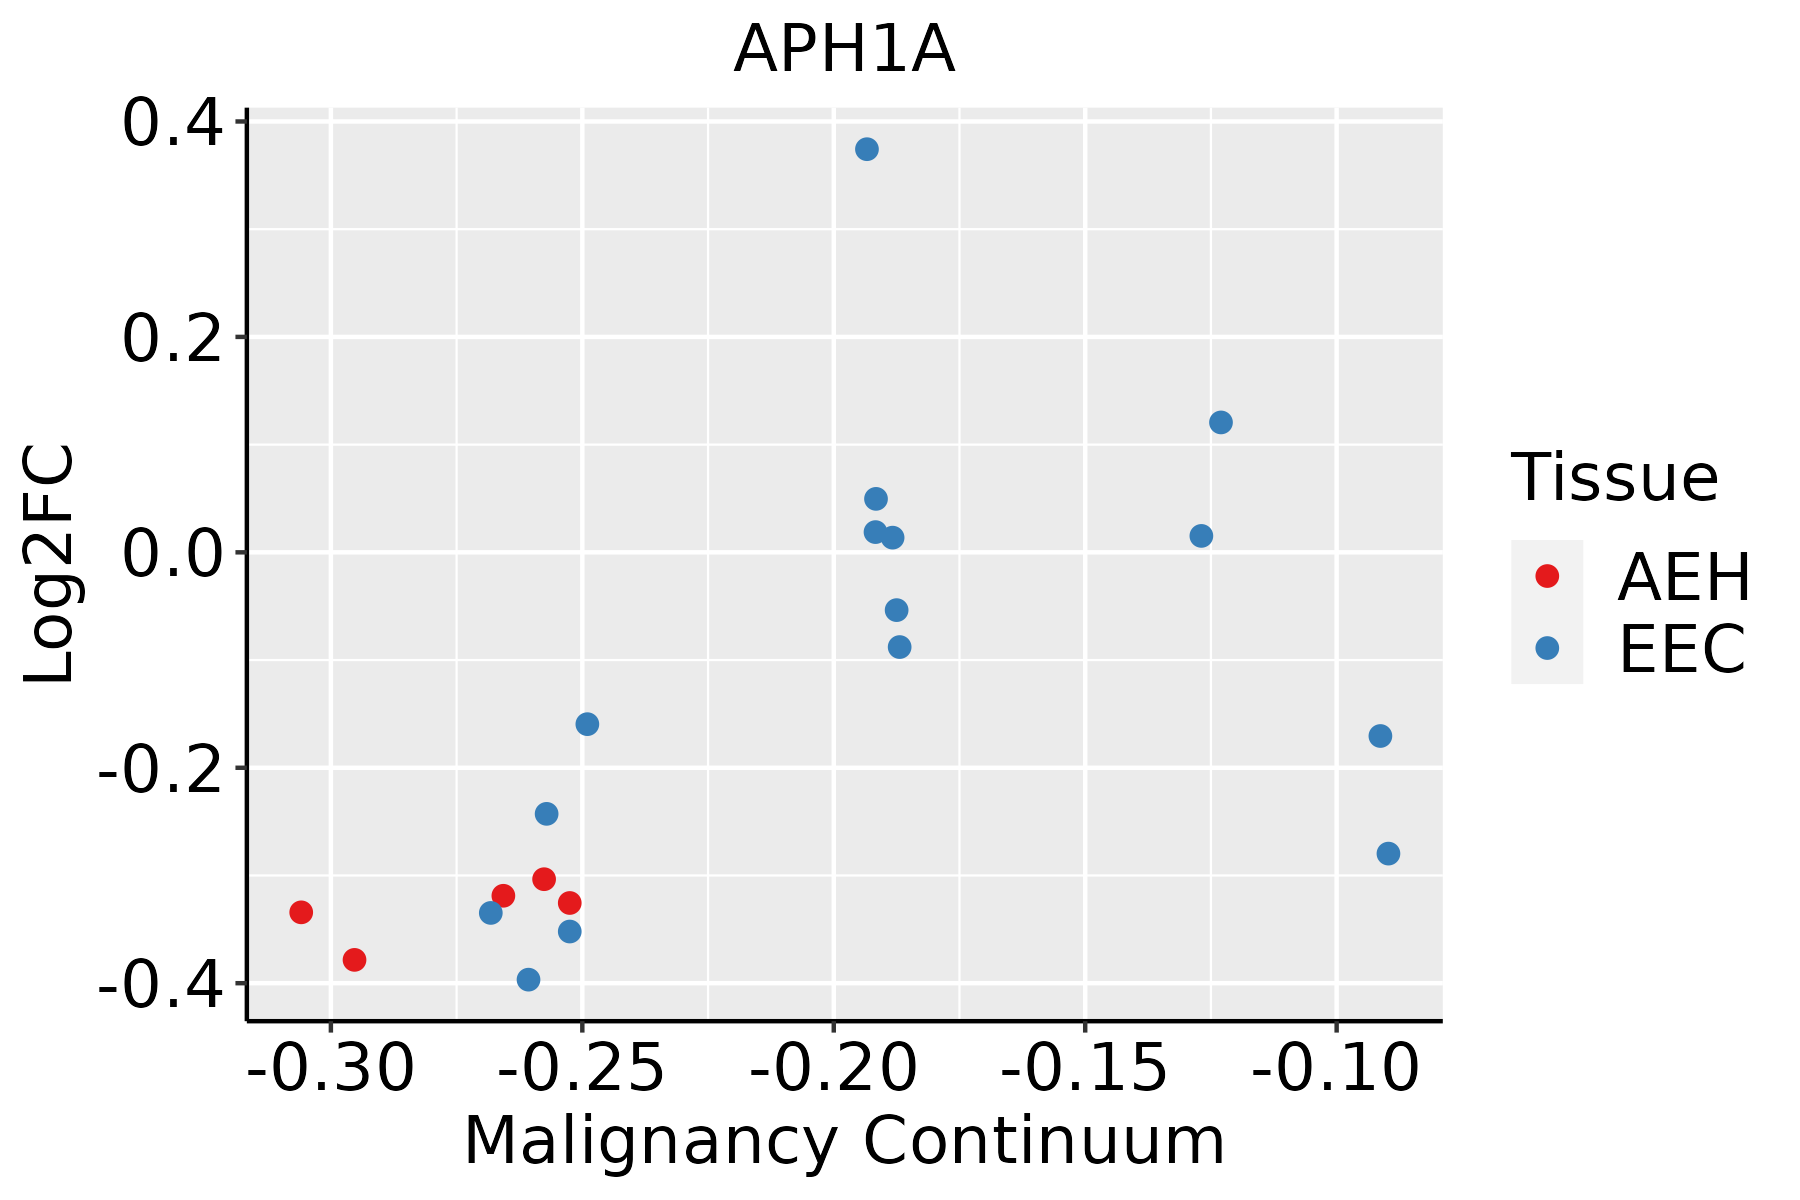 | AEH: Atypical endometrial hyperplasia |
| EEC: Endometrioid Cancer | ||
| Esophagus | 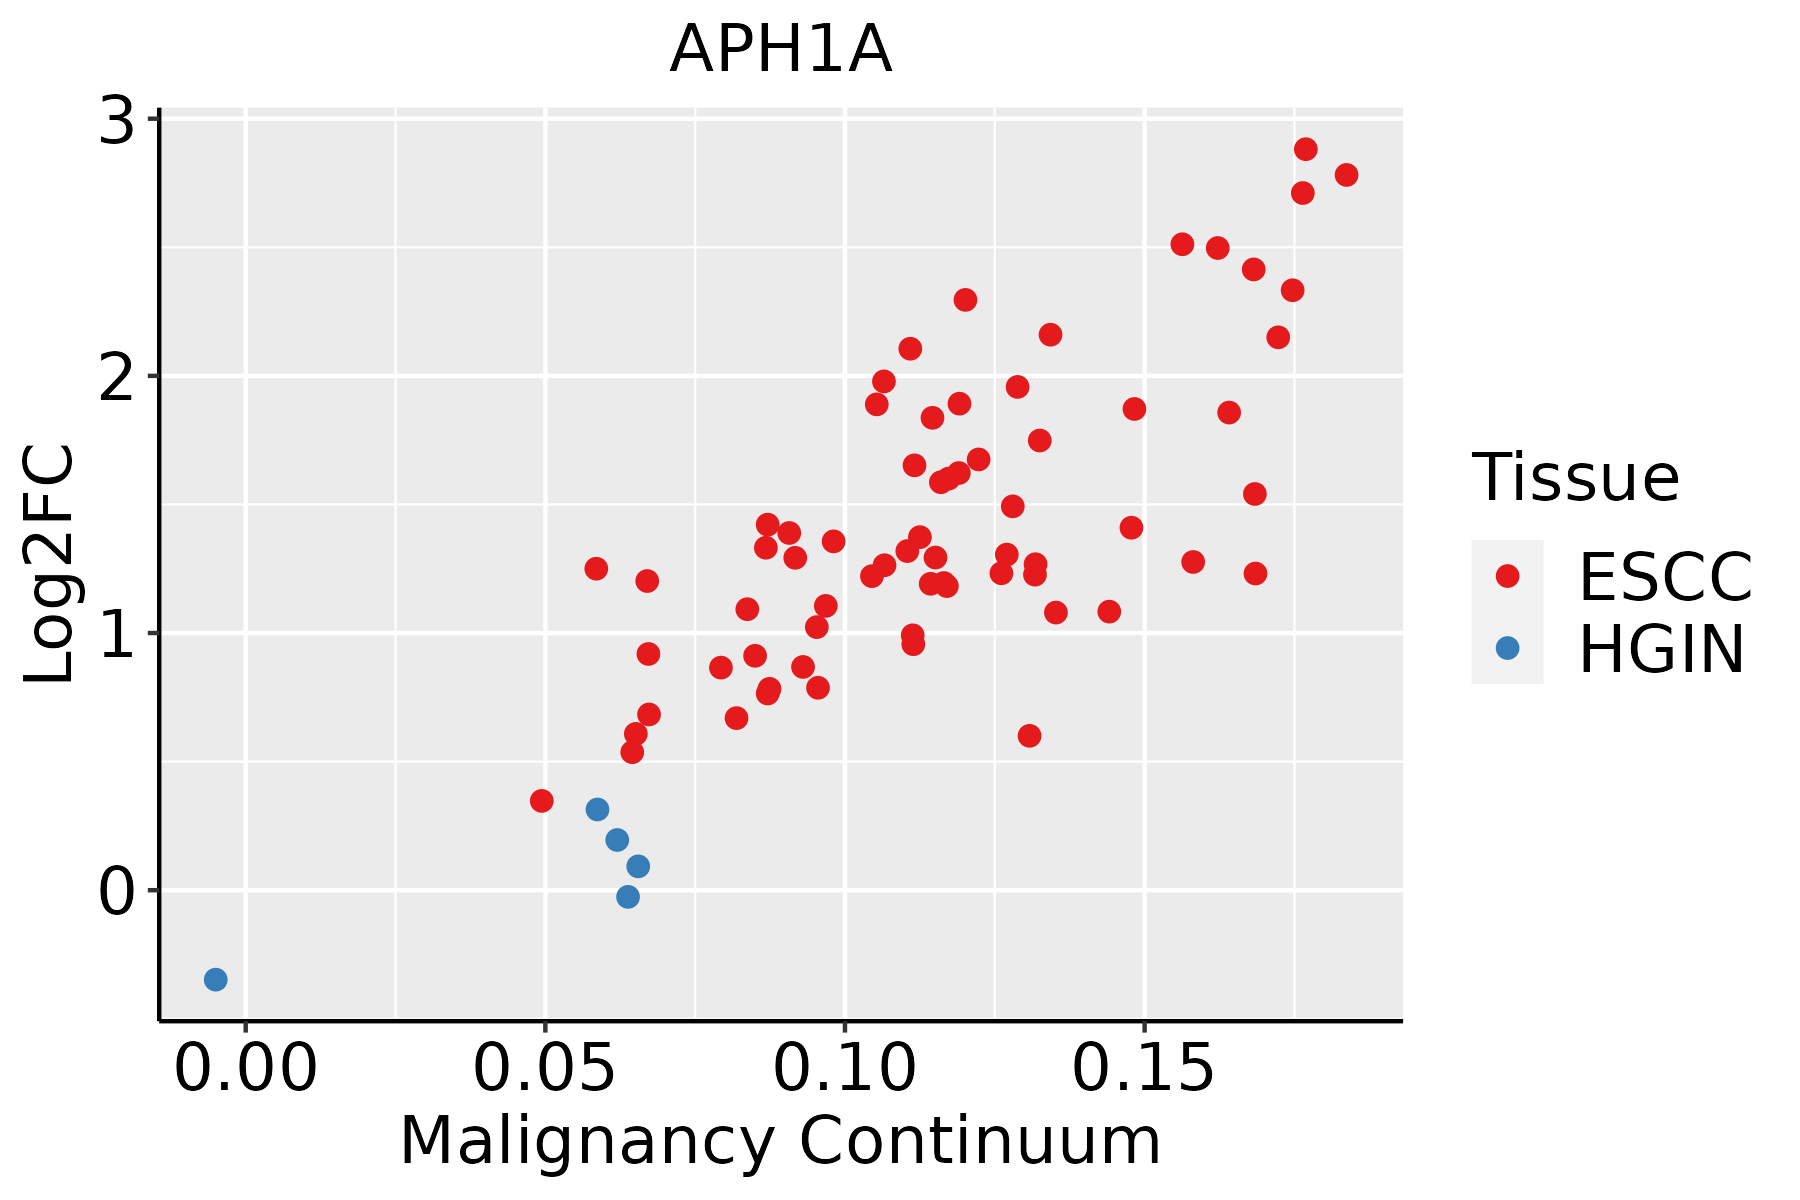 | ESCC: Esophageal squamous cell carcinoma |
| HGIN: High-grade intraepithelial neoplasias | ||
| LGIN: Low-grade intraepithelial neoplasias | ||
| Liver |  | HCC: Hepatocellular carcinoma |
| NAFLD: Non-alcoholic fatty liver disease | ||
| Oral Cavity |  | EOLP: Erosive Oral lichen planus |
| LP: leukoplakia | ||
| NEOLP: Non-erosive oral lichen planus | ||
| OSCC: Oral squamous cell carcinoma | ||
| Skin |  | AK: Actinic keratosis |
| cSCC: Cutaneous squamous cell carcinoma | ||
| SCCIS:squamous cell carcinoma in situ | ||
| Thyroid | 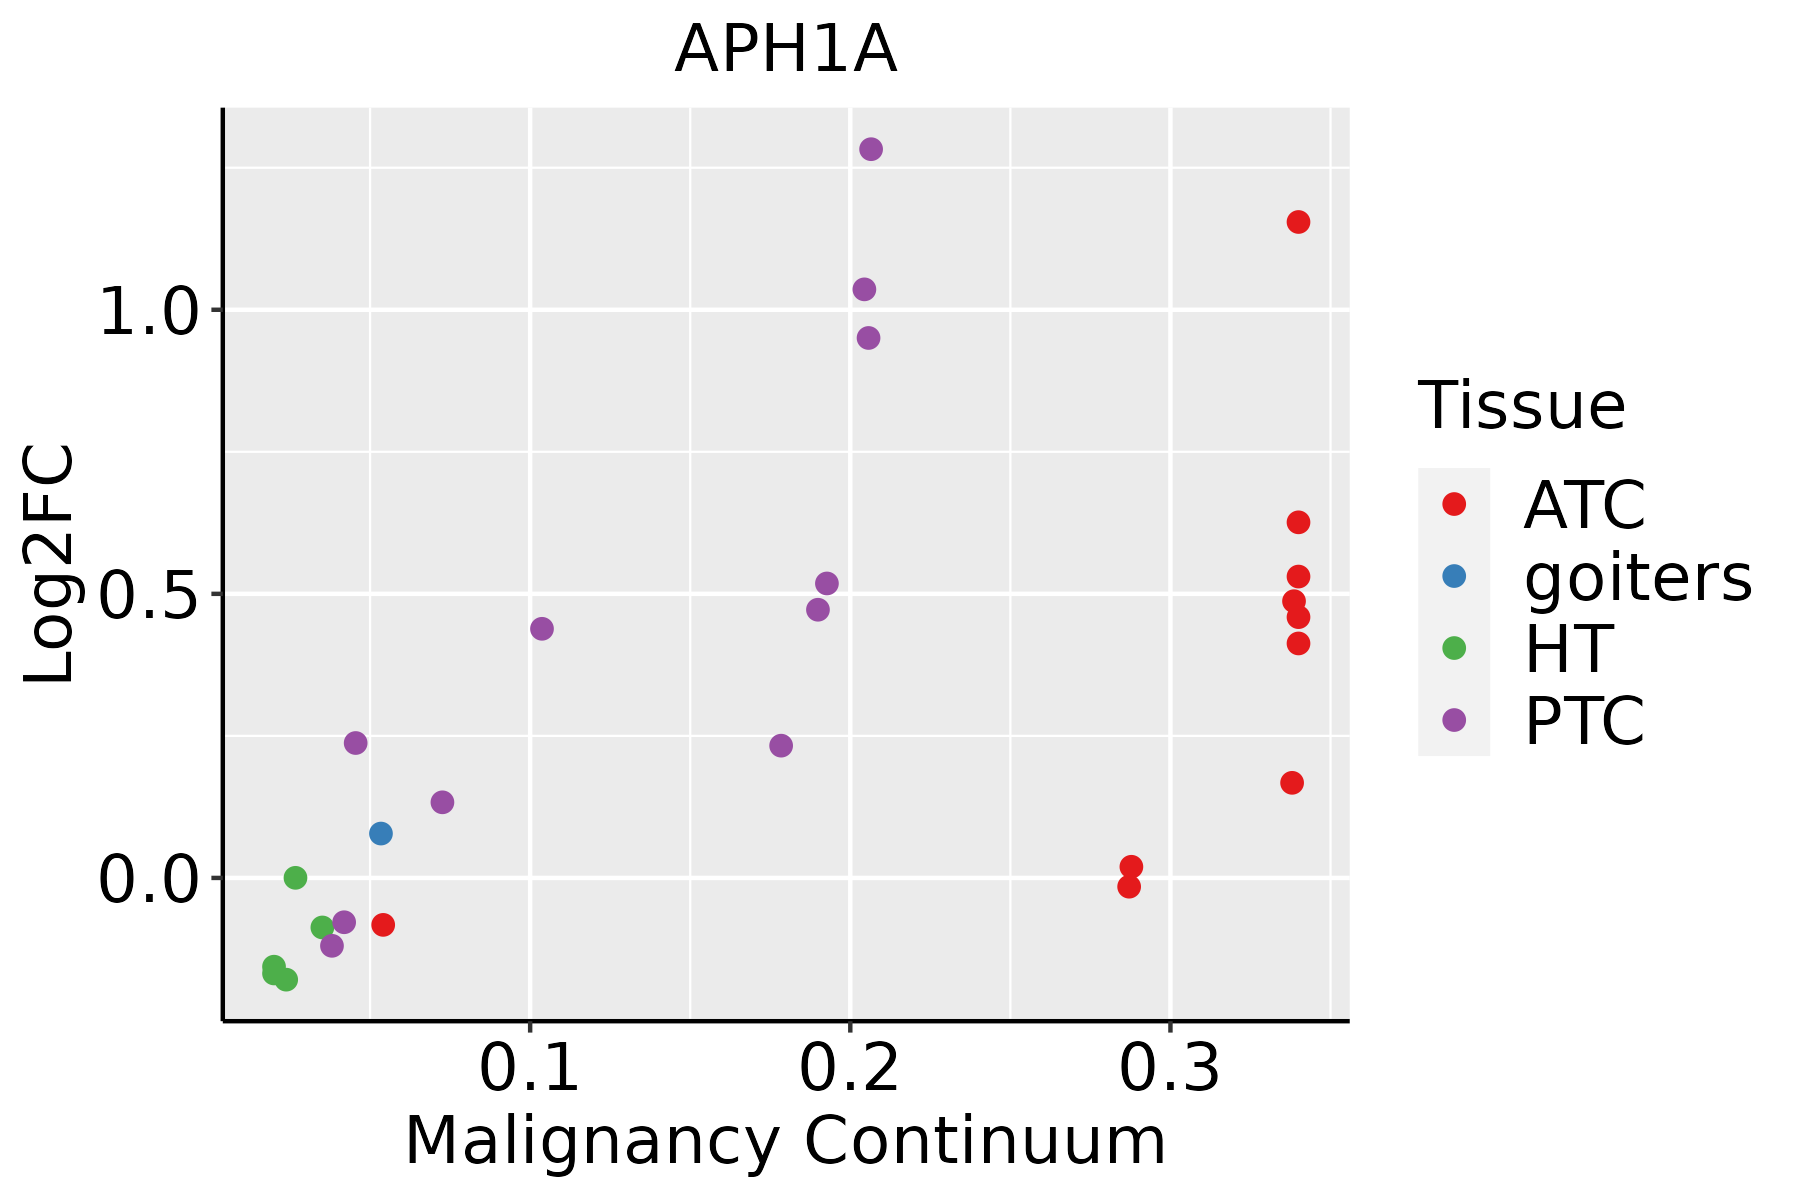 | ATC: Anaplastic thyroid cancer |
| HT: Hashimoto's thyroiditis | ||
| PTC: Papillary thyroid cancer |
| ∗log2FC in expression of this searched gene in stem-like cells from each diseased tissue sample relative to stem-like cells in normal samples in each tissue plotted against the malignancy continuum. Samples are colored based on if they are from different disease stage. |
Top |
Malignant transformation related pathway analysis |
| Find out the enriched GO biological processes and KEGG pathways involved in transition from healthy to precancer to cancer |
| Tissue | Disease Stage | Enriched GO biological Processes |
| Colorectum | AD |  |
| Colorectum | SER |  |
| Colorectum | MSS |  |
| Colorectum | MSI-H |  |
| Colorectum | FAP |  |
| ∗Top 15 enriched GO BP terms are showed in the bar plot of each disease state in each tissue. Each row represents a significant GO biological process which is colored according to the -log10(p.adjust). |
| Page: 1 2 3 4 5 6 7 8 9 |
| GO ID | Tissue | Disease Stage | Description | Gene Ratio | Bg Ratio | pvalue | p.adjust | Count |
| GO:0045862 | Colorectum | AD | positive regulation of proteolysis | 129/3918 | 372/18723 | 4.04e-10 | 3.46e-08 | 129 |
| GO:0052547 | Colorectum | AD | regulation of peptidase activity | 137/3918 | 461/18723 | 4.12e-06 | 1.12e-04 | 137 |
| GO:0010952 | Colorectum | AD | positive regulation of peptidase activity | 68/3918 | 197/18723 | 6.30e-06 | 1.59e-04 | 68 |
| GO:0052548 | Colorectum | AD | regulation of endopeptidase activity | 124/3918 | 432/18723 | 6.58e-05 | 1.07e-03 | 124 |
| GO:0010950 | Colorectum | AD | positive regulation of endopeptidase activity | 59/3918 | 179/18723 | 1.11e-04 | 1.65e-03 | 59 |
| GO:0051604 | Colorectum | AD | protein maturation | 85/3918 | 294/18723 | 6.73e-04 | 6.91e-03 | 85 |
| GO:0033619 | Colorectum | AD | membrane protein proteolysis | 21/3918 | 57/18723 | 4.16e-03 | 2.88e-02 | 21 |
| GO:0016485 | Colorectum | AD | protein processing | 63/3918 | 225/18723 | 6.77e-03 | 4.19e-02 | 63 |
| GO:0007219 | Colorectum | AD | Notch signaling pathway | 50/3918 | 172/18723 | 6.92e-03 | 4.26e-02 | 50 |
| GO:00458621 | Colorectum | SER | positive regulation of proteolysis | 106/2897 | 372/18723 | 8.40e-11 | 1.20e-08 | 106 |
| GO:00525471 | Colorectum | SER | regulation of peptidase activity | 114/2897 | 461/18723 | 1.18e-07 | 7.17e-06 | 114 |
| GO:00525481 | Colorectum | SER | regulation of endopeptidase activity | 103/2897 | 432/18723 | 2.86e-06 | 1.16e-04 | 103 |
| GO:00109521 | Colorectum | SER | positive regulation of peptidase activity | 55/2897 | 197/18723 | 5.44e-06 | 2.00e-04 | 55 |
| GO:00516041 | Colorectum | SER | protein maturation | 73/2897 | 294/18723 | 1.82e-05 | 5.38e-04 | 73 |
| GO:00109501 | Colorectum | SER | positive regulation of endopeptidase activity | 47/2897 | 179/18723 | 1.32e-04 | 2.66e-03 | 47 |
| GO:00164851 | Colorectum | SER | protein processing | 55/2897 | 225/18723 | 2.84e-04 | 4.67e-03 | 55 |
| GO:00458622 | Colorectum | MSS | positive regulation of proteolysis | 119/3467 | 372/18723 | 2.14e-10 | 2.09e-08 | 119 |
| GO:00525472 | Colorectum | MSS | regulation of peptidase activity | 130/3467 | 461/18723 | 1.81e-07 | 8.13e-06 | 130 |
| GO:00109522 | Colorectum | MSS | positive regulation of peptidase activity | 63/3467 | 197/18723 | 3.65e-06 | 1.06e-04 | 63 |
| GO:00525482 | Colorectum | MSS | regulation of endopeptidase activity | 117/3467 | 432/18723 | 6.25e-06 | 1.65e-04 | 117 |
| Page: 1 2 3 4 5 6 7 8 9 |
| Pathway ID | Tissue | Disease Stage | Description | Gene Ratio | Bg Ratio | pvalue | p.adjust | qvalue | Count |
| hsa05010 | Colorectum | AD | Alzheimer disease | 174/2092 | 384/8465 | 1.82e-19 | 9.26e-18 | 5.91e-18 | 174 |
| hsa050101 | Colorectum | AD | Alzheimer disease | 174/2092 | 384/8465 | 1.82e-19 | 9.26e-18 | 5.91e-18 | 174 |
| hsa050102 | Colorectum | SER | Alzheimer disease | 146/1580 | 384/8465 | 6.52e-20 | 2.40e-18 | 1.75e-18 | 146 |
| hsa050103 | Colorectum | SER | Alzheimer disease | 146/1580 | 384/8465 | 6.52e-20 | 2.40e-18 | 1.75e-18 | 146 |
| hsa050104 | Colorectum | MSS | Alzheimer disease | 169/1875 | 384/8465 | 1.21e-22 | 1.01e-20 | 6.21e-21 | 169 |
| hsa050105 | Colorectum | MSS | Alzheimer disease | 169/1875 | 384/8465 | 1.21e-22 | 1.01e-20 | 6.21e-21 | 169 |
| hsa050106 | Colorectum | MSI-H | Alzheimer disease | 91/797 | 384/8465 | 1.76e-17 | 6.41e-16 | 5.37e-16 | 91 |
| hsa050107 | Colorectum | MSI-H | Alzheimer disease | 91/797 | 384/8465 | 1.76e-17 | 6.41e-16 | 5.37e-16 | 91 |
| hsa0501020 | Endometrium | AEH | Alzheimer disease | 124/1197 | 384/8465 | 1.20e-20 | 3.91e-19 | 2.86e-19 | 124 |
| hsa05010110 | Endometrium | AEH | Alzheimer disease | 124/1197 | 384/8465 | 1.20e-20 | 3.91e-19 | 2.86e-19 | 124 |
| hsa0501025 | Endometrium | EEC | Alzheimer disease | 126/1237 | 384/8465 | 2.25e-20 | 7.40e-19 | 5.52e-19 | 126 |
| hsa0501035 | Endometrium | EEC | Alzheimer disease | 126/1237 | 384/8465 | 2.25e-20 | 7.40e-19 | 5.52e-19 | 126 |
| hsa0501030 | Esophagus | HGIN | Alzheimer disease | 130/1383 | 384/8465 | 5.26e-18 | 1.71e-16 | 1.36e-16 | 130 |
| hsa05010113 | Esophagus | HGIN | Alzheimer disease | 130/1383 | 384/8465 | 5.26e-18 | 1.71e-16 | 1.36e-16 | 130 |
| hsa05010210 | Esophagus | ESCC | Alzheimer disease | 263/4205 | 384/8465 | 1.80e-14 | 5.47e-13 | 2.80e-13 | 263 |
| hsa0501038 | Esophagus | ESCC | Alzheimer disease | 263/4205 | 384/8465 | 1.80e-14 | 5.47e-13 | 2.80e-13 | 263 |
| hsa0501014 | Liver | Cirrhotic | Alzheimer disease | 180/2530 | 384/8465 | 5.52e-13 | 1.36e-11 | 8.36e-12 | 180 |
| hsa0501015 | Liver | Cirrhotic | Alzheimer disease | 180/2530 | 384/8465 | 5.52e-13 | 1.36e-11 | 8.36e-12 | 180 |
| hsa0501022 | Liver | HCC | Alzheimer disease | 254/4020 | 384/8465 | 3.75e-14 | 8.97e-13 | 4.99e-13 | 254 |
| hsa0501032 | Liver | HCC | Alzheimer disease | 254/4020 | 384/8465 | 3.75e-14 | 8.97e-13 | 4.99e-13 | 254 |
| Page: 1 2 |
Top |
Cell-cell communication analysis |
| Identification of potential cell-cell interactions between two cell types and their ligand-receptor pairs for different disease states |
| Ligand | Receptor | LRpair | Pathway | Tissue | Disease Stage |
| Page: 1 |
Top |
Single-cell gene regulatory network inference analysis |
| Find out the significant the regulons (TFs) and the target genes of each regulon across cell types for different disease states |
| TF | Cell Type | Tissue | Disease Stage | Target Gene | RSS | Regulon Activity |
| ∗The dot plots of a searched regulon are shown for all cell subpopulations in each disease state of each tissue based on the regulon specific score inferred using pySCENIC and by calculating the average expression. |
| Page: 1 |
Top |
Somatic mutation of malignant transformation related genes |
| Annotation of somatic variants for genes involved in malignant transformation |
| Hugo Symbol | Variant Class | Variant Classification | dbSNP RS | HGVSc | HGVSp | HGVSp Short | SWISSPROT | BIOTYPE | SIFT | PolyPhen | Tumor Sample Barcode | Tissue | Histology | Sex | Age | Stage | Therapy Types | Drugs | Outcome |
| APH1A | SNV | Missense_Mutation | c.91N>T | p.Arg31Cys | p.R31C | Q96BI3 | protein_coding | deleterious(0) | probably_damaging(0.961) | TCGA-AR-A2LE-01 | Breast | breast invasive carcinoma | Female | >=65 | I/II | Hormone Therapy | tamoxiphen | PD | |
| APH1A | SNV | Missense_Mutation | c.91C>T | p.Arg31Cys | p.R31C | Q96BI3 | protein_coding | deleterious(0) | probably_damaging(0.961) | TCGA-C8-A26Y-01 | Breast | breast invasive carcinoma | Female | >=65 | I/II | Unknown | Unknown | SD | |
| APH1A | SNV | Missense_Mutation | novel | c.194C>A | p.Ala65Asp | p.A65D | Q96BI3 | protein_coding | tolerated(0.26) | benign(0.174) | TCGA-E9-A1ND-01 | Breast | breast invasive carcinoma | Female | >=65 | I/II | Hormone Therapy | aromasin | SD |
| APH1A | insertion | Frame_Shift_Ins | novel | c.248_249insTCTTGGTCTTTTTCTCAGGCCTGAGGGG | p.Gln83HisfsTer22 | p.Q83Hfs*22 | Q96BI3 | protein_coding | TCGA-A8-A07J-01 | Breast | breast invasive carcinoma | Female | <65 | I/II | Chemotherapy | 5-fluorouracil | CR | ||
| APH1A | SNV | Missense_Mutation | c.236N>T | p.Ser79Phe | p.S79F | Q96BI3 | protein_coding | deleterious(0) | probably_damaging(0.995) | TCGA-C5-A1BL-01 | Cervix | cervical & endocervical cancer | Female | <65 | I/II | Unknown | Unknown | SD | |
| APH1A | SNV | Missense_Mutation | c.91N>T | p.Arg31Cys | p.R31C | Q96BI3 | protein_coding | deleterious(0) | probably_damaging(0.961) | TCGA-EK-A2R8-01 | Cervix | cervical & endocervical cancer | Female | <65 | I/II | Unknown | Unknown | SD | |
| APH1A | SNV | Missense_Mutation | novel | c.779N>A | p.Arg260His | p.R260H | Q96BI3 | protein_coding | deleterious_low_confidence(0.02) | benign(0) | TCGA-AA-A010-01 | Colorectum | colon adenocarcinoma | Female | <65 | I/II | Chemotherapy | folinic | CR |
| APH1A | SNV | Missense_Mutation | novel | c.625N>A | p.Trp209Arg | p.W209R | Q96BI3 | protein_coding | tolerated(0.34) | benign(0) | TCGA-AP-A1DO-01 | Endometrium | uterine corpus endometrioid carcinoma | Female | <65 | I/II | Unknown | Unknown | SD |
| APH1A | SNV | Missense_Mutation | rs782641325 | c.740N>A | p.Arg247Gln | p.R247Q | Q96BI3 | protein_coding | tolerated(0.43) | benign(0.033) | TCGA-AX-A1C9-01 | Endometrium | uterine corpus endometrioid carcinoma | Female | >=65 | I/II | Unknown | Unknown | SD |
| APH1A | SNV | Missense_Mutation | rs71622685 | c.755N>A | p.Arg252Gln | p.R252Q | Q96BI3 | protein_coding | tolerated_low_confidence(0.29) | benign(0) | TCGA-EO-A22U-01 | Endometrium | uterine corpus endometrioid carcinoma | Female | >=65 | I/II | Unknown | Unknown | SD |
| Page: 1 2 3 |
Top |
Related drugs of malignant transformation related genes |
| Identification of chemicals and drugs interact with genes involved in malignant transfromation |
| (DGIdb 4.0) |
| Entrez ID | Symbol | Category | Interaction Types | Drug Claim Name | Drug Name | PMIDs |
| 51107 | APH1A | DRUGGABLE GENOME, CLINICALLY ACTIONABLE | PMID28350212-Compound-15 | |||
| 51107 | APH1A | DRUGGABLE GENOME, CLINICALLY ACTIONABLE | PMID28350212-Compound-25 | |||
| 51107 | APH1A | DRUGGABLE GENOME, CLINICALLY ACTIONABLE | SEMAGACESTAT | SEMAGACESTAT | 19443228 | |
| 51107 | APH1A | DRUGGABLE GENOME, CLINICALLY ACTIONABLE | PMID28350212-Compound-20 | |||
| 51107 | APH1A | DRUGGABLE GENOME, CLINICALLY ACTIONABLE | PMID28350212-Compound-23 | |||
| 51107 | APH1A | DRUGGABLE GENOME, CLINICALLY ACTIONABLE | PMID28350212-Compound-35 | |||
| 51107 | APH1A | DRUGGABLE GENOME, CLINICALLY ACTIONABLE | PMID28350212-Compound-30 | |||
| 51107 | APH1A | DRUGGABLE GENOME, CLINICALLY ACTIONABLE | PMID28350212-Compound-7 | |||
| 51107 | APH1A | DRUGGABLE GENOME, CLINICALLY ACTIONABLE | inhibitor | MK0752 | ||
| 51107 | APH1A | DRUGGABLE GENOME, CLINICALLY ACTIONABLE | inhibitor | PF03084014 |
| Page: 1 2 3 4 |

Copyright 2023-Present -The University of Texas Health Science Center at Houston |