
|
|||||
|
 | |
| |
| |
| |
| |
| |
|
Gene: ANP32E |
Gene summary for ANP32E |
| Gene information | Species | Human | Gene symbol | ANP32E | Gene ID | 81611 |
| Gene name | acidic nuclear phosphoprotein 32 family member E | |
| Gene Alias | LANP-L | |
| Cytomap | 1q21.2 | |
| Gene Type | protein-coding | GO ID | GO:0006325 | UniProtAcc | Q9BTT0 |
Top |
Malignant transformation analysis |
| Identification of the aberrant gene expression in precancerous and cancerous lesions by comparing the gene expression of stem-like cells in diseased tissues with normal stem cells |
| Entrez ID | Symbol | Replicates | Species | Organ | Tissue | Adj P-value | Log2FC | Malignancy |
| 81611 | ANP32E | P57T-E | Human | Esophagus | ESCC | 1.89e-09 | 3.23e-01 | 0.0926 |
| 81611 | ANP32E | P61T-E | Human | Esophagus | ESCC | 6.13e-20 | 5.24e-01 | 0.099 |
| 81611 | ANP32E | P62T-E | Human | Esophagus | ESCC | 4.99e-33 | 7.15e-01 | 0.1302 |
| 81611 | ANP32E | P65T-E | Human | Esophagus | ESCC | 7.92e-15 | 3.52e-01 | 0.0978 |
| 81611 | ANP32E | P74T-E | Human | Esophagus | ESCC | 1.55e-34 | 1.20e+00 | 0.1479 |
| 81611 | ANP32E | P75T-E | Human | Esophagus | ESCC | 2.32e-55 | 1.20e+00 | 0.1125 |
| 81611 | ANP32E | P76T-E | Human | Esophagus | ESCC | 1.08e-32 | 9.80e-01 | 0.1207 |
| 81611 | ANP32E | P79T-E | Human | Esophagus | ESCC | 1.47e-29 | 6.86e-01 | 0.1154 |
| 81611 | ANP32E | P80T-E | Human | Esophagus | ESCC | 2.17e-35 | 1.07e+00 | 0.155 |
| 81611 | ANP32E | P82T-E | Human | Esophagus | ESCC | 1.02e-09 | 8.24e-01 | 0.1072 |
| 81611 | ANP32E | P83T-E | Human | Esophagus | ESCC | 3.66e-48 | 1.77e+00 | 0.1738 |
| 81611 | ANP32E | P84T-E | Human | Esophagus | ESCC | 9.01e-07 | 5.01e-01 | 0.0933 |
| 81611 | ANP32E | P89T-E | Human | Esophagus | ESCC | 8.69e-25 | 1.84e+00 | 0.1752 |
| 81611 | ANP32E | P91T-E | Human | Esophagus | ESCC | 9.55e-17 | 2.21e+00 | 0.1828 |
| 81611 | ANP32E | P107T-E | Human | Esophagus | ESCC | 5.09e-56 | 1.46e+00 | 0.171 |
| 81611 | ANP32E | P126T-E | Human | Esophagus | ESCC | 8.12e-04 | 8.43e-01 | 0.1125 |
| 81611 | ANP32E | P127T-E | Human | Esophagus | ESCC | 1.50e-10 | 2.54e-01 | 0.0826 |
| 81611 | ANP32E | P128T-E | Human | Esophagus | ESCC | 6.54e-24 | 9.32e-01 | 0.1241 |
| 81611 | ANP32E | P130T-E | Human | Esophagus | ESCC | 1.95e-68 | 1.90e+00 | 0.1676 |
| 81611 | ANP32E | S43 | Human | Liver | Cirrhotic | 1.08e-07 | -2.57e-01 | -0.0187 |
| Page: 1 2 3 4 5 6 7 |
| Tissue | Expression Dynamics | Abbreviation |
| Breast | 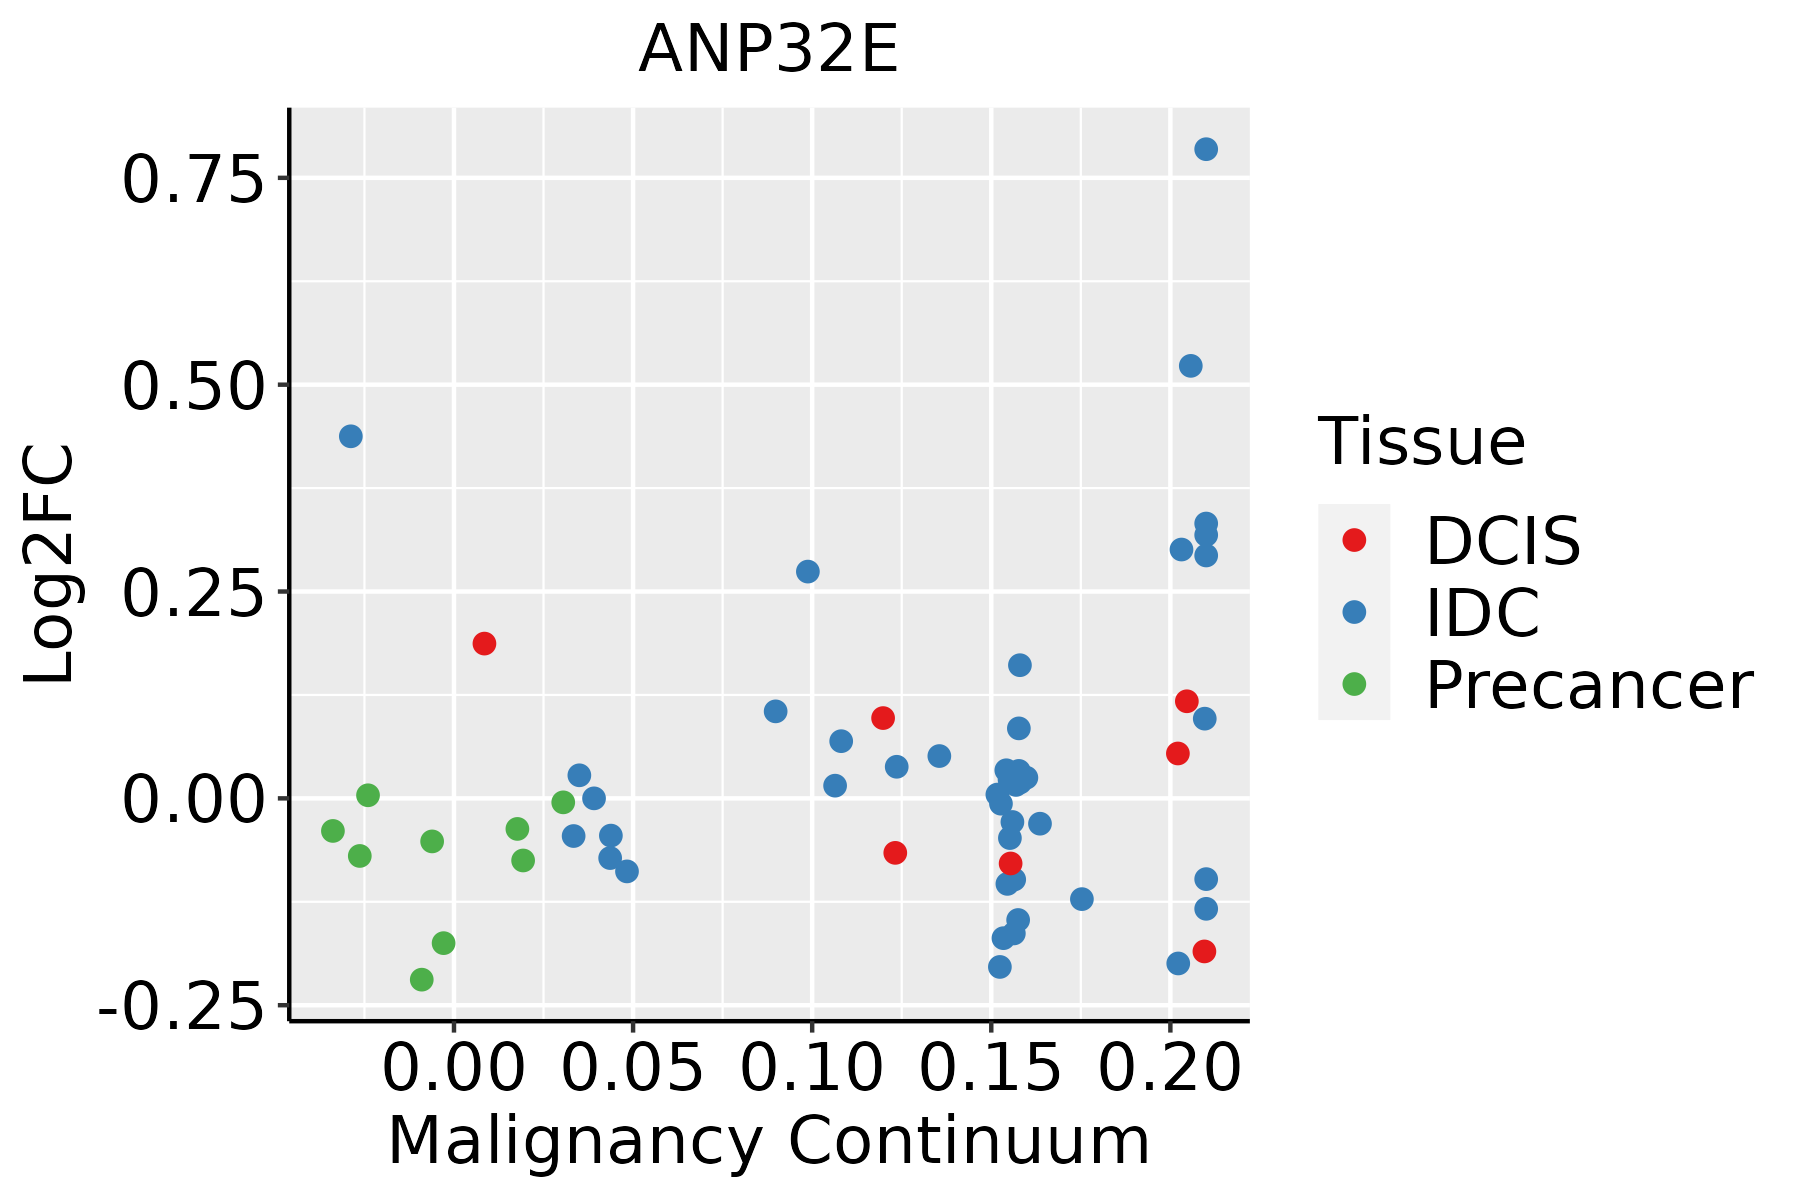 | IDC: Invasive ductal carcinoma |
| DCIS: Ductal carcinoma in situ | ||
| Precancer(BRCA1-mut): Precancerous lesion from BRCA1 mutation carriers | ||
| Esophagus | 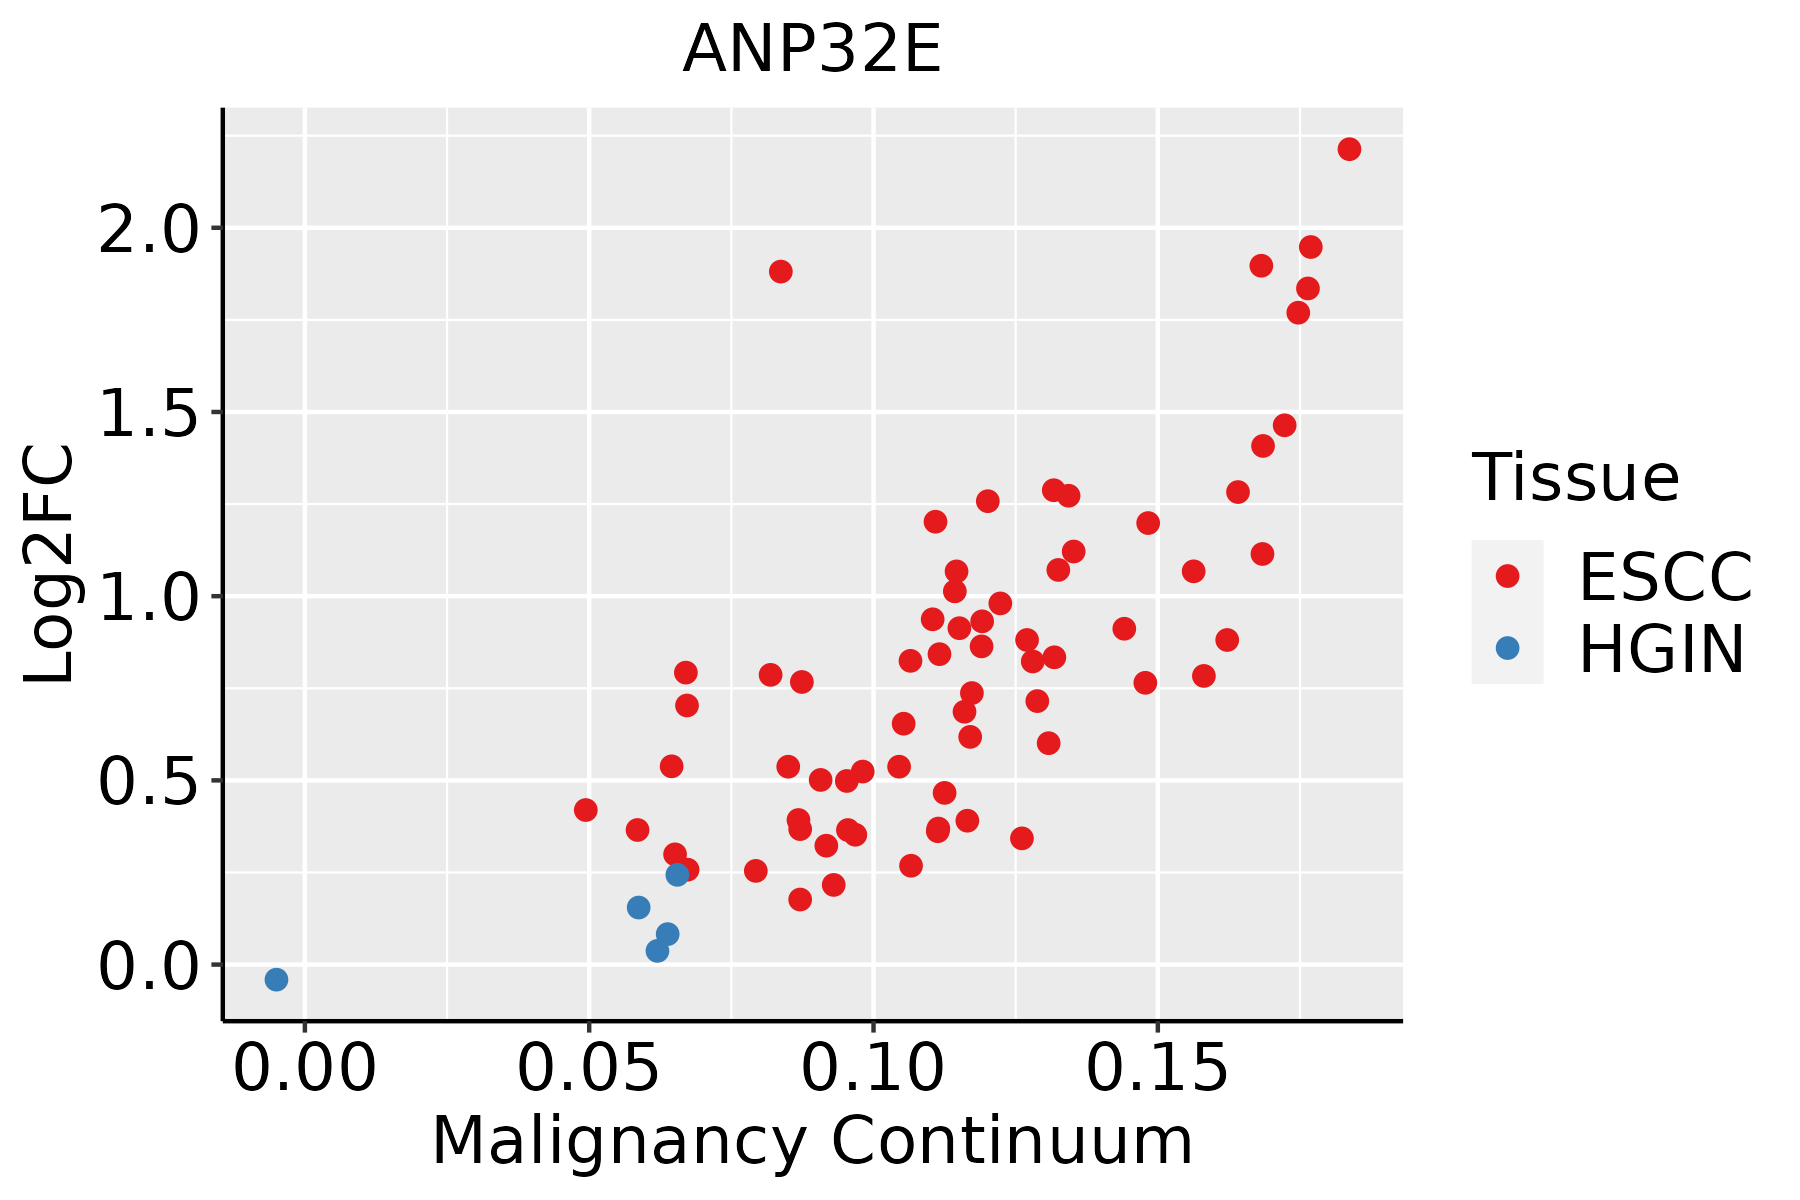 | ESCC: Esophageal squamous cell carcinoma |
| HGIN: High-grade intraepithelial neoplasias | ||
| LGIN: Low-grade intraepithelial neoplasias | ||
| Liver |  | HCC: Hepatocellular carcinoma |
| NAFLD: Non-alcoholic fatty liver disease | ||
| Oral Cavity |  | EOLP: Erosive Oral lichen planus |
| LP: leukoplakia | ||
| NEOLP: Non-erosive oral lichen planus | ||
| OSCC: Oral squamous cell carcinoma | ||
| Skin | 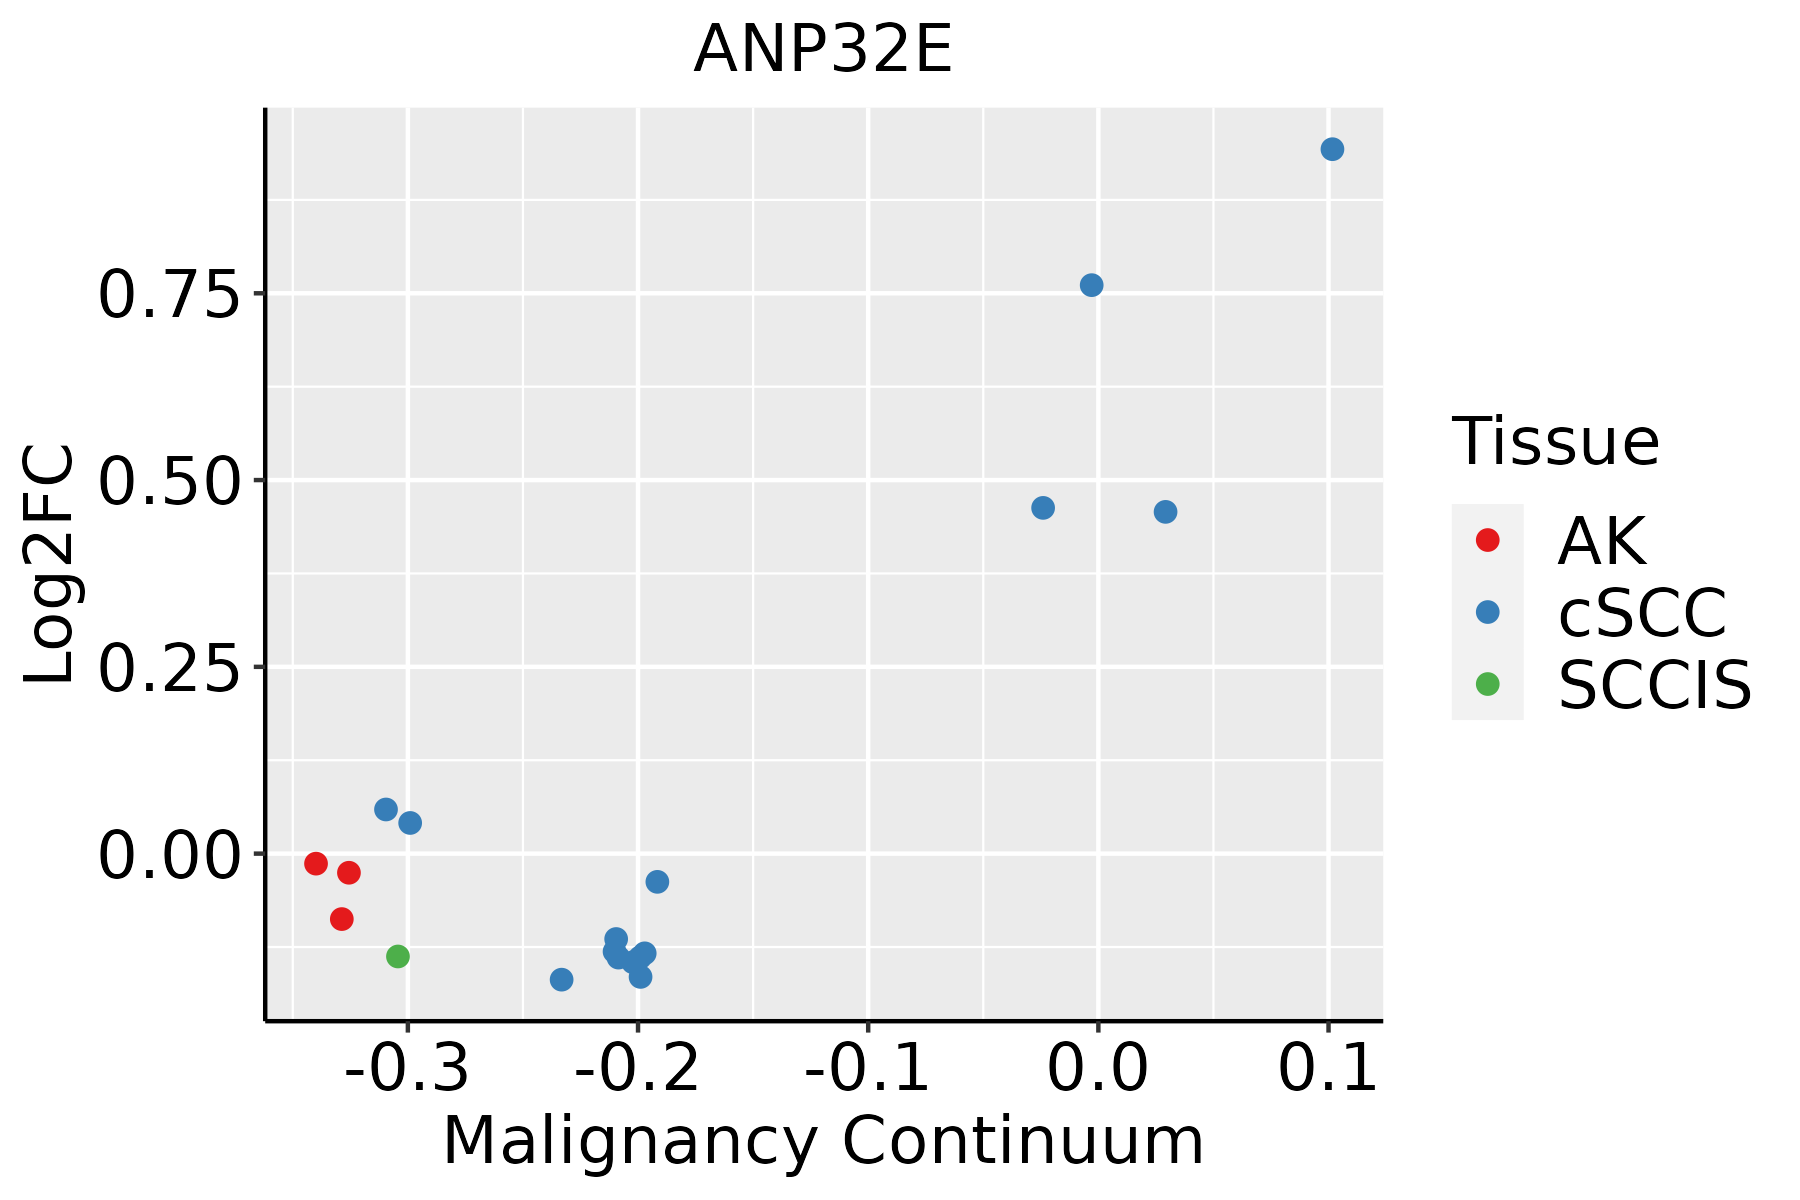 | AK: Actinic keratosis |
| cSCC: Cutaneous squamous cell carcinoma | ||
| SCCIS:squamous cell carcinoma in situ | ||
| Thyroid | 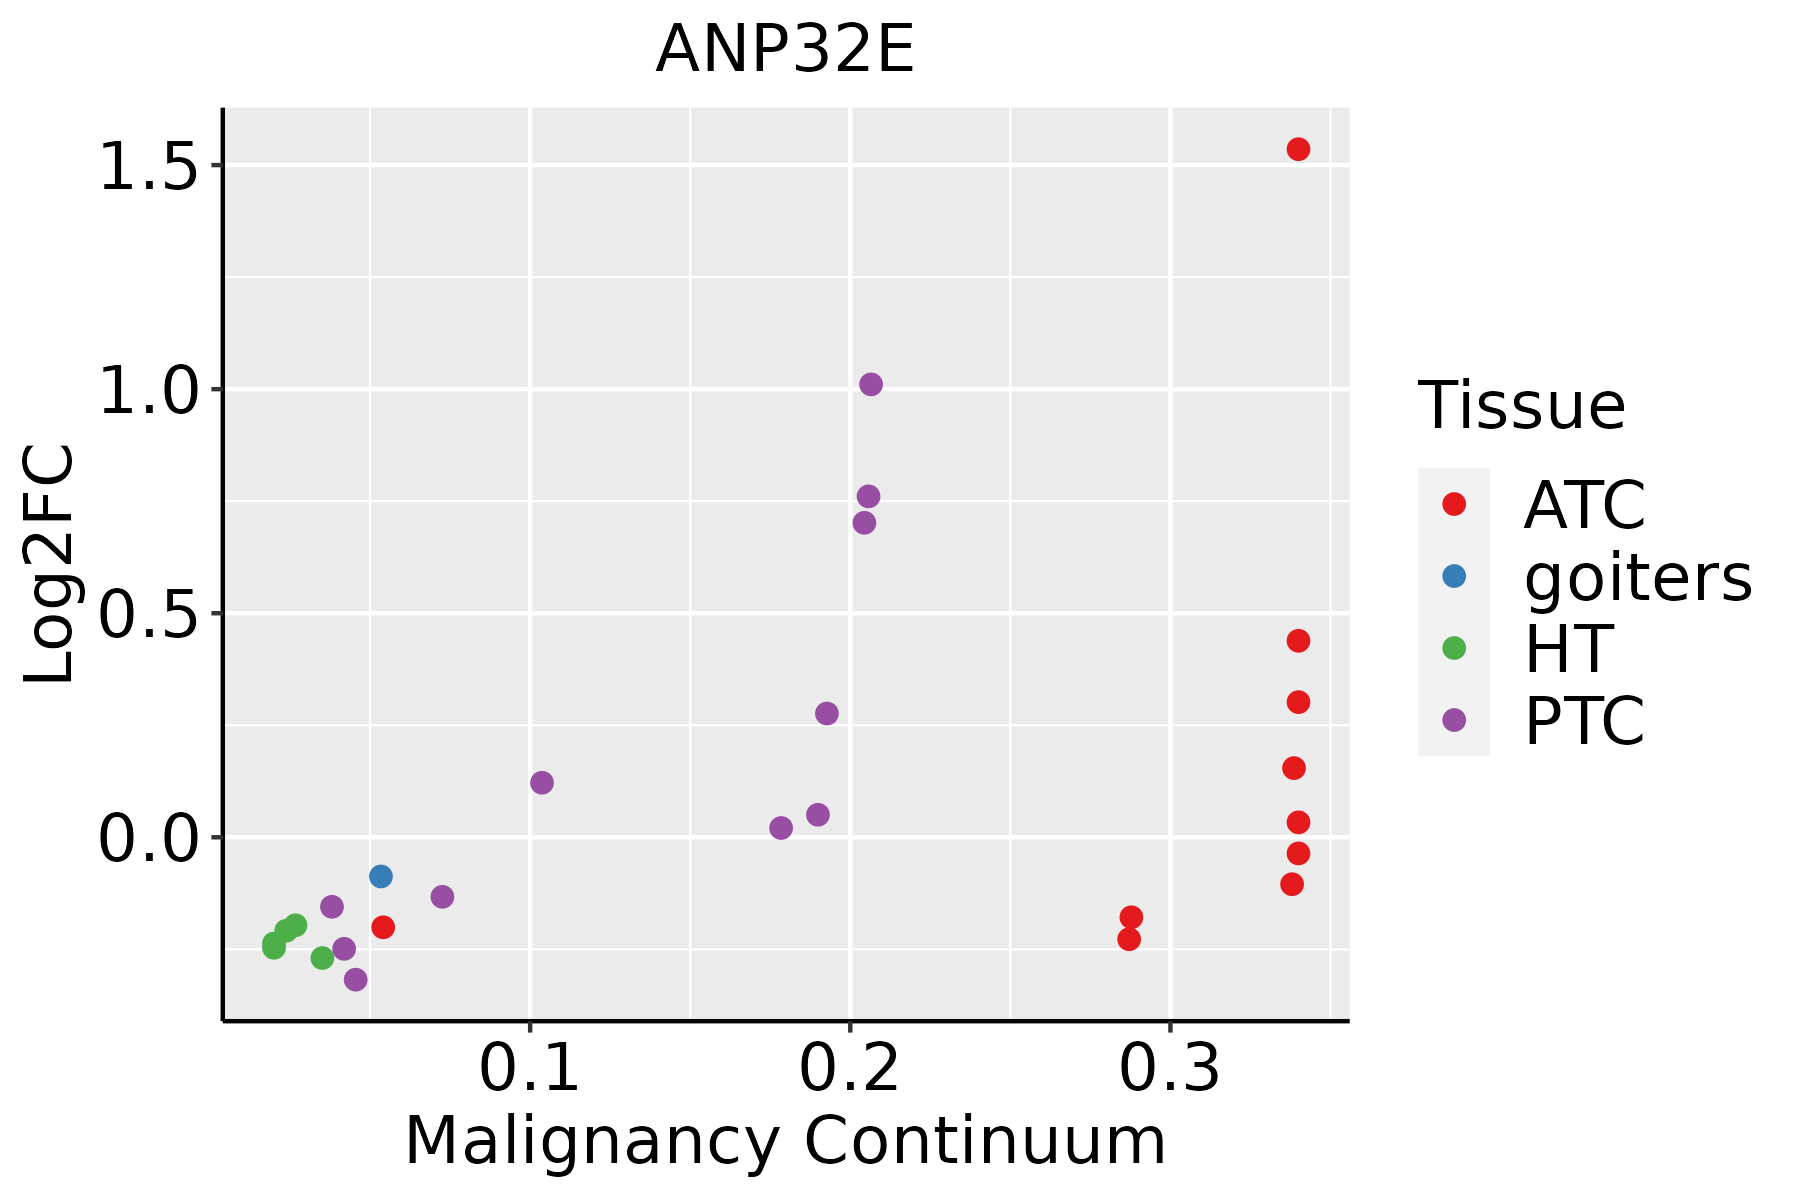 | ATC: Anaplastic thyroid cancer |
| HT: Hashimoto's thyroiditis | ||
| PTC: Papillary thyroid cancer |
| ∗log2FC in expression of this searched gene in stem-like cells from each diseased tissue sample relative to stem-like cells in normal samples in each tissue plotted against the malignancy continuum. Samples are colored based on if they are from different disease stage. |
Top |
Malignant transformation related pathway analysis |
| Find out the enriched GO biological processes and KEGG pathways involved in transition from healthy to precancer to cancer |
| Tissue | Disease Stage | Enriched GO biological Processes |
| Colorectum | AD |  |
| Colorectum | SER |  |
| Colorectum | MSS |  |
| Colorectum | MSI-H |  |
| Colorectum | FAP |  |
| ∗Top 15 enriched GO BP terms are showed in the bar plot of each disease state in each tissue. Each row represents a significant GO biological process which is colored according to the -log10(p.adjust). |
| Page: 1 2 3 4 5 6 7 8 9 |
| GO ID | Tissue | Disease Stage | Description | Gene Ratio | Bg Ratio | pvalue | p.adjust | Count |
| GO:000632516 | Esophagus | HGIN | chromatin organization | 92/2587 | 409/18723 | 1.05e-06 | 4.16e-05 | 92 |
| GO:000632517 | Esophagus | ESCC | chromatin organization | 240/8552 | 409/18723 | 6.52e-08 | 1.14e-06 | 240 |
| GO:0043486 | Esophagus | ESCC | histone exchange | 16/8552 | 22/18723 | 9.46e-03 | 3.28e-02 | 16 |
| GO:000632511 | Liver | HCC | chromatin organization | 206/7958 | 409/18723 | 7.23e-04 | 4.41e-03 | 206 |
| GO:000632510 | Oral cavity | OSCC | chromatin organization | 190/7305 | 409/18723 | 1.17e-03 | 5.97e-03 | 190 |
| GO:000632521 | Oral cavity | NEOLP | chromatin organization | 70/2005 | 409/18723 | 4.97e-05 | 6.83e-04 | 70 |
| GO:000632519 | Skin | cSCC | chromatin organization | 147/4864 | 409/18723 | 4.41e-06 | 6.52e-05 | 147 |
| GO:000633812 | Skin | cSCC | chromatin remodeling | 94/4864 | 255/18723 | 7.58e-05 | 7.26e-04 | 94 |
| GO:00718241 | Skin | cSCC | protein-DNA complex subunit organization | 87/4864 | 241/18723 | 3.09e-04 | 2.47e-03 | 87 |
| GO:00434861 | Skin | cSCC | histone exchange | 12/4864 | 22/18723 | 4.04e-03 | 2.15e-02 | 12 |
| GO:000632520 | Thyroid | PTC | chromatin organization | 183/5968 | 409/18723 | 2.55e-08 | 5.70e-07 | 183 |
| GO:00063385 | Thyroid | PTC | chromatin remodeling | 106/5968 | 255/18723 | 6.56e-04 | 4.13e-03 | 106 |
| GO:0006325110 | Thyroid | ATC | chromatin organization | 189/6293 | 409/18723 | 6.40e-08 | 1.13e-06 | 189 |
| GO:000633813 | Thyroid | ATC | chromatin remodeling | 109/6293 | 255/18723 | 1.38e-03 | 7.15e-03 | 109 |
| GO:00718242 | Thyroid | ATC | protein-DNA complex subunit organization | 103/6293 | 241/18723 | 1.84e-03 | 9.03e-03 | 103 |
| Page: 1 |
| Pathway ID | Tissue | Disease Stage | Description | Gene Ratio | Bg Ratio | pvalue | p.adjust | qvalue | Count |
| Page: 1 |
Top |
Cell-cell communication analysis |
| Identification of potential cell-cell interactions between two cell types and their ligand-receptor pairs for different disease states |
| Ligand | Receptor | LRpair | Pathway | Tissue | Disease Stage |
| Page: 1 |
Top |
Single-cell gene regulatory network inference analysis |
| Find out the significant the regulons (TFs) and the target genes of each regulon across cell types for different disease states |
| TF | Cell Type | Tissue | Disease Stage | Target Gene | RSS | Regulon Activity |
| ∗The dot plots of a searched regulon are shown for all cell subpopulations in each disease state of each tissue based on the regulon specific score inferred using pySCENIC and by calculating the average expression. |
| Page: 1 |
Top |
Somatic mutation of malignant transformation related genes |
| Annotation of somatic variants for genes involved in malignant transformation |
| Hugo Symbol | Variant Class | Variant Classification | dbSNP RS | HGVSc | HGVSp | HGVSp Short | SWISSPROT | BIOTYPE | SIFT | PolyPhen | Tumor Sample Barcode | Tissue | Histology | Sex | Age | Stage | Therapy Types | Drugs | Outcome |
| ANP32E | SNV | Missense_Mutation | rs782603651 | c.200N>A | p.Arg67Gln | p.R67Q | Q9BTT0 | protein_coding | tolerated(0.09) | benign(0.183) | TCGA-3C-AALJ-01 | Breast | breast invasive carcinoma | Female | <65 | I/II | Chemotherapy | doxorubicin | SD |
| ANP32E | SNV | Missense_Mutation | c.176N>A | p.Arg59Gln | p.R59Q | Q9BTT0 | protein_coding | tolerated(0.2) | benign(0.015) | TCGA-D8-A140-01 | Breast | breast invasive carcinoma | Female | <65 | I/II | Chemotherapy | doxorubicin+cyclophosphamid | SD | |
| ANP32E | SNV | Missense_Mutation | c.230N>T | p.Ser77Phe | p.S77F | Q9BTT0 | protein_coding | tolerated(0.16) | possibly_damaging(0.668) | TCGA-C5-A1MH-01 | Cervix | cervical & endocervical cancer | Female | >=65 | III/IV | Chemotherapy | cisplatin | PD | |
| ANP32E | insertion | In_Frame_Ins | novel | c.37_38insGAGAGAGAGAGAGAGGCAGAG | p.Asn13delinsArgGluArgGluArgGlyArgAsp | p.N13delinsRERERGRD | Q9BTT0 | protein_coding | TCGA-DS-A1OC-01 | Cervix | cervical & endocervical cancer | Female | <65 | I/II | Chemotherapy | gemcitabine | SD | ||
| ANP32E | SNV | Missense_Mutation | rs143260001 | c.746N>A | p.Gly249Asp | p.G249D | Q9BTT0 | protein_coding | tolerated(0.38) | benign(0.001) | TCGA-AA-3984-01 | Colorectum | colon adenocarcinoma | Female | <65 | I/II | Unknown | Unknown | SD |
| ANP32E | SNV | Missense_Mutation | rs782603651 | c.200N>A | p.Arg67Gln | p.R67Q | Q9BTT0 | protein_coding | tolerated(0.09) | benign(0.183) | TCGA-CA-6718-01 | Colorectum | colon adenocarcinoma | Male | <65 | I/II | Unknown | Unknown | PD |
| ANP32E | SNV | Missense_Mutation | rs782603651 | c.200G>A | p.Arg67Gln | p.R67Q | Q9BTT0 | protein_coding | tolerated(0.09) | benign(0.183) | TCGA-F5-6814-01 | Colorectum | rectum adenocarcinoma | Male | <65 | I/II | Unknown | Unknown | SD |
| ANP32E | SNV | Missense_Mutation | novel | c.316N>T | p.Val106Leu | p.V106L | Q9BTT0 | protein_coding | tolerated(1) | benign(0.03) | TCGA-A5-A0G2-01 | Endometrium | uterine corpus endometrioid carcinoma | Female | <65 | III/IV | Unknown | Unknown | SD |
| ANP32E | SNV | Missense_Mutation | novel | c.139N>A | p.Leu47Met | p.L47M | Q9BTT0 | protein_coding | deleterious(0) | probably_damaging(0.999) | TCGA-A5-A2K5-01 | Endometrium | uterine corpus endometrioid carcinoma | Female | >=65 | I/II | Unknown | Unknown | SD |
| ANP32E | SNV | Missense_Mutation | novel | c.416N>C | p.Leu139Pro | p.L139P | Q9BTT0 | protein_coding | deleterious(0) | probably_damaging(0.998) | TCGA-AJ-A8CW-01 | Endometrium | uterine corpus endometrioid carcinoma | Female | <65 | I/II | Unknown | Unknown | SD |
| Page: 1 2 3 4 |
Top |
Related drugs of malignant transformation related genes |
| Identification of chemicals and drugs interact with genes involved in malignant transfromation |
| (DGIdb 4.0) |
| Entrez ID | Symbol | Category | Interaction Types | Drug Claim Name | Drug Name | PMIDs |
| Page: 1 |

Copyright 2023-Present -The University of Texas Health Science Center at Houston |