
|
|||||
|
 | |
| |
| |
| |
| |
| |
|
Gene: ANKRD28 |
Gene summary for ANKRD28 |
| Gene information | Species | Human | Gene symbol | ANKRD28 | Gene ID | 23243 |
| Gene name | ankyrin repeat domain 28 | |
| Gene Alias | CFAP79 | |
| Cytomap | 3p25.1 | |
| Gene Type | protein-coding | GO ID | GO:0005575 | UniProtAcc | O15084 |
Top |
Malignant transformation analysis |
| Identification of the aberrant gene expression in precancerous and cancerous lesions by comparing the gene expression of stem-like cells in diseased tissues with normal stem cells |
| Entrez ID | Symbol | Replicates | Species | Organ | Tissue | Adj P-value | Log2FC | Malignancy |
| 23243 | ANKRD28 | AEH-subject2 | Human | Endometrium | AEH | 4.67e-03 | 2.25e-01 | -0.2525 |
| 23243 | ANKRD28 | AEH-subject3 | Human | Endometrium | AEH | 2.37e-04 | 2.56e-01 | -0.2576 |
| 23243 | ANKRD28 | AEH-subject4 | Human | Endometrium | AEH | 3.98e-05 | 3.56e-01 | -0.2657 |
| 23243 | ANKRD28 | AEH-subject5 | Human | Endometrium | AEH | 1.51e-05 | 3.57e-01 | -0.2953 |
| 23243 | ANKRD28 | EEC-subject1 | Human | Endometrium | EEC | 4.60e-05 | 3.05e-01 | -0.2682 |
| 23243 | ANKRD28 | EEC-subject2 | Human | Endometrium | EEC | 1.44e-07 | 3.85e-01 | -0.2607 |
| 23243 | ANKRD28 | EEC-subject3 | Human | Endometrium | EEC | 8.83e-06 | 1.40e-01 | -0.2525 |
| 23243 | ANKRD28 | EEC-subject4 | Human | Endometrium | EEC | 1.39e-08 | 3.81e-01 | -0.2571 |
| 23243 | ANKRD28 | GSM6177620_NYU_UCEC1_lib1_lib1 | Human | Endometrium | EEC | 5.45e-11 | -3.82e-03 | -0.1869 |
| 23243 | ANKRD28 | GSM6177620_NYU_UCEC1_lib2_lib2 | Human | Endometrium | EEC | 2.35e-12 | 5.64e-03 | -0.1875 |
| 23243 | ANKRD28 | GSM6177620_NYU_UCEC1_lib3_lib3 | Human | Endometrium | EEC | 1.35e-12 | -1.76e-02 | -0.1883 |
| 23243 | ANKRD28 | GSM6177621_NYU_UCEC2_lib1_lib1 | Human | Endometrium | EEC | 4.81e-06 | 1.10e-01 | -0.1934 |
| 23243 | ANKRD28 | GSM6177622_NYU_UCEC3_lib1_lib1 | Human | Endometrium | EEC | 2.56e-10 | 2.47e-02 | -0.1917 |
| 23243 | ANKRD28 | GSM6177622_NYU_UCEC3_lib2_lib2 | Human | Endometrium | EEC | 1.49e-12 | -1.06e-03 | -0.1916 |
| 23243 | ANKRD28 | LZE24T | Human | Esophagus | ESCC | 2.89e-02 | 8.44e-02 | 0.0596 |
| 23243 | ANKRD28 | P1T-E | Human | Esophagus | ESCC | 3.22e-03 | 5.09e-02 | 0.0875 |
| 23243 | ANKRD28 | P2T-E | Human | Esophagus | ESCC | 4.74e-05 | -5.87e-03 | 0.1177 |
| 23243 | ANKRD28 | P4T-E | Human | Esophagus | ESCC | 4.90e-11 | 1.34e-01 | 0.1323 |
| 23243 | ANKRD28 | P5T-E | Human | Esophagus | ESCC | 1.57e-05 | 1.23e-01 | 0.1327 |
| 23243 | ANKRD28 | P8T-E | Human | Esophagus | ESCC | 9.89e-18 | 5.24e-01 | 0.0889 |
| Page: 1 2 3 4 5 6 7 8 9 10 |
| Tissue | Expression Dynamics | Abbreviation |
| Cervix | 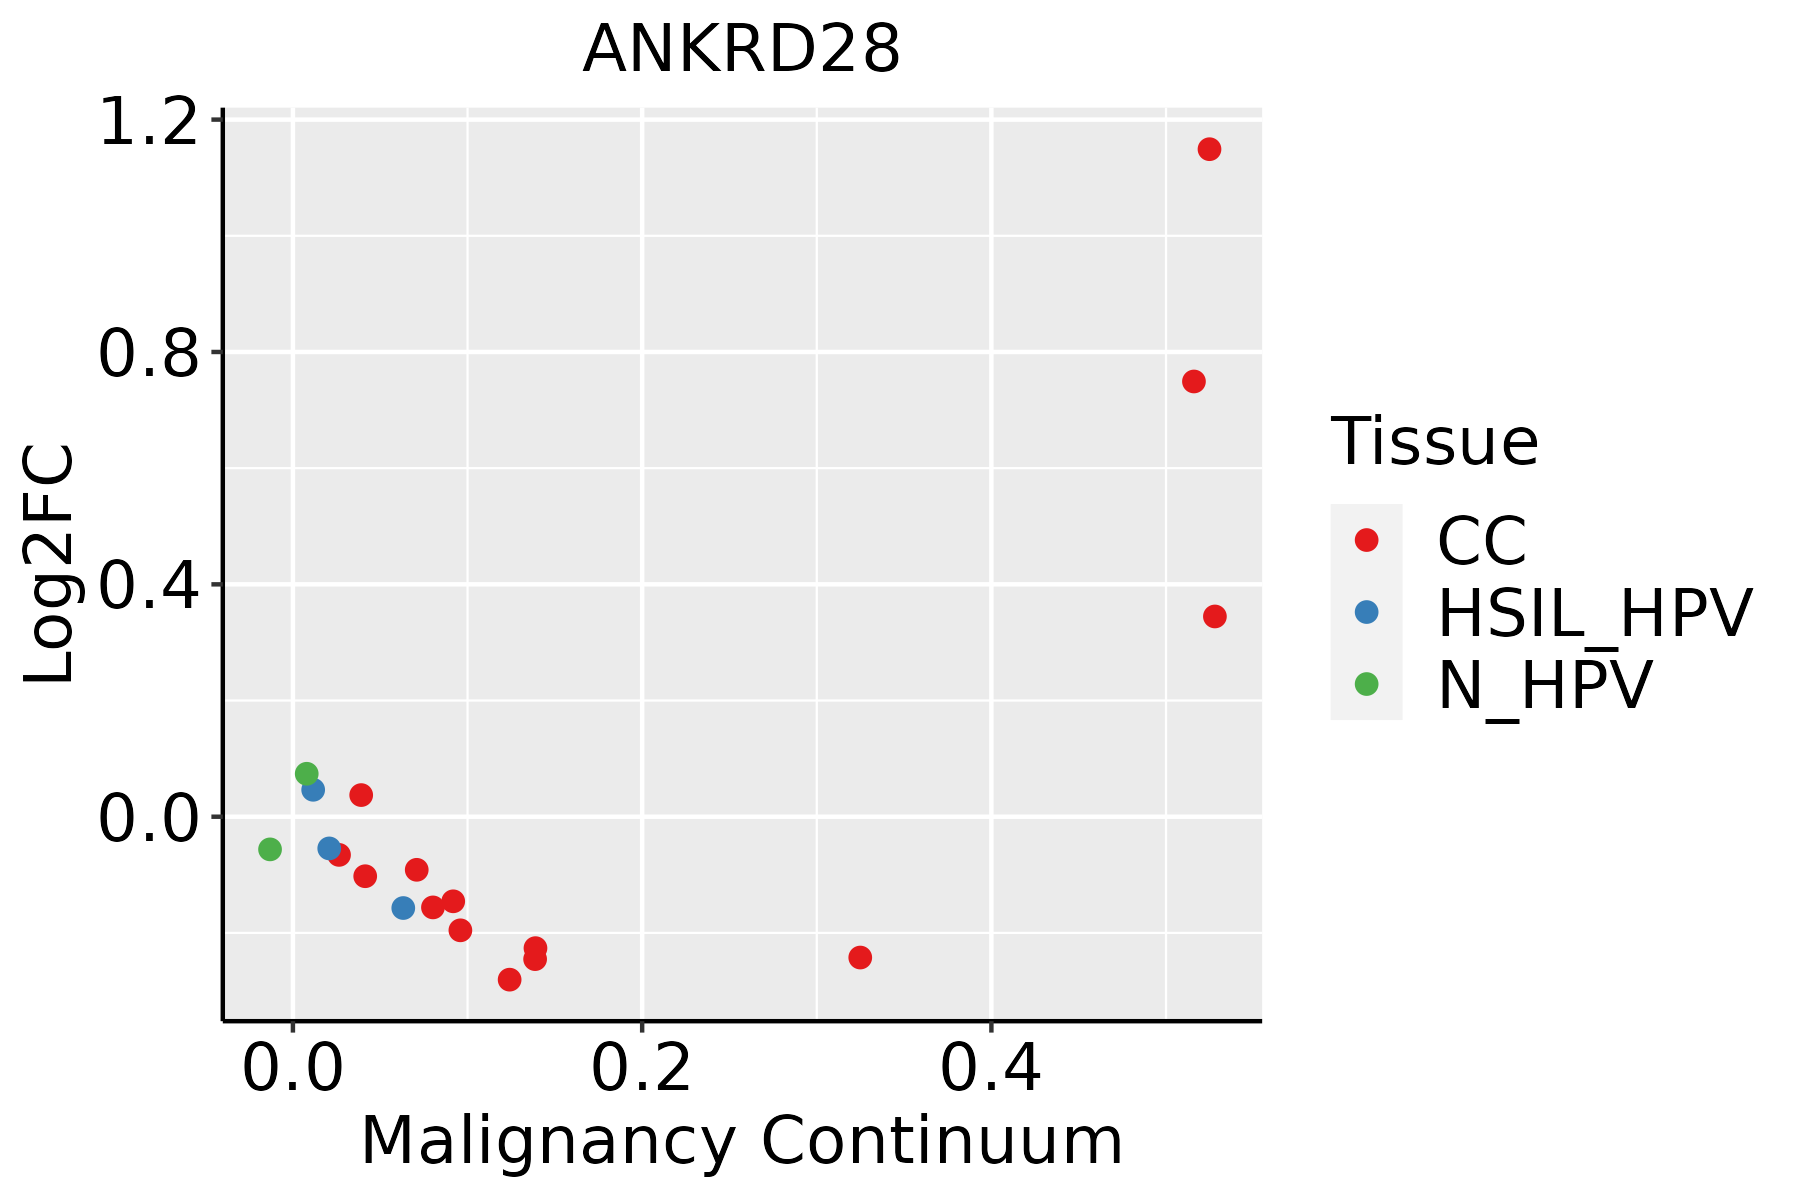 | CC: Cervix cancer |
| HSIL_HPV: HPV-infected high-grade squamous intraepithelial lesions | ||
| N_HPV: HPV-infected normal cervix | ||
| Colorectum (GSE201348) |  | FAP: Familial adenomatous polyposis |
| CRC: Colorectal cancer | ||
| Colorectum (HTA11) |  | AD: Adenomas |
| SER: Sessile serrated lesions | ||
| MSI-H: Microsatellite-high colorectal cancer | ||
| MSS: Microsatellite stable colorectal cancer | ||
| Endometrium | 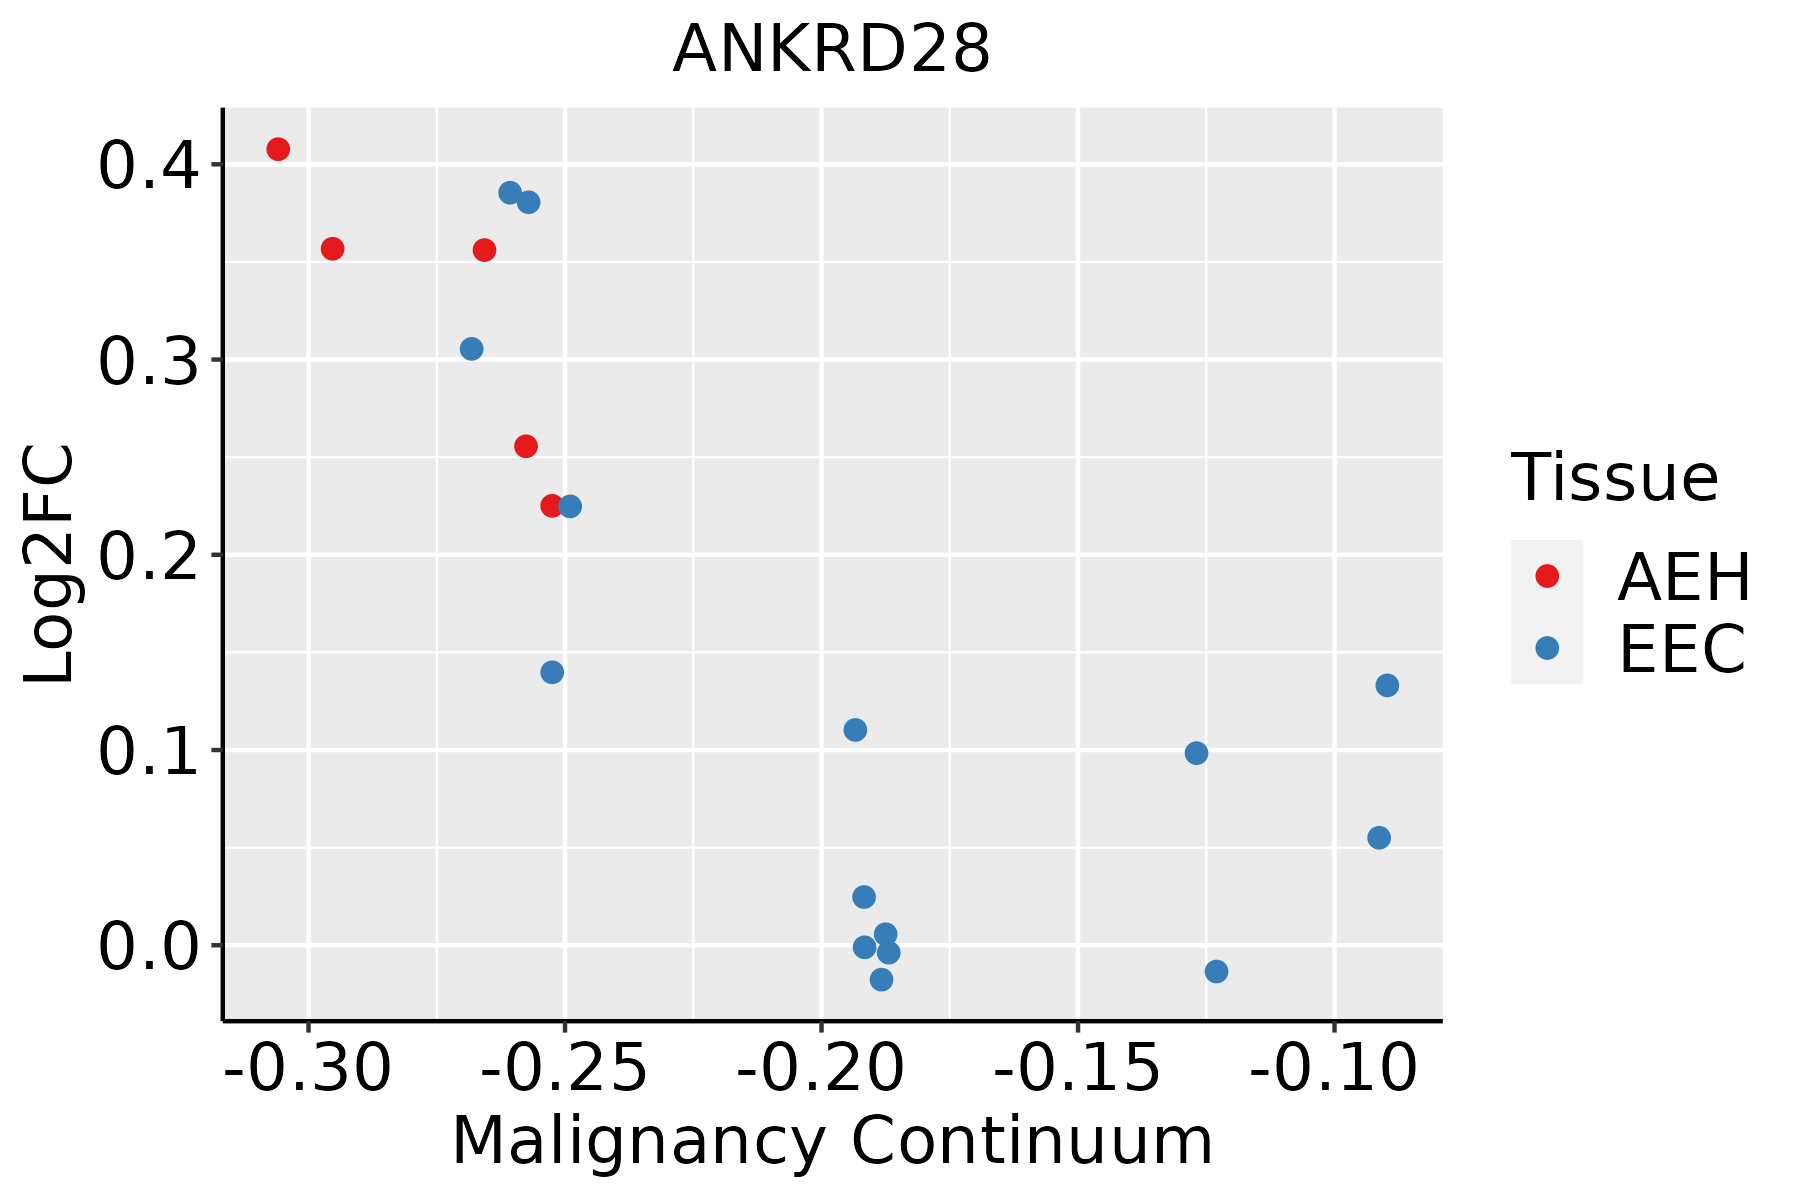 | AEH: Atypical endometrial hyperplasia |
| EEC: Endometrioid Cancer | ||
| Esophagus | 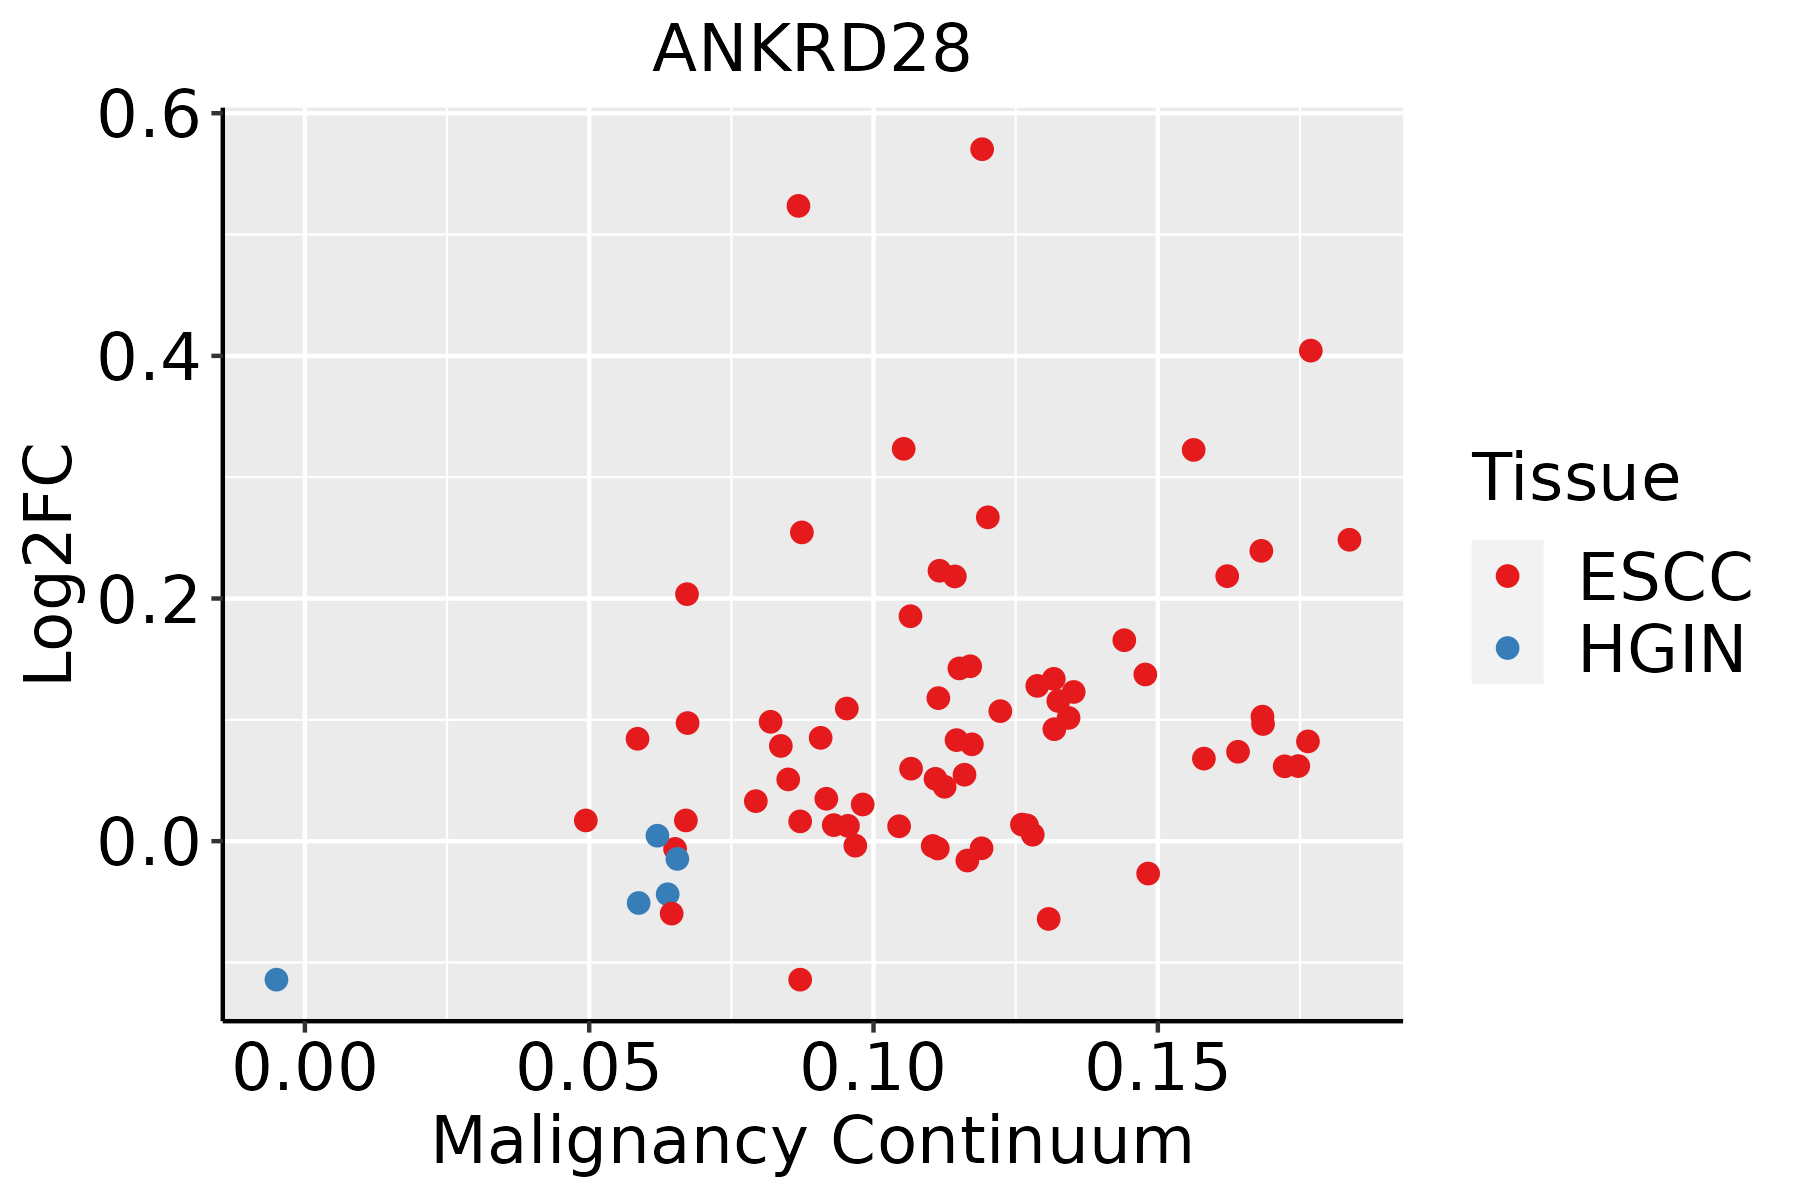 | ESCC: Esophageal squamous cell carcinoma |
| HGIN: High-grade intraepithelial neoplasias | ||
| LGIN: Low-grade intraepithelial neoplasias | ||
| Liver | 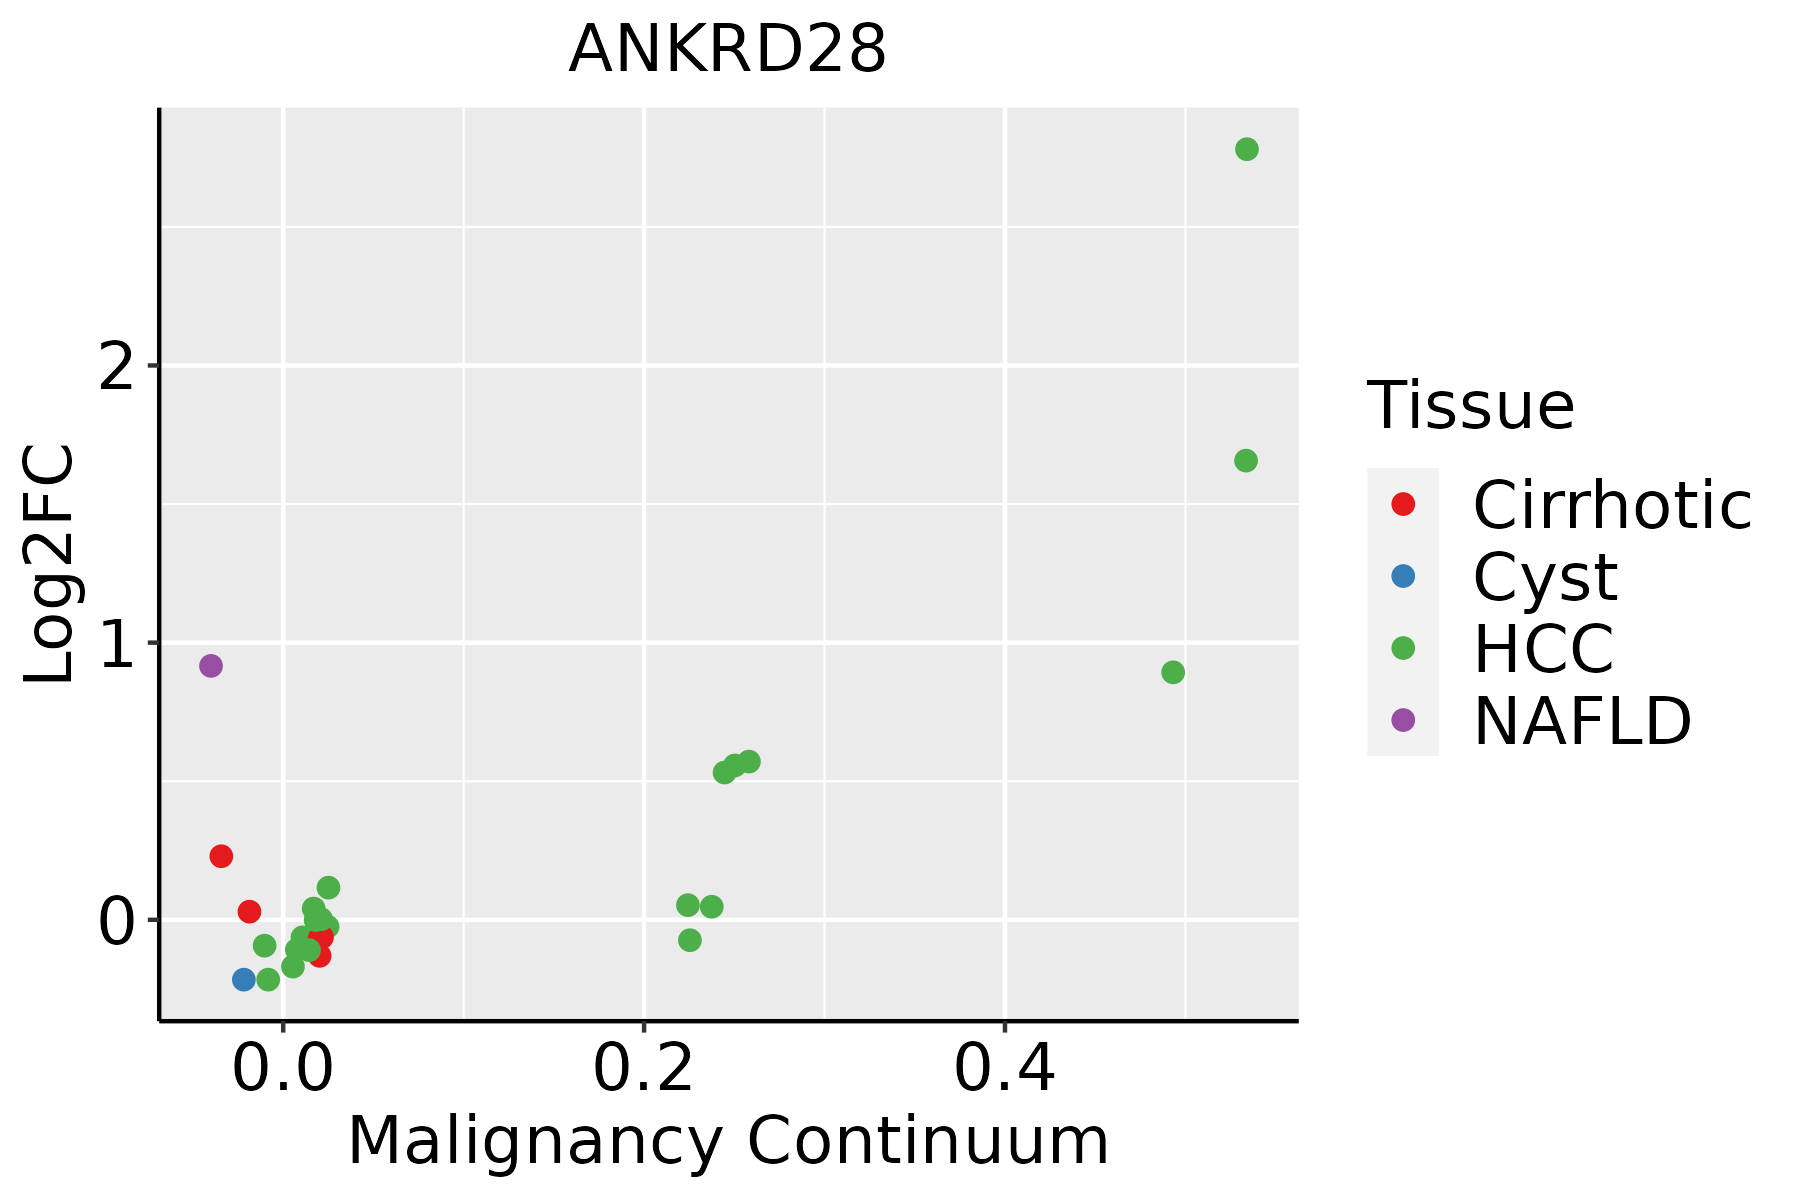 | HCC: Hepatocellular carcinoma |
| NAFLD: Non-alcoholic fatty liver disease | ||
| Lung | 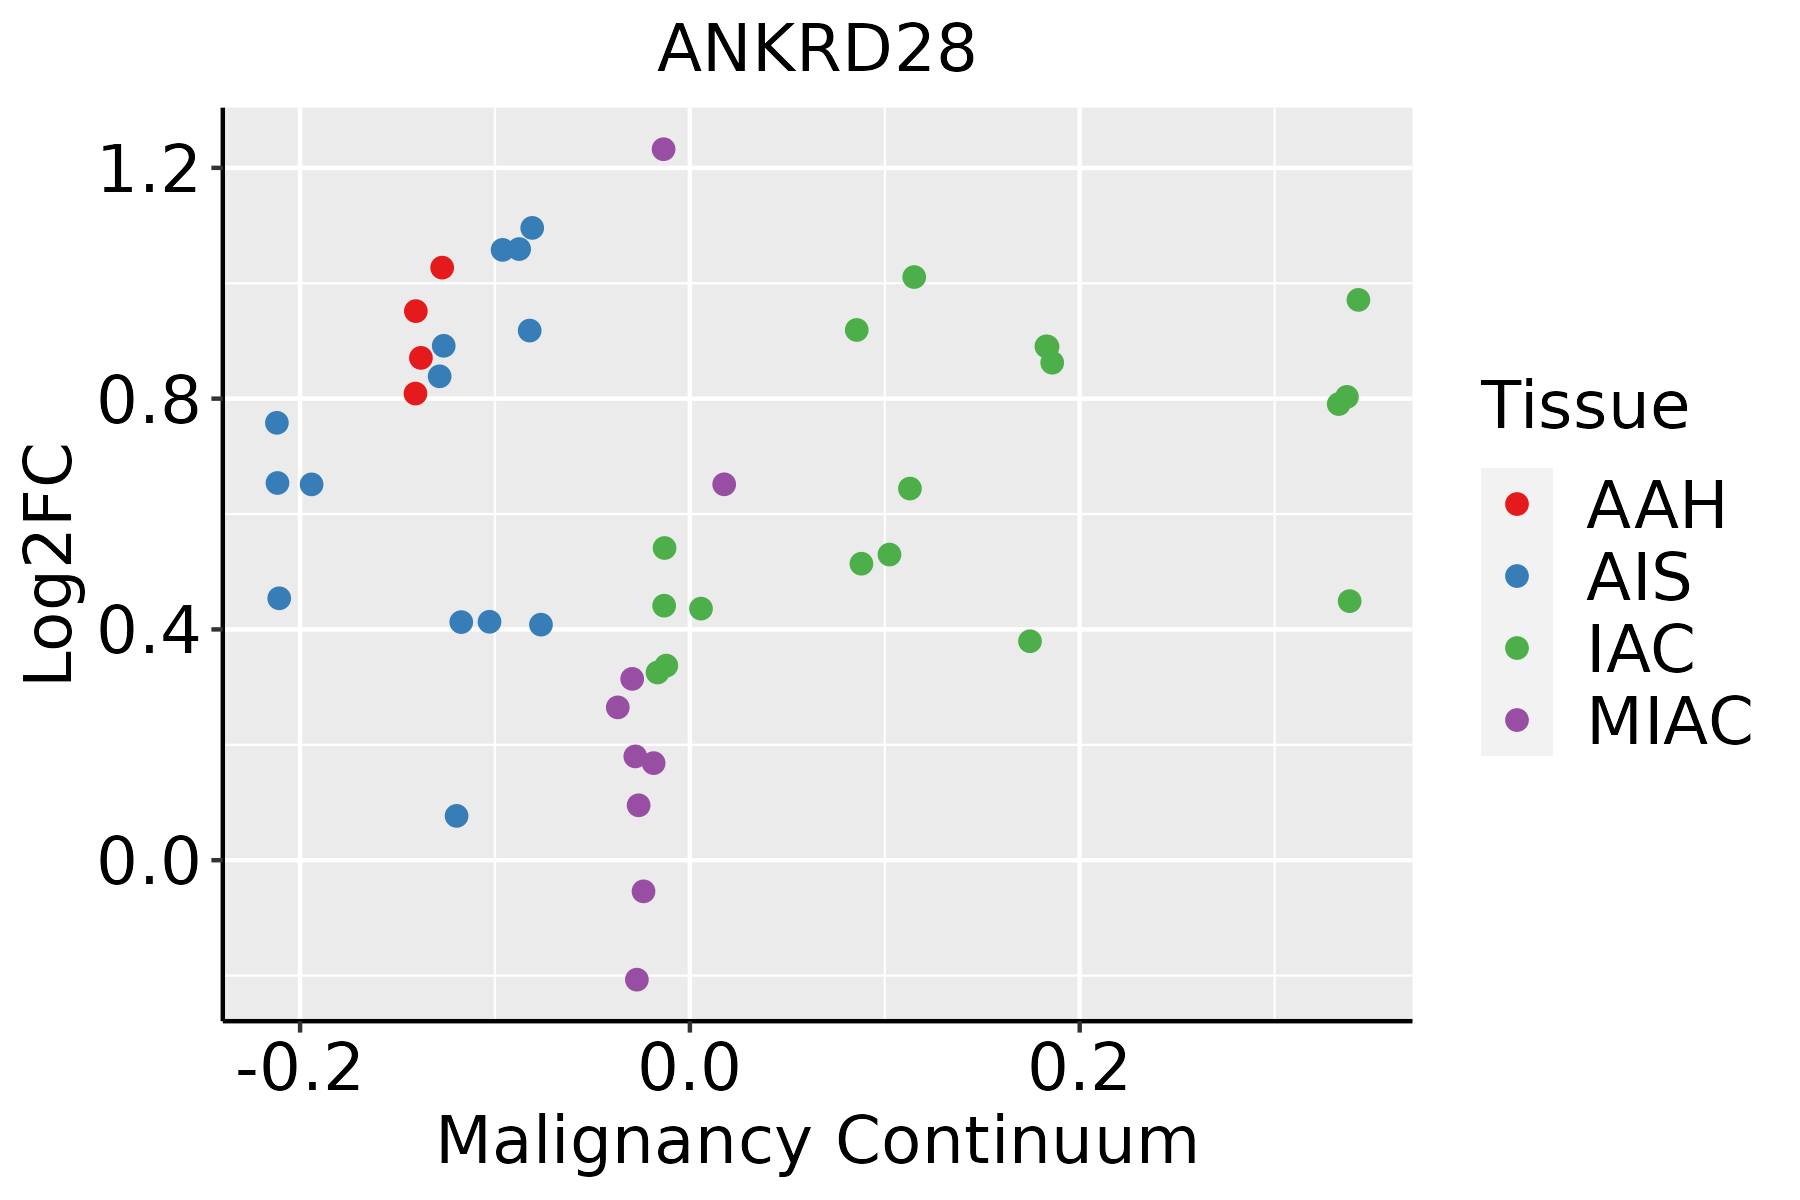 | AAH: Atypical adenomatous hyperplasia |
| AIS: Adenocarcinoma in situ | ||
| IAC: Invasive lung adenocarcinoma | ||
| MIA: Minimally invasive adenocarcinoma | ||
| Prostate | 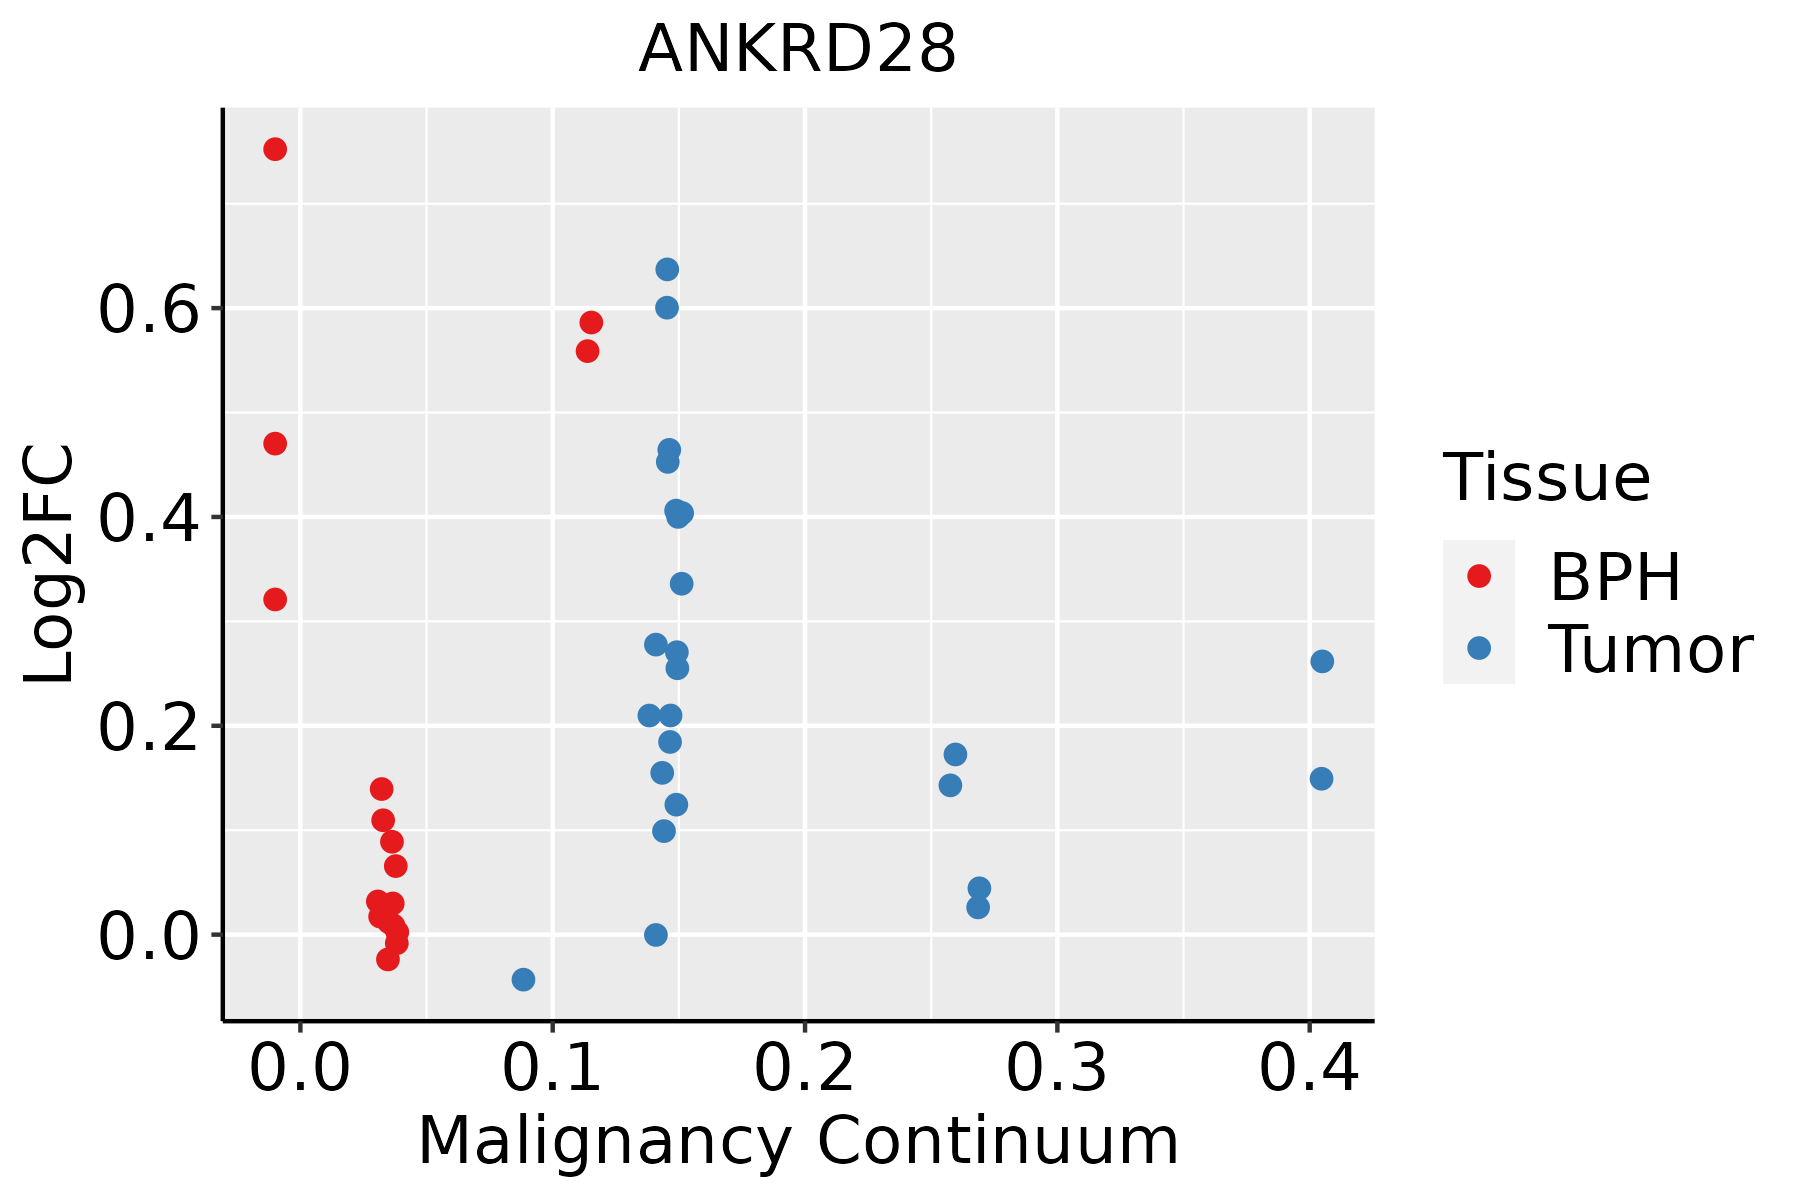 | BPH: Benign Prostatic Hyperplasia |
| Thyroid | 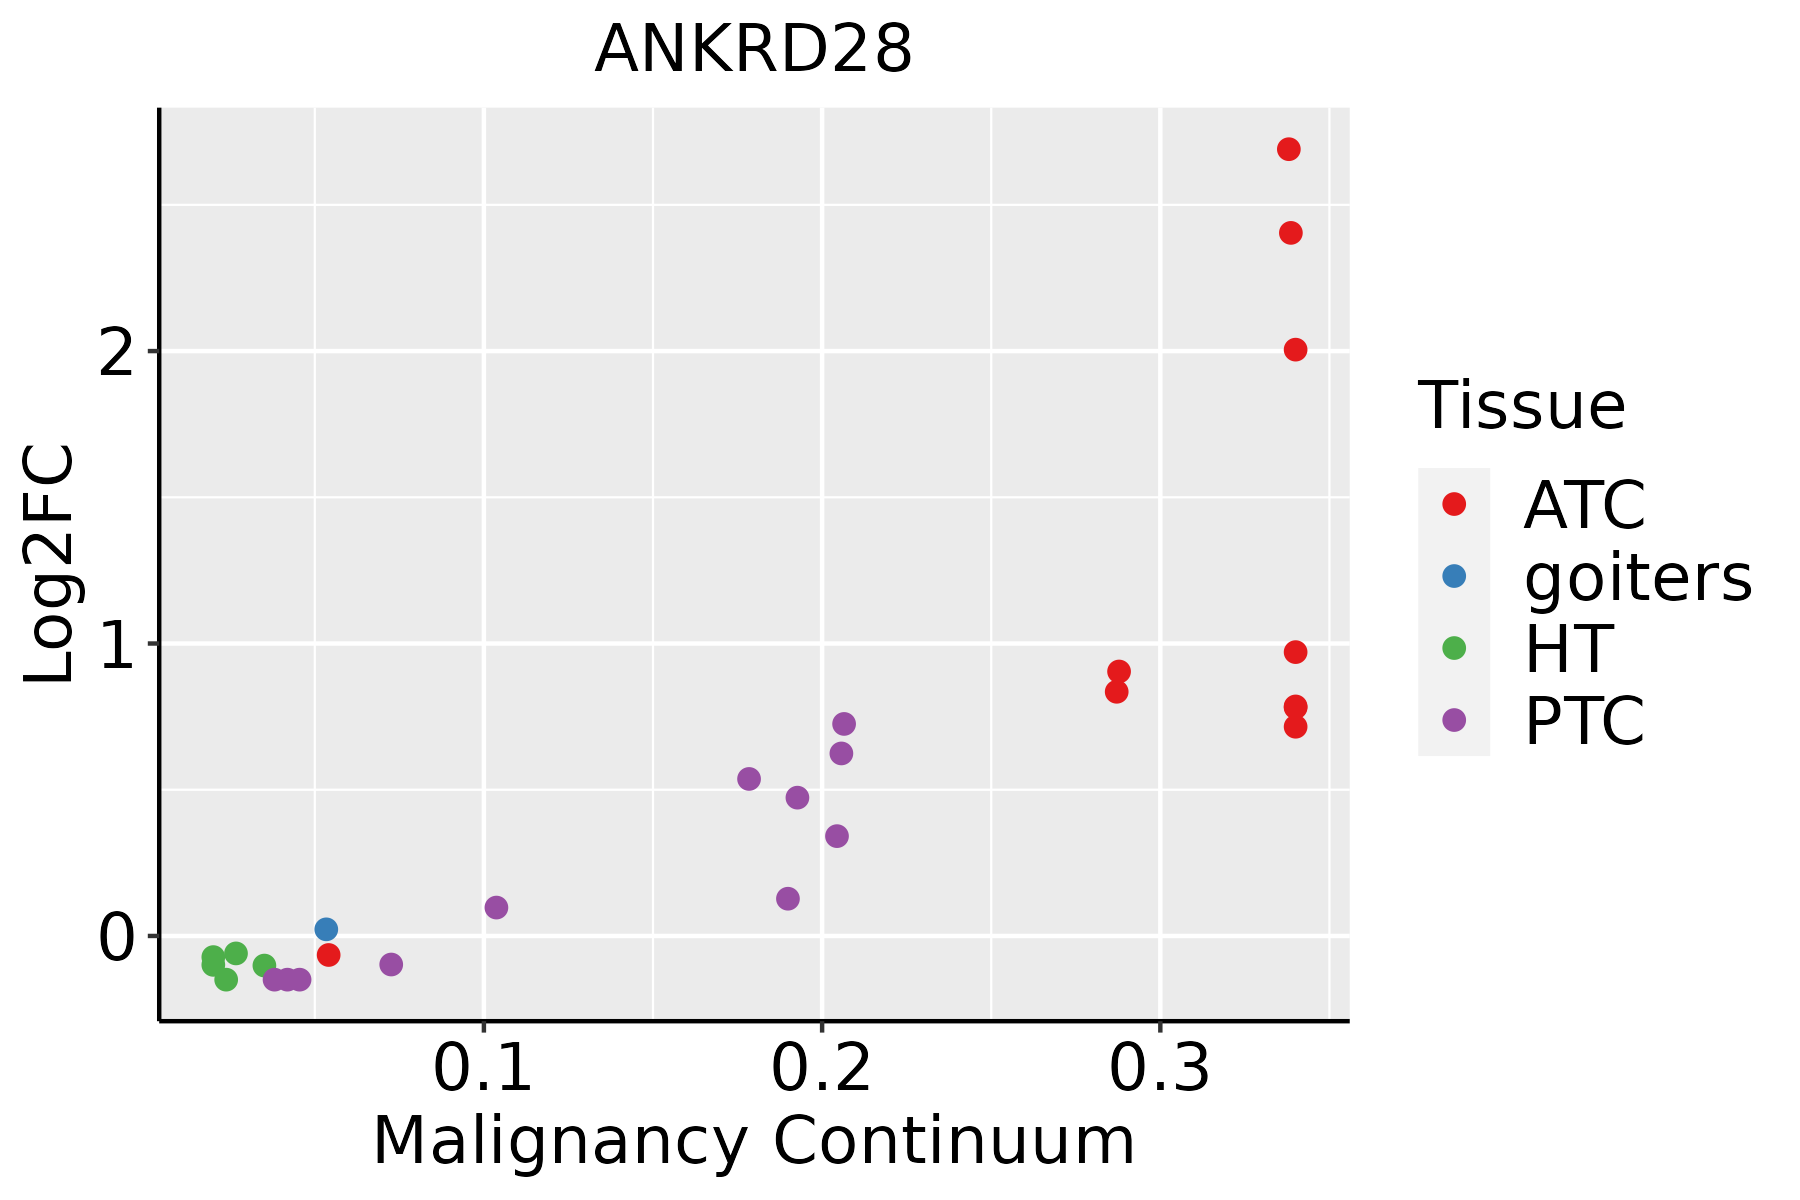 | ATC: Anaplastic thyroid cancer |
| HT: Hashimoto's thyroiditis | ||
| PTC: Papillary thyroid cancer |
| ∗log2FC in expression of this searched gene in stem-like cells from each diseased tissue sample relative to stem-like cells in normal samples in each tissue plotted against the malignancy continuum. Samples are colored based on if they are from different disease stage. |
Top |
Malignant transformation related pathway analysis |
| Find out the enriched GO biological processes and KEGG pathways involved in transition from healthy to precancer to cancer |
| Tissue | Disease Stage | Enriched GO biological Processes |
| Colorectum | AD |  |
| Colorectum | SER |  |
| Colorectum | MSS |  |
| Colorectum | MSI-H |  |
| Colorectum | FAP |  |
| ∗Top 15 enriched GO BP terms are showed in the bar plot of each disease state in each tissue. Each row represents a significant GO biological process which is colored according to the -log10(p.adjust). |
| Page: 1 2 3 4 5 6 7 8 9 |
| GO ID | Tissue | Disease Stage | Description | Gene Ratio | Bg Ratio | pvalue | p.adjust | Count |
| Page: 1 |
| Pathway ID | Tissue | Disease Stage | Description | Gene Ratio | Bg Ratio | pvalue | p.adjust | qvalue | Count |
| Page: 1 |
Top |
Cell-cell communication analysis |
| Identification of potential cell-cell interactions between two cell types and their ligand-receptor pairs for different disease states |
| Ligand | Receptor | LRpair | Pathway | Tissue | Disease Stage |
| Page: 1 |
Top |
Single-cell gene regulatory network inference analysis |
| Find out the significant the regulons (TFs) and the target genes of each regulon across cell types for different disease states |
| TF | Cell Type | Tissue | Disease Stage | Target Gene | RSS | Regulon Activity |
| ∗The dot plots of a searched regulon are shown for all cell subpopulations in each disease state of each tissue based on the regulon specific score inferred using pySCENIC and by calculating the average expression. |
| Page: 1 |
Top |
Somatic mutation of malignant transformation related genes |
| Annotation of somatic variants for genes involved in malignant transformation |
| Hugo Symbol | Variant Class | Variant Classification | dbSNP RS | HGVSc | HGVSp | HGVSp Short | SWISSPROT | BIOTYPE | SIFT | PolyPhen | Tumor Sample Barcode | Tissue | Histology | Sex | Age | Stage | Therapy Types | Drugs | Outcome |
| ANKRD28 | SNV | Missense_Mutation | c.2600N>A | p.Gly867Glu | p.G867E | O15084 | protein_coding | deleterious(0) | probably_damaging(0.998) | TCGA-A2-A0CX-01 | Breast | breast invasive carcinoma | Female | <65 | I/II | Chemotherapy | adriamycin | SD | |
| ANKRD28 | SNV | Missense_Mutation | c.1851G>C | p.Lys617Asn | p.K617N | O15084 | protein_coding | tolerated(0.09) | benign(0.098) | TCGA-A2-A0EQ-01 | Breast | breast invasive carcinoma | Female | <65 | I/II | Chemotherapy | adriamycin | SD | |
| ANKRD28 | SNV | Missense_Mutation | c.1156G>A | p.Asp386Asn | p.D386N | O15084 | protein_coding | tolerated(0.1) | possibly_damaging(0.6) | TCGA-A8-A09D-01 | Breast | breast invasive carcinoma | Female | <65 | I/II | Chemotherapy | doxorubicin | CR | |
| ANKRD28 | SNV | Missense_Mutation | rs750409900 | c.664G>C | p.Val222Leu | p.V222L | O15084 | protein_coding | deleterious(0.04) | benign(0.012) | TCGA-A8-A09M-01 | Breast | breast invasive carcinoma | Female | >=65 | III/IV | Chemotherapy | paclitaxel | CR |
| ANKRD28 | SNV | Missense_Mutation | c.691N>C | p.Asp231His | p.D231H | O15084 | protein_coding | deleterious(0.04) | benign(0.141) | TCGA-AC-A23H-01 | Breast | breast invasive carcinoma | Female | >=65 | I/II | Unknown | Unknown | PD | |
| ANKRD28 | SNV | Missense_Mutation | rs759982054 | c.64N>A | p.Asp22Asn | p.D22N | O15084 | protein_coding | deleterious(0.01) | possibly_damaging(0.821) | TCGA-AC-A23H-01 | Breast | breast invasive carcinoma | Female | >=65 | I/II | Unknown | Unknown | PD |
| ANKRD28 | SNV | Missense_Mutation | novel | c.2929N>C | p.Ala977Pro | p.A977P | O15084 | protein_coding | deleterious(0.01) | probably_damaging(0.99) | TCGA-AR-A0U0-01 | Breast | breast invasive carcinoma | Female | >=65 | I/II | Unknown | Unknown | SD |
| ANKRD28 | SNV | Missense_Mutation | novel | c.1450N>T | p.Asp484Tyr | p.D484Y | O15084 | protein_coding | tolerated(0.34) | benign(0.055) | TCGA-BH-A0B6-01 | Breast | breast invasive carcinoma | Female | <65 | I/II | Unknown | Unknown | SD |
| ANKRD28 | SNV | Missense_Mutation | c.3037G>A | p.Glu1013Lys | p.E1013K | O15084 | protein_coding | tolerated(0.81) | benign(0.005) | TCGA-C8-A26Y-01 | Breast | breast invasive carcinoma | Female | >=65 | I/II | Unknown | Unknown | SD | |
| ANKRD28 | SNV | Missense_Mutation | c.3041N>T | p.Ala1014Val | p.A1014V | O15084 | protein_coding | deleterious(0.02) | benign(0.007) | TCGA-D8-A1XK-01 | Breast | breast invasive carcinoma | Female | <65 | I/II | Chemotherapy | doxorubicine+cyclophosphamide | SD |
| Page: 1 2 3 4 5 6 7 8 9 10 11 |
Top |
Related drugs of malignant transformation related genes |
| Identification of chemicals and drugs interact with genes involved in malignant transfromation |
| (DGIdb 4.0) |
| Entrez ID | Symbol | Category | Interaction Types | Drug Claim Name | Drug Name | PMIDs |
| Page: 1 |

Copyright 2023-Present -The University of Texas Health Science Center at Houston |