
|
|||||
|
 | |
| |
| |
| |
| |
| |
|
Gene: ANKRA2 |
Gene summary for ANKRA2 |
| Gene information | Species | Human | Gene symbol | ANKRA2 | Gene ID | 57763 |
| Gene name | ankyrin repeat family A member 2 | |
| Gene Alias | ANKRA | |
| Cytomap | 5q13.2 | |
| Gene Type | protein-coding | GO ID | GO:0008150 | UniProtAcc | A0A024RAN7 |
Top |
Malignant transformation analysis |
| Identification of the aberrant gene expression in precancerous and cancerous lesions by comparing the gene expression of stem-like cells in diseased tissues with normal stem cells |
| Entrez ID | Symbol | Replicates | Species | Organ | Tissue | Adj P-value | Log2FC | Malignancy |
| 57763 | ANKRA2 | Pt13.b | Human | Liver | HCC | 1.99e-02 | 2.75e-02 | 0.0251 |
| 57763 | ANKRA2 | Pt14.a | Human | Liver | HCC | 7.56e-07 | 3.19e-01 | 0.0169 |
| 57763 | ANKRA2 | Pt14.b | Human | Liver | HCC | 2.45e-02 | 2.14e-01 | 0.018 |
| 57763 | ANKRA2 | S016 | Human | Liver | HCC | 7.63e-04 | 1.39e-01 | 0.2243 |
| 57763 | ANKRA2 | C04 | Human | Oral cavity | OSCC | 2.08e-08 | 4.17e-01 | 0.2633 |
| 57763 | ANKRA2 | C21 | Human | Oral cavity | OSCC | 7.73e-14 | 4.66e-01 | 0.2678 |
| 57763 | ANKRA2 | C30 | Human | Oral cavity | OSCC | 3.48e-13 | 6.87e-01 | 0.3055 |
| 57763 | ANKRA2 | C38 | Human | Oral cavity | OSCC | 7.77e-11 | 9.75e-01 | 0.172 |
| 57763 | ANKRA2 | C43 | Human | Oral cavity | OSCC | 2.58e-13 | 3.68e-01 | 0.1704 |
| 57763 | ANKRA2 | C46 | Human | Oral cavity | OSCC | 3.57e-18 | 4.75e-01 | 0.1673 |
| 57763 | ANKRA2 | C57 | Human | Oral cavity | OSCC | 1.40e-07 | 2.68e-01 | 0.1679 |
| 57763 | ANKRA2 | C08 | Human | Oral cavity | OSCC | 4.13e-11 | 3.23e-01 | 0.1919 |
| 57763 | ANKRA2 | C09 | Human | Oral cavity | OSCC | 1.29e-04 | 2.00e-01 | 0.1431 |
| 57763 | ANKRA2 | LN46 | Human | Oral cavity | OSCC | 7.16e-09 | 4.44e-01 | 0.1666 |
| 57763 | ANKRA2 | LP15 | Human | Oral cavity | LP | 1.04e-03 | 7.82e-01 | 0.2174 |
| 57763 | ANKRA2 | LP17 | Human | Oral cavity | LP | 8.78e-04 | 5.11e-01 | 0.2349 |
| 57763 | ANKRA2 | SYSMH1 | Human | Oral cavity | OSCC | 1.35e-04 | 8.44e-02 | 0.1127 |
| 57763 | ANKRA2 | SYSMH2 | Human | Oral cavity | OSCC | 4.77e-15 | 2.95e-01 | 0.2326 |
| 57763 | ANKRA2 | SYSMH3 | Human | Oral cavity | OSCC | 1.23e-02 | 1.36e-01 | 0.2442 |
| 57763 | ANKRA2 | SYSMH4 | Human | Oral cavity | OSCC | 4.58e-03 | 1.09e-01 | 0.1226 |
| Page: 1 2 3 4 5 |
| Tissue | Expression Dynamics | Abbreviation |
| Esophagus | 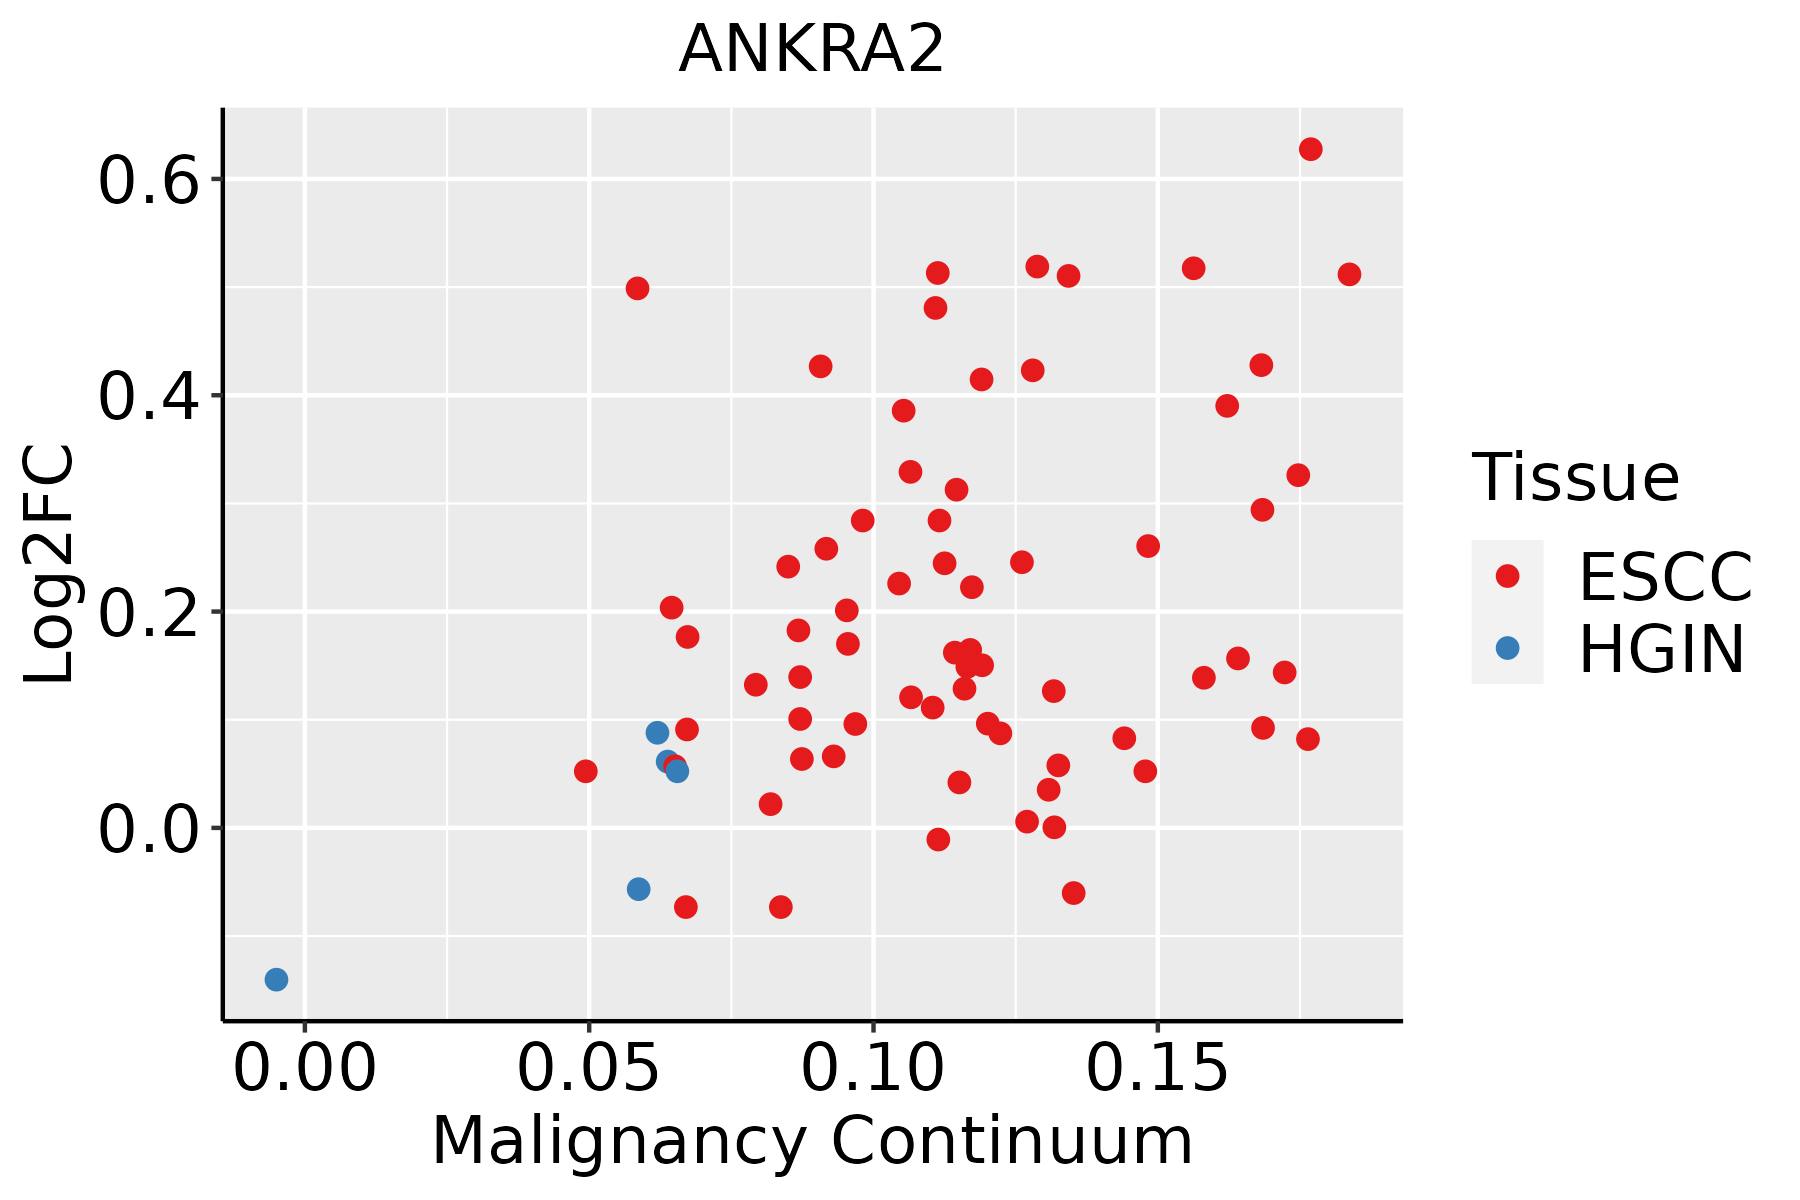 | ESCC: Esophageal squamous cell carcinoma |
| HGIN: High-grade intraepithelial neoplasias | ||
| LGIN: Low-grade intraepithelial neoplasias | ||
| Liver |  | HCC: Hepatocellular carcinoma |
| NAFLD: Non-alcoholic fatty liver disease | ||
| Oral Cavity |  | EOLP: Erosive Oral lichen planus |
| LP: leukoplakia | ||
| NEOLP: Non-erosive oral lichen planus | ||
| OSCC: Oral squamous cell carcinoma | ||
| Thyroid | 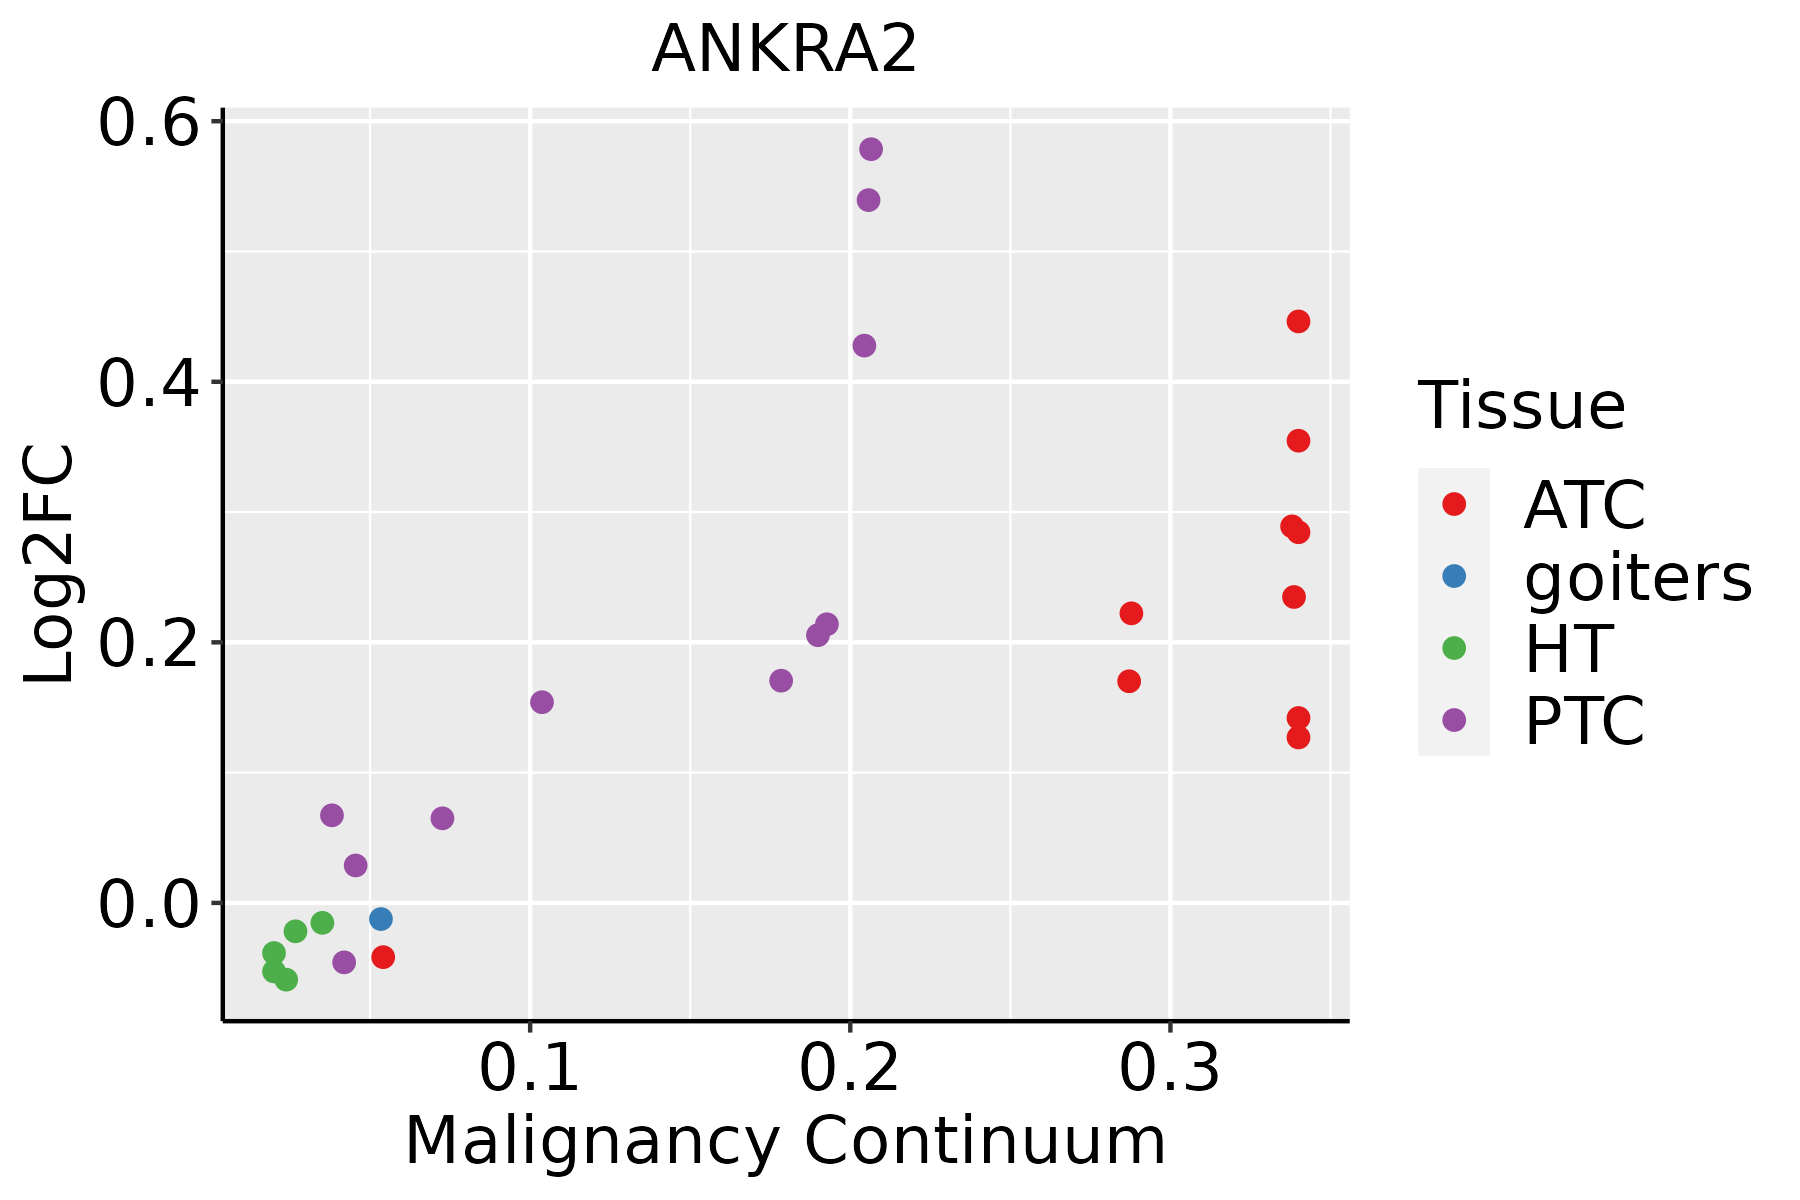 | ATC: Anaplastic thyroid cancer |
| HT: Hashimoto's thyroiditis | ||
| PTC: Papillary thyroid cancer |
| ∗log2FC in expression of this searched gene in stem-like cells from each diseased tissue sample relative to stem-like cells in normal samples in each tissue plotted against the malignancy continuum. Samples are colored based on if they are from different disease stage. |
Top |
Malignant transformation related pathway analysis |
| Find out the enriched GO biological processes and KEGG pathways involved in transition from healthy to precancer to cancer |
| Tissue | Disease Stage | Enriched GO biological Processes |
| Colorectum | AD |  |
| Colorectum | SER |  |
| Colorectum | MSS |  |
| Colorectum | MSI-H |  |
| Colorectum | FAP |  |
| ∗Top 15 enriched GO BP terms are showed in the bar plot of each disease state in each tissue. Each row represents a significant GO biological process which is colored according to the -log10(p.adjust). |
| Page: 1 2 3 4 5 6 7 8 9 |
| GO ID | Tissue | Disease Stage | Description | Gene Ratio | Bg Ratio | pvalue | p.adjust | Count |
| GO:0043254111 | Esophagus | ESCC | regulation of protein-containing complex assembly | 278/8552 | 428/18723 | 3.81e-16 | 2.77e-14 | 278 |
| GO:004325412 | Liver | Cirrhotic | regulation of protein-containing complex assembly | 169/4634 | 428/18723 | 7.40e-12 | 4.99e-10 | 169 |
| GO:004325422 | Liver | HCC | regulation of protein-containing complex assembly | 264/7958 | 428/18723 | 5.47e-16 | 4.39e-14 | 264 |
| GO:004325420 | Oral cavity | OSCC | regulation of protein-containing complex assembly | 255/7305 | 428/18723 | 2.94e-18 | 3.15e-16 | 255 |
| GO:0043254110 | Oral cavity | LP | regulation of protein-containing complex assembly | 163/4623 | 428/18723 | 3.72e-10 | 1.92e-08 | 163 |
| GO:0043254113 | Thyroid | PTC | regulation of protein-containing complex assembly | 215/5968 | 428/18723 | 1.23e-15 | 9.09e-14 | 215 |
| GO:0043254210 | Thyroid | ATC | regulation of protein-containing complex assembly | 225/6293 | 428/18723 | 2.72e-16 | 2.33e-14 | 225 |
| Page: 1 |
| Pathway ID | Tissue | Disease Stage | Description | Gene Ratio | Bg Ratio | pvalue | p.adjust | qvalue | Count |
| Page: 1 |
Top |
Cell-cell communication analysis |
| Identification of potential cell-cell interactions between two cell types and their ligand-receptor pairs for different disease states |
| Ligand | Receptor | LRpair | Pathway | Tissue | Disease Stage |
| Page: 1 |
Top |
Single-cell gene regulatory network inference analysis |
| Find out the significant the regulons (TFs) and the target genes of each regulon across cell types for different disease states |
| TF | Cell Type | Tissue | Disease Stage | Target Gene | RSS | Regulon Activity |
| ∗The dot plots of a searched regulon are shown for all cell subpopulations in each disease state of each tissue based on the regulon specific score inferred using pySCENIC and by calculating the average expression. |
| Page: 1 |
Top |
Somatic mutation of malignant transformation related genes |
| Annotation of somatic variants for genes involved in malignant transformation |
| Hugo Symbol | Variant Class | Variant Classification | dbSNP RS | HGVSc | HGVSp | HGVSp Short | SWISSPROT | BIOTYPE | SIFT | PolyPhen | Tumor Sample Barcode | Tissue | Histology | Sex | Age | Stage | Therapy Types | Drugs | Outcome |
| ANKRA2 | SNV | Missense_Mutation | c.103N>T | p.Pro35Ser | p.P35S | Q9H9E1 | protein_coding | tolerated_low_confidence(0.32) | benign(0) | TCGA-D8-A1JF-01 | Breast | breast invasive carcinoma | Female | >=65 | III/IV | Unknown | Unknown | SD | |
| ANKRA2 | SNV | Missense_Mutation | rs749997797 | c.659C>T | p.Ser220Leu | p.S220L | Q9H9E1 | protein_coding | tolerated(1) | benign(0.279) | TCGA-5M-AATE-01 | Colorectum | colon adenocarcinoma | Male | >=65 | I/II | Unknown | Unknown | PD |
| ANKRA2 | SNV | Missense_Mutation | novel | c.203N>G | p.Phe68Cys | p.F68C | Q9H9E1 | protein_coding | deleterious_low_confidence(0) | probably_damaging(0.971) | TCGA-AA-3984-01 | Colorectum | colon adenocarcinoma | Female | <65 | I/II | Unknown | Unknown | SD |
| ANKRA2 | SNV | Missense_Mutation | rs200934847 | c.176G>A | p.Arg59Gln | p.R59Q | Q9H9E1 | protein_coding | deleterious_low_confidence(0) | possibly_damaging(0.885) | TCGA-AG-A002-01 | Colorectum | rectum adenocarcinoma | Male | <65 | I/II | Unknown | Unknown | SD |
| ANKRA2 | SNV | Missense_Mutation | rs778296728 | c.503N>A | p.Arg168His | p.R168H | Q9H9E1 | protein_coding | tolerated(0.3) | benign(0.09) | TCGA-A5-A0G2-01 | Endometrium | uterine corpus endometrioid carcinoma | Female | <65 | III/IV | Unknown | Unknown | SD |
| ANKRA2 | SNV | Missense_Mutation | novel | c.410N>T | p.Arg137Ile | p.R137I | Q9H9E1 | protein_coding | deleterious(0) | probably_damaging(0.944) | TCGA-AP-A1DV-01 | Endometrium | uterine corpus endometrioid carcinoma | Female | <65 | I/II | Unknown | Unknown | SD |
| ANKRA2 | SNV | Missense_Mutation | novel | c.323G>A | p.Gly108Glu | p.G108E | Q9H9E1 | protein_coding | tolerated(0.06) | probably_damaging(0.994) | TCGA-AX-A3FX-01 | Endometrium | uterine corpus endometrioid carcinoma | Female | >=65 | I/II | Chemotherapy | carboplatin | PD |
| ANKRA2 | SNV | Missense_Mutation | novel | c.604N>A | p.Leu202Ile | p.L202I | Q9H9E1 | protein_coding | tolerated(0.1) | probably_damaging(0.979) | TCGA-B5-A1MR-01 | Endometrium | uterine corpus endometrioid carcinoma | Female | >=65 | III/IV | Unknown | Unknown | SD |
| ANKRA2 | SNV | Missense_Mutation | novel | c.626N>C | p.Gln209Pro | p.Q209P | Q9H9E1 | protein_coding | tolerated(0.11) | possibly_damaging(0.447) | TCGA-BG-A0VW-01 | Endometrium | uterine corpus endometrioid carcinoma | Female | >=65 | I/II | Unknown | Unknown | SD |
| ANKRA2 | SNV | Missense_Mutation | c.74C>T | p.Thr25Ile | p.T25I | Q9H9E1 | protein_coding | tolerated_low_confidence(0.05) | benign(0.003) | TCGA-BS-A0UF-01 | Endometrium | uterine corpus endometrioid carcinoma | Female | >=65 | I/II | Unknown | Unknown | SD |
| Page: 1 2 |
Top |
Related drugs of malignant transformation related genes |
| Identification of chemicals and drugs interact with genes involved in malignant transfromation |
| (DGIdb 4.0) |
| Entrez ID | Symbol | Category | Interaction Types | Drug Claim Name | Drug Name | PMIDs |
| Page: 1 |

Copyright 2023-Present -The University of Texas Health Science Center at Houston |