
|
|||||
|
 | |
| |
| |
| |
| |
| |
|
Gene: ALG1 |
Gene summary for ALG1 |
| Gene information | Species | Human | Gene symbol | ALG1 | Gene ID | 56052 |
| Gene name | ALG1 chitobiosyldiphosphodolichol beta-mannosyltransferase | |
| Gene Alias | CDG1K | |
| Cytomap | 16p13.3 | |
| Gene Type | protein-coding | GO ID | GO:0006464 | UniProtAcc | Q9BT22 |
Top |
Malignant transformation analysis |
| Identification of the aberrant gene expression in precancerous and cancerous lesions by comparing the gene expression of stem-like cells in diseased tissues with normal stem cells |
| Entrez ID | Symbol | Replicates | Species | Organ | Tissue | Adj P-value | Log2FC | Malignancy |
| 56052 | ALG1 | P130T-E | Human | Esophagus | ESCC | 9.82e-21 | 2.87e-01 | 0.1676 |
| 56052 | ALG1 | HCC1_Meng | Human | Liver | HCC | 9.27e-39 | 6.89e-02 | 0.0246 |
| 56052 | ALG1 | HCC2_Meng | Human | Liver | HCC | 4.45e-12 | 4.62e-02 | 0.0107 |
| 56052 | ALG1 | HCC1 | Human | Liver | HCC | 9.02e-16 | 2.52e+00 | 0.5336 |
| 56052 | ALG1 | HCC2 | Human | Liver | HCC | 3.42e-24 | 2.33e+00 | 0.5341 |
| 56052 | ALG1 | HCC5 | Human | Liver | HCC | 2.58e-24 | 2.37e+00 | 0.4932 |
| 56052 | ALG1 | Pt13.b | Human | Liver | HCC | 1.19e-02 | 4.98e-02 | 0.0251 |
| 56052 | ALG1 | S014 | Human | Liver | HCC | 1.28e-26 | 8.08e-01 | 0.2254 |
| 56052 | ALG1 | S015 | Human | Liver | HCC | 2.41e-18 | 8.41e-01 | 0.2375 |
| 56052 | ALG1 | S016 | Human | Liver | HCC | 7.87e-28 | 9.22e-01 | 0.2243 |
| 56052 | ALG1 | S027 | Human | Liver | HCC | 1.75e-06 | 4.72e-01 | 0.2446 |
| 56052 | ALG1 | S028 | Human | Liver | HCC | 1.65e-17 | 6.44e-01 | 0.2503 |
| 56052 | ALG1 | S029 | Human | Liver | HCC | 1.18e-16 | 5.90e-01 | 0.2581 |
| 56052 | ALG1 | C04 | Human | Oral cavity | OSCC | 5.70e-13 | 6.89e-01 | 0.2633 |
| 56052 | ALG1 | C21 | Human | Oral cavity | OSCC | 5.66e-28 | 8.45e-01 | 0.2678 |
| 56052 | ALG1 | C30 | Human | Oral cavity | OSCC | 1.52e-19 | 7.54e-01 | 0.3055 |
| 56052 | ALG1 | C38 | Human | Oral cavity | OSCC | 5.59e-04 | 4.45e-01 | 0.172 |
| 56052 | ALG1 | C46 | Human | Oral cavity | OSCC | 4.25e-02 | 1.34e-01 | 0.1673 |
| 56052 | ALG1 | C51 | Human | Oral cavity | OSCC | 4.62e-05 | 4.84e-01 | 0.2674 |
| 56052 | ALG1 | C06 | Human | Oral cavity | OSCC | 9.51e-06 | 9.81e-01 | 0.2699 |
| Page: 1 2 3 4 5 |
| Tissue | Expression Dynamics | Abbreviation |
| Esophagus | 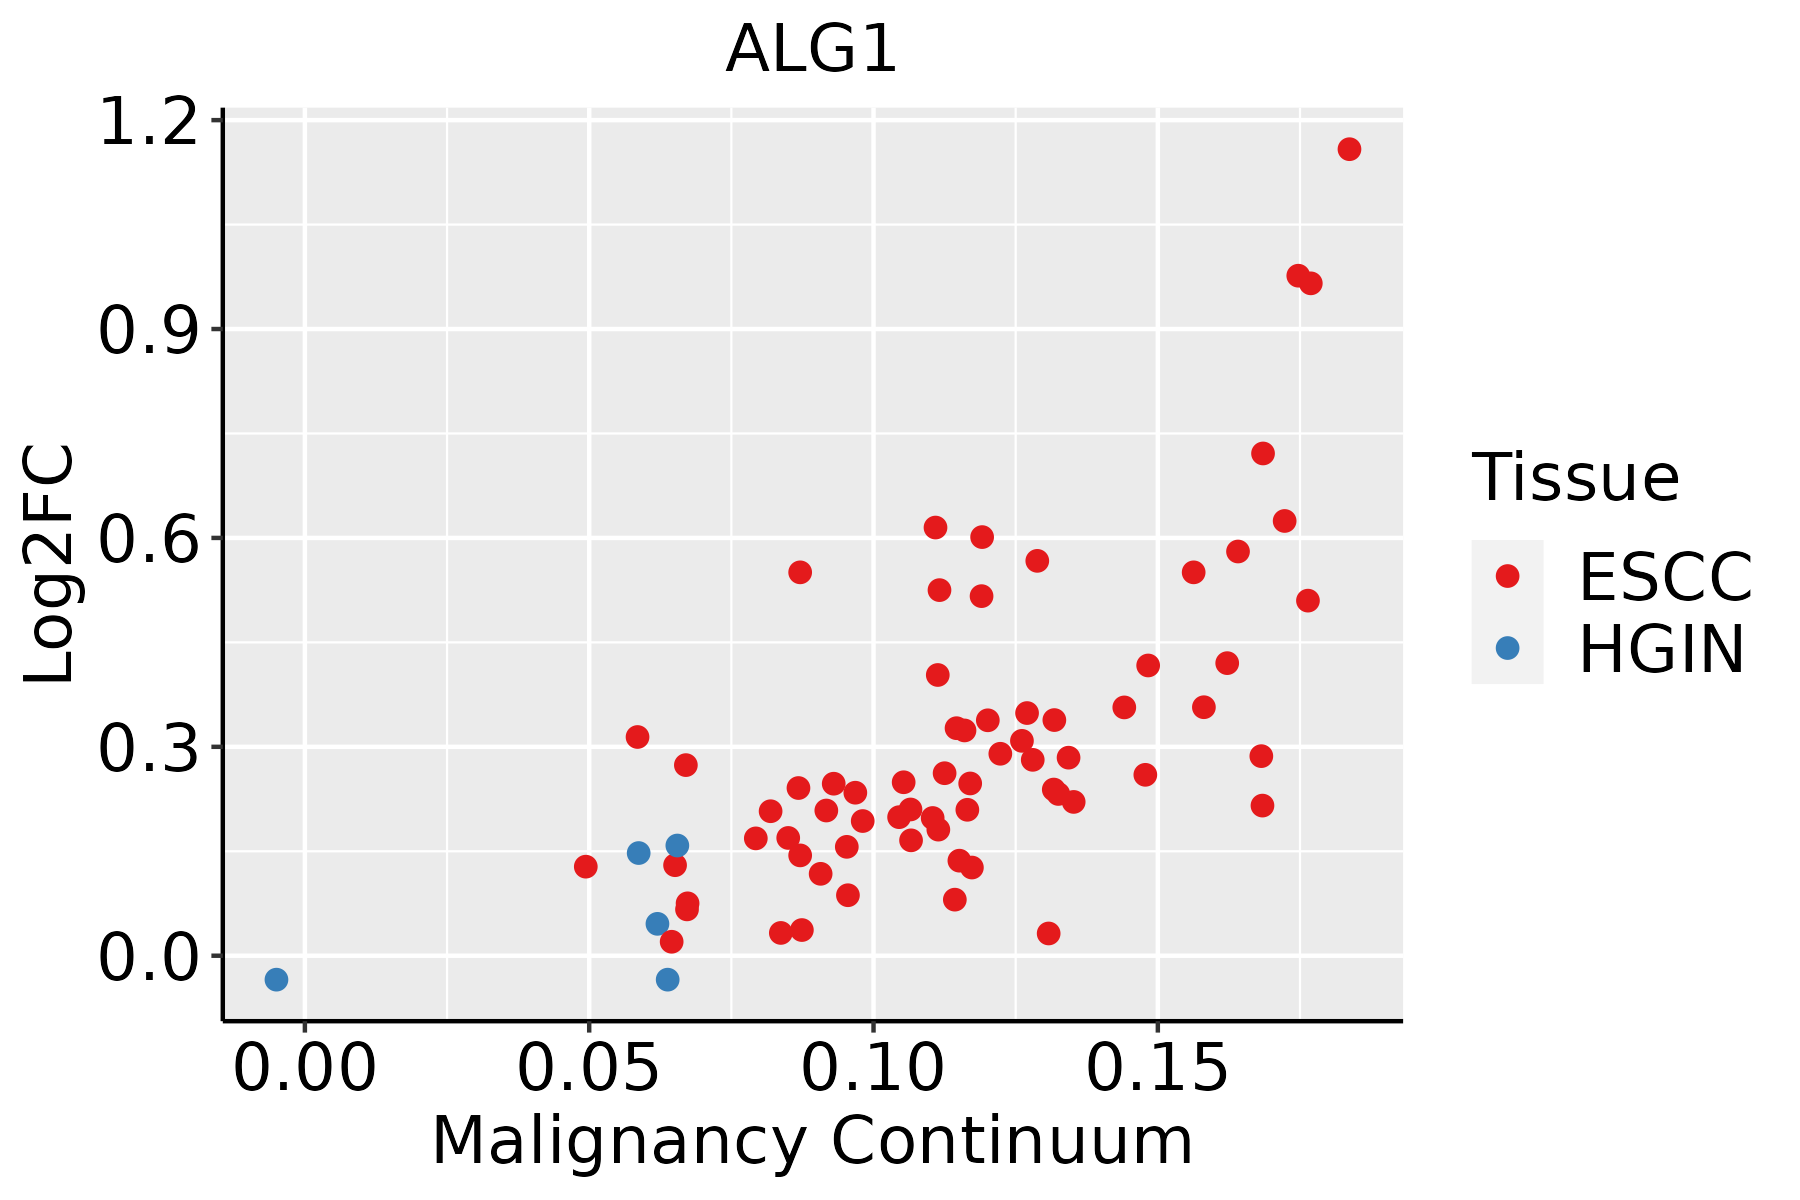 | ESCC: Esophageal squamous cell carcinoma |
| HGIN: High-grade intraepithelial neoplasias | ||
| LGIN: Low-grade intraepithelial neoplasias | ||
| Liver |  | HCC: Hepatocellular carcinoma |
| NAFLD: Non-alcoholic fatty liver disease | ||
| Oral Cavity | 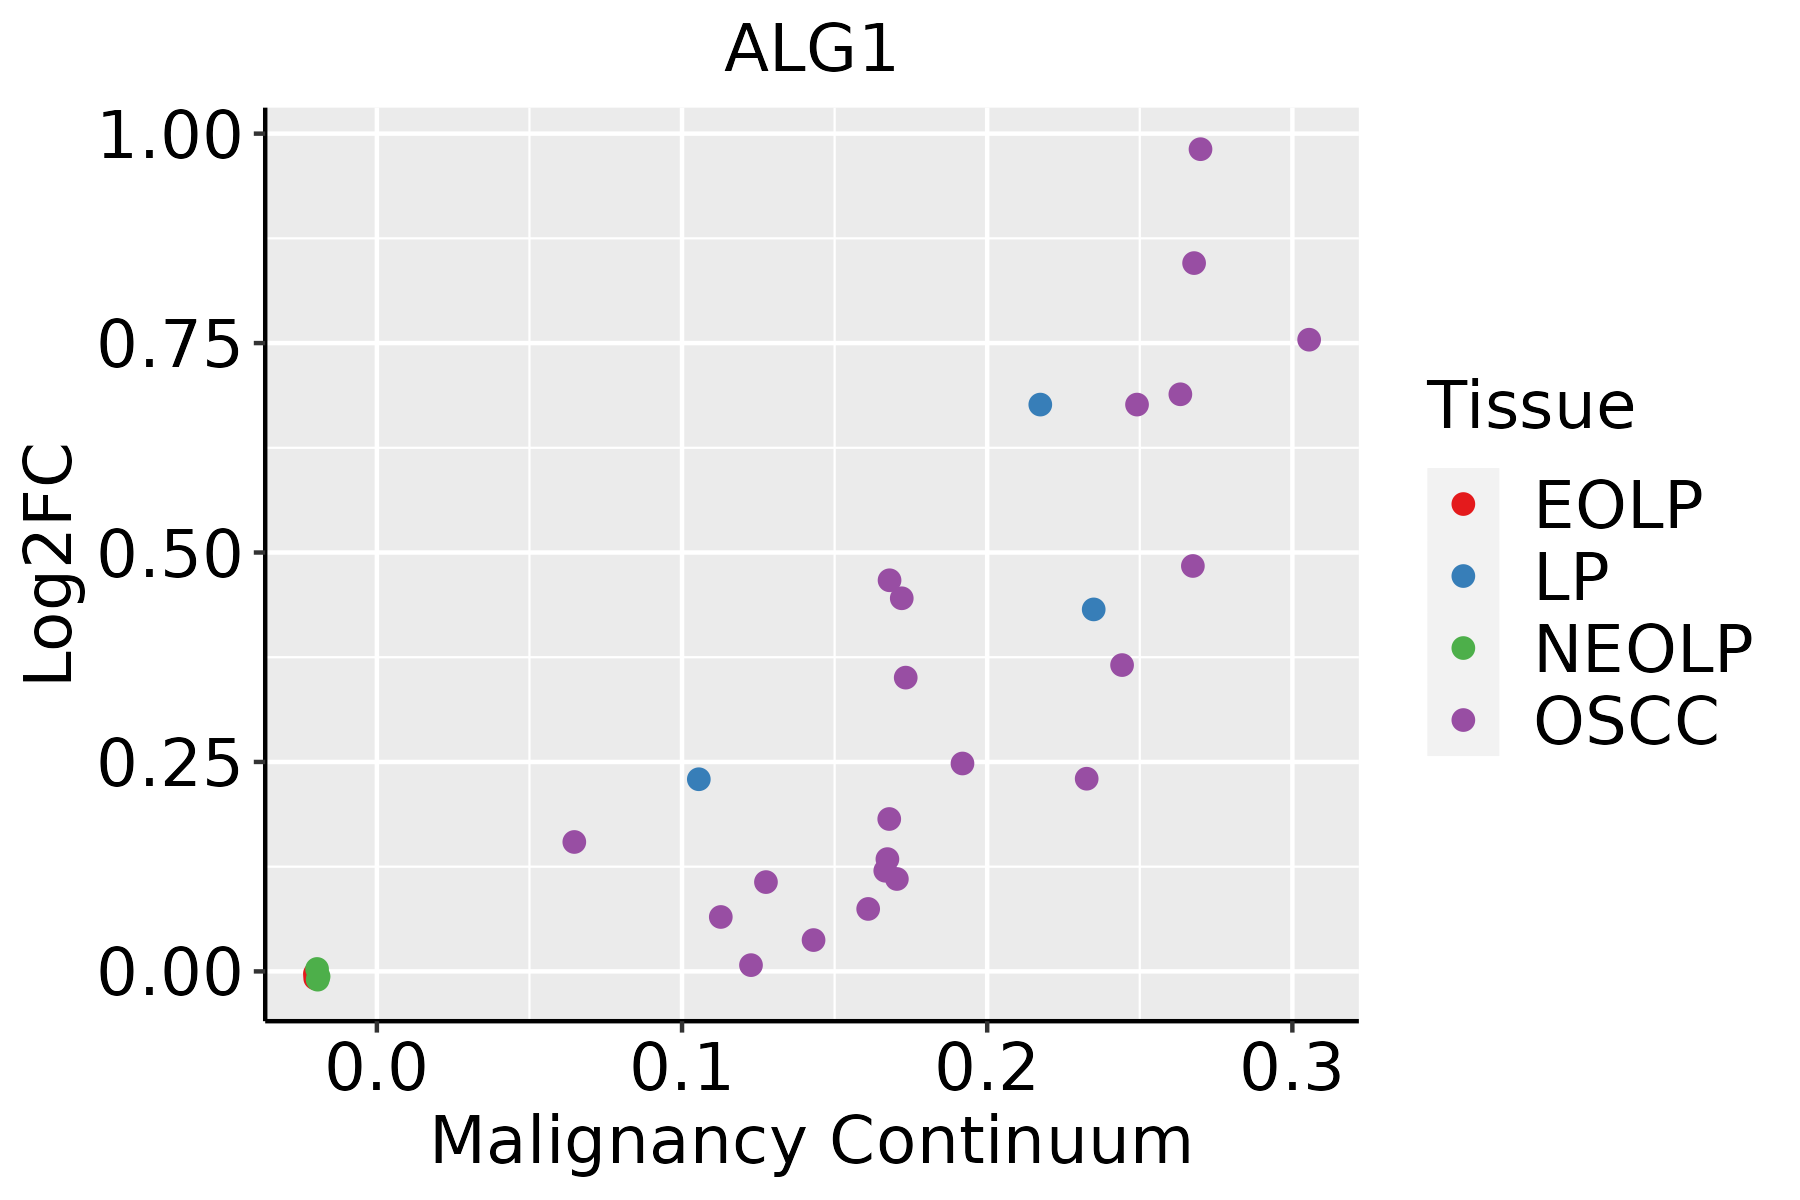 | EOLP: Erosive Oral lichen planus |
| LP: leukoplakia | ||
| NEOLP: Non-erosive oral lichen planus | ||
| OSCC: Oral squamous cell carcinoma | ||
| Skin | 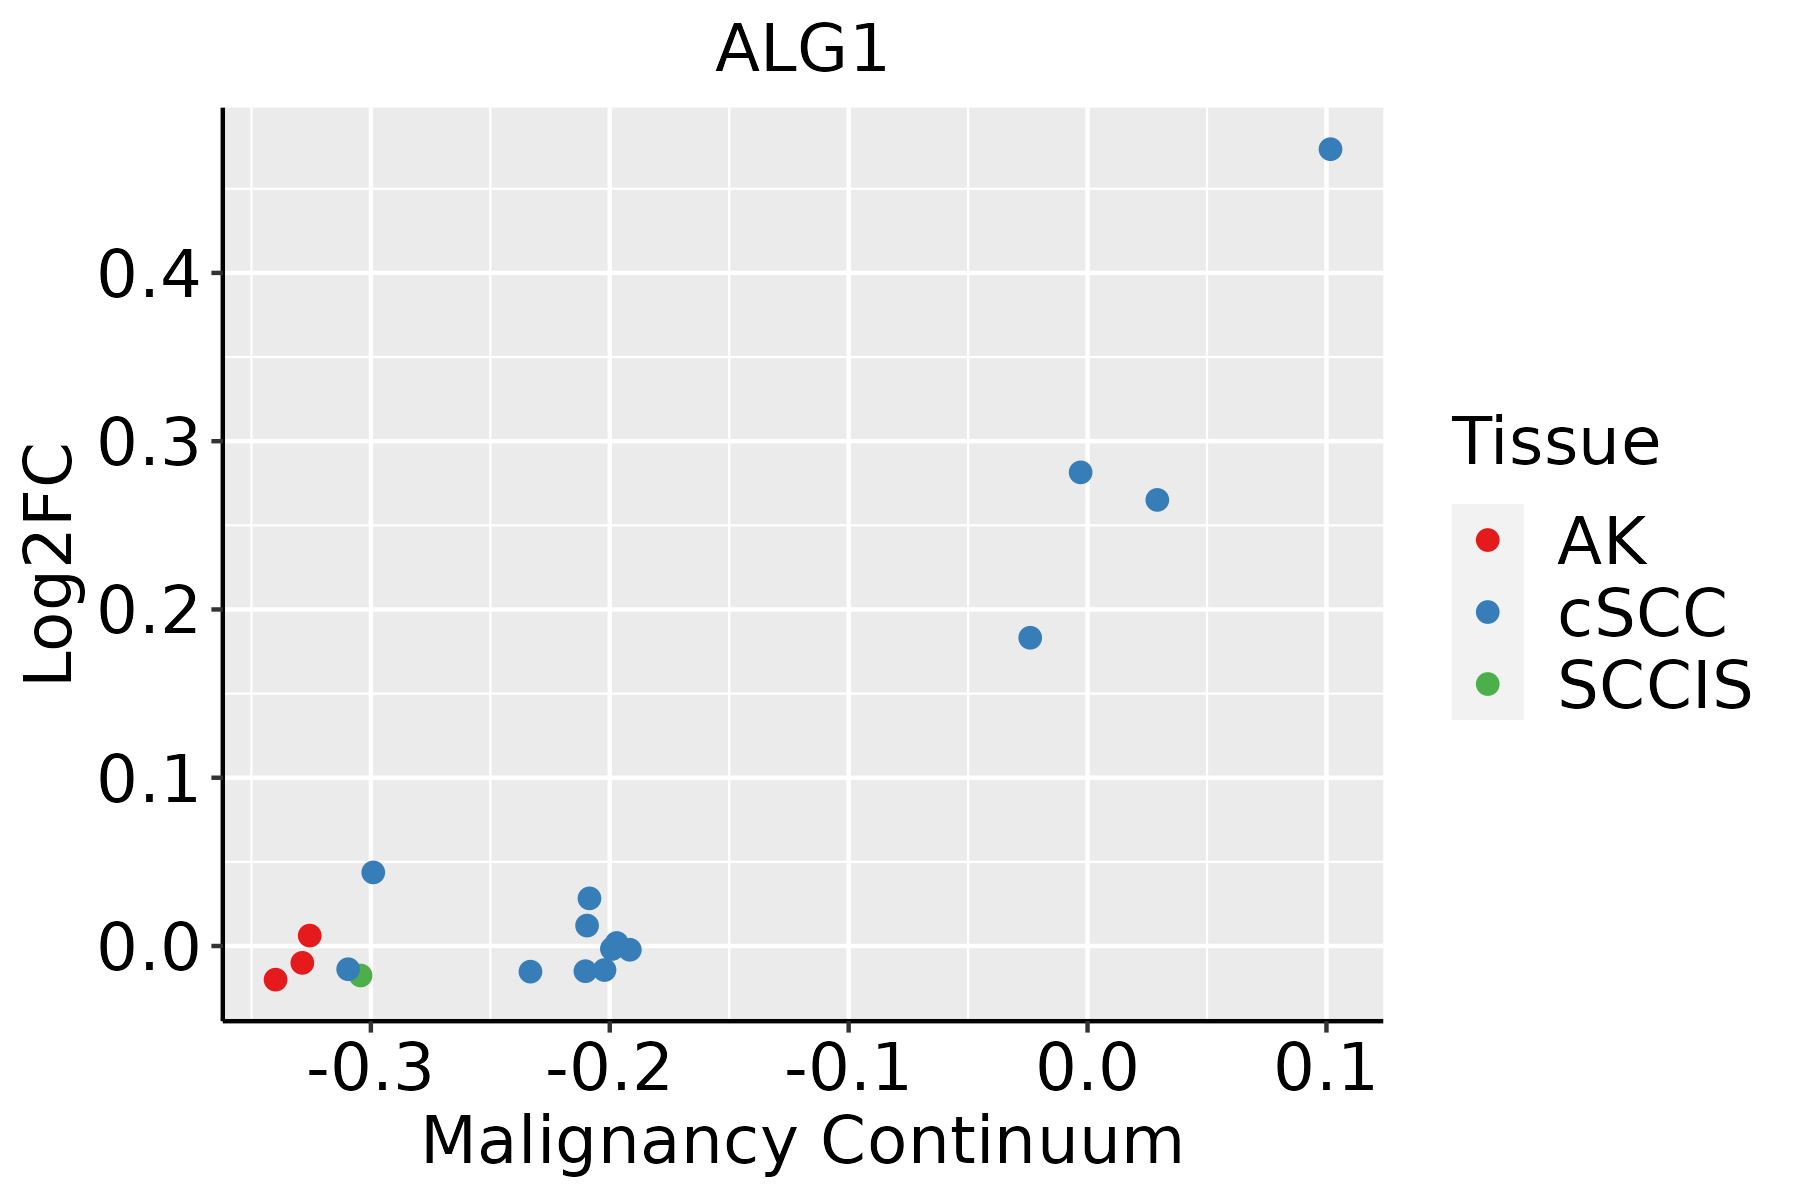 | AK: Actinic keratosis |
| cSCC: Cutaneous squamous cell carcinoma | ||
| SCCIS:squamous cell carcinoma in situ |
| ∗log2FC in expression of this searched gene in stem-like cells from each diseased tissue sample relative to stem-like cells in normal samples in each tissue plotted against the malignancy continuum. Samples are colored based on if they are from different disease stage. |
Top |
Malignant transformation related pathway analysis |
| Find out the enriched GO biological processes and KEGG pathways involved in transition from healthy to precancer to cancer |
| Tissue | Disease Stage | Enriched GO biological Processes |
| Colorectum | AD |  |
| Colorectum | SER |  |
| Colorectum | MSS |  |
| Colorectum | MSI-H |  |
| Colorectum | FAP |  |
| ∗Top 15 enriched GO BP terms are showed in the bar plot of each disease state in each tissue. Each row represents a significant GO biological process which is colored according to the -log10(p.adjust). |
| Page: 1 2 3 4 5 6 7 8 9 |
| GO ID | Tissue | Disease Stage | Description | Gene Ratio | Bg Ratio | pvalue | p.adjust | Count |
| GO:00064876 | Esophagus | HGIN | protein N-linked glycosylation | 17/2587 | 65/18723 | 6.04e-03 | 4.87e-02 | 17 |
| GO:0006457110 | Esophagus | ESCC | protein folding | 163/8552 | 212/18723 | 1.13e-20 | 1.74e-18 | 163 |
| GO:000648714 | Esophagus | ESCC | protein N-linked glycosylation | 51/8552 | 65/18723 | 6.41e-08 | 1.13e-06 | 51 |
| GO:00091002 | Esophagus | ESCC | glycoprotein metabolic process | 226/8552 | 387/18723 | 2.64e-07 | 3.94e-06 | 226 |
| GO:00700854 | Esophagus | ESCC | glycosylation | 144/8552 | 240/18723 | 5.12e-06 | 5.38e-05 | 144 |
| GO:00064865 | Esophagus | ESCC | protein glycosylation | 135/8552 | 226/18723 | 1.36e-05 | 1.24e-04 | 135 |
| GO:00434135 | Esophagus | ESCC | macromolecule glycosylation | 135/8552 | 226/18723 | 1.36e-05 | 1.24e-04 | 135 |
| GO:00091012 | Esophagus | ESCC | glycoprotein biosynthetic process | 181/8552 | 317/18723 | 2.54e-05 | 2.15e-04 | 181 |
| GO:00064882 | Esophagus | ESCC | dolichol-linked oligosaccharide biosynthetic process | 14/8552 | 18/18723 | 5.77e-03 | 2.14e-02 | 14 |
| GO:00064902 | Esophagus | ESCC | oligosaccharide-lipid intermediate biosynthetic process | 14/8552 | 19/18723 | 1.27e-02 | 4.21e-02 | 14 |
| GO:00064577 | Liver | Cirrhotic | protein folding | 114/4634 | 212/18723 | 9.23e-20 | 2.31e-17 | 114 |
| GO:00064873 | Liver | Cirrhotic | protein N-linked glycosylation | 30/4634 | 65/18723 | 1.40e-04 | 1.36e-03 | 30 |
| GO:000645712 | Liver | HCC | protein folding | 160/7958 | 212/18723 | 1.07e-22 | 1.88e-20 | 160 |
| GO:000648711 | Liver | HCC | protein N-linked glycosylation | 48/7958 | 65/18723 | 2.85e-07 | 5.00e-06 | 48 |
| GO:00064862 | Liver | HCC | protein glycosylation | 122/7958 | 226/18723 | 3.11e-04 | 2.21e-03 | 122 |
| GO:00434132 | Liver | HCC | macromolecule glycosylation | 122/7958 | 226/18723 | 3.11e-04 | 2.21e-03 | 122 |
| GO:00700852 | Liver | HCC | glycosylation | 128/7958 | 240/18723 | 4.35e-04 | 2.92e-03 | 128 |
| GO:0009100 | Liver | HCC | glycoprotein metabolic process | 193/7958 | 387/18723 | 1.89e-03 | 9.62e-03 | 193 |
| GO:000645718 | Oral cavity | OSCC | protein folding | 154/7305 | 212/18723 | 1.89e-23 | 4.60e-21 | 154 |
| GO:00064875 | Oral cavity | OSCC | protein N-linked glycosylation | 44/7305 | 65/18723 | 2.63e-06 | 3.26e-05 | 44 |
| Page: 1 2 |
| Pathway ID | Tissue | Disease Stage | Description | Gene Ratio | Bg Ratio | pvalue | p.adjust | qvalue | Count |
| hsa005106 | Esophagus | HGIN | N-Glycan biosynthesis | 17/1383 | 53/8465 | 3.43e-03 | 2.54e-02 | 2.02e-02 | 17 |
| hsa0051013 | Esophagus | HGIN | N-Glycan biosynthesis | 17/1383 | 53/8465 | 3.43e-03 | 2.54e-02 | 2.02e-02 | 17 |
| hsa0051023 | Esophagus | ESCC | N-Glycan biosynthesis | 39/4205 | 53/8465 | 3.26e-04 | 1.15e-03 | 5.89e-04 | 39 |
| hsa005136 | Esophagus | ESCC | Various types of N-glycan biosynthesis | 31/4205 | 42/8465 | 1.23e-03 | 3.78e-03 | 1.93e-03 | 31 |
| hsa0051033 | Esophagus | ESCC | N-Glycan biosynthesis | 39/4205 | 53/8465 | 3.26e-04 | 1.15e-03 | 5.89e-04 | 39 |
| hsa0051313 | Esophagus | ESCC | Various types of N-glycan biosynthesis | 31/4205 | 42/8465 | 1.23e-03 | 3.78e-03 | 1.93e-03 | 31 |
| hsa0051021 | Liver | HCC | N-Glycan biosynthesis | 40/4020 | 53/8465 | 2.95e-05 | 1.87e-04 | 1.04e-04 | 40 |
| hsa005132 | Liver | HCC | Various types of N-glycan biosynthesis | 30/4020 | 42/8465 | 1.41e-03 | 5.07e-03 | 2.82e-03 | 30 |
| hsa0051031 | Liver | HCC | N-Glycan biosynthesis | 40/4020 | 53/8465 | 2.95e-05 | 1.87e-04 | 1.04e-04 | 40 |
| hsa005133 | Liver | HCC | Various types of N-glycan biosynthesis | 30/4020 | 42/8465 | 1.41e-03 | 5.07e-03 | 2.82e-03 | 30 |
| Page: 1 |
Top |
Cell-cell communication analysis |
| Identification of potential cell-cell interactions between two cell types and their ligand-receptor pairs for different disease states |
| Ligand | Receptor | LRpair | Pathway | Tissue | Disease Stage |
| Page: 1 |
Top |
Single-cell gene regulatory network inference analysis |
| Find out the significant the regulons (TFs) and the target genes of each regulon across cell types for different disease states |
| TF | Cell Type | Tissue | Disease Stage | Target Gene | RSS | Regulon Activity |
| ∗The dot plots of a searched regulon are shown for all cell subpopulations in each disease state of each tissue based on the regulon specific score inferred using pySCENIC and by calculating the average expression. |
| Page: 1 |
Top |
Somatic mutation of malignant transformation related genes |
| Annotation of somatic variants for genes involved in malignant transformation |
| Hugo Symbol | Variant Class | Variant Classification | dbSNP RS | HGVSc | HGVSp | HGVSp Short | SWISSPROT | BIOTYPE | SIFT | PolyPhen | Tumor Sample Barcode | Tissue | Histology | Sex | Age | Stage | Therapy Types | Drugs | Outcome |
| ALG1 | SNV | Missense_Mutation | c.252N>T | p.Gln84His | p.Q84H | Q9BT22 | protein_coding | tolerated(0.27) | benign(0) | TCGA-D8-A27G-01 | Breast | breast invasive carcinoma | Female | >=65 | I/II | Unknown | Unknown | SD | |
| ALG1 | SNV | Missense_Mutation | novel | c.276G>T | p.Gln92His | p.Q92H | Q9BT22 | protein_coding | deleterious(0.04) | benign(0.003) | TCGA-2W-A8YY-01 | Cervix | cervical & endocervical cancer | Female | <65 | I/II | Chemotherapy | cisplatin | CR |
| ALG1 | SNV | Missense_Mutation | rs150272167 | c.946G>A | p.Val316Ile | p.V316I | Q9BT22 | protein_coding | tolerated(0.36) | benign(0.144) | TCGA-2W-A8YY-01 | Cervix | cervical & endocervical cancer | Female | <65 | I/II | Chemotherapy | cisplatin | CR |
| ALG1 | SNV | Missense_Mutation | c.1387G>A | p.Asp463Asn | p.D463N | Q9BT22 | protein_coding | tolerated(0.16) | benign(0.115) | TCGA-DR-A0ZM-01 | Cervix | cervical & endocervical cancer | Female | <65 | III/IV | Unspecific | Cisplatin | SD | |
| ALG1 | SNV | Missense_Mutation | c.485N>A | p.Ser162Tyr | p.S162Y | Q9BT22 | protein_coding | deleterious(0) | possibly_damaging(0.885) | TCGA-JW-A5VL-01 | Cervix | cervical & endocervical cancer | Female | <65 | I/II | Unknown | Unknown | SD | |
| ALG1 | SNV | Missense_Mutation | rs145317306 | c.787C>T | p.Arg263Trp | p.R263W | Q9BT22 | protein_coding | tolerated(0.19) | benign(0.005) | TCGA-VS-A8EB-01 | Cervix | cervical & endocervical cancer | Female | <65 | III/IV | Unknown | Unknown | PD |
| ALG1 | SNV | Missense_Mutation | c.481N>C | p.Tyr161His | p.Y161H | Q9BT22 | protein_coding | tolerated(0.15) | probably_damaging(0.994) | TCGA-AA-3815-01 | Colorectum | colon adenocarcinoma | Female | >=65 | I/II | Unknown | Unknown | SD | |
| ALG1 | SNV | Missense_Mutation | c.806N>C | p.Leu269Pro | p.L269P | Q9BT22 | protein_coding | tolerated(0.25) | benign(0.124) | TCGA-AY-6197-01 | Colorectum | colon adenocarcinoma | Male | <65 | I/II | Unknown | Unknown | SD | |
| ALG1 | SNV | Missense_Mutation | rs143906919 | c.764N>T | p.Thr255Met | p.T255M | Q9BT22 | protein_coding | tolerated(0.27) | benign(0.005) | TCGA-QG-A5Z2-01 | Colorectum | colon adenocarcinoma | Male | <65 | I/II | Unknown | Unknown | SD |
| ALG1 | deletion | Frame_Shift_Del | c.398delC | p.Pro133GlnfsTer59 | p.P133Qfs*59 | Q9BT22 | protein_coding | TCGA-AM-5821-01 | Colorectum | colon adenocarcinoma | Female | >=65 | I/II | Unknown | Unknown | SD |
| Page: 1 2 3 4 |
Top |
Related drugs of malignant transformation related genes |
| Identification of chemicals and drugs interact with genes involved in malignant transfromation |
| (DGIdb 4.0) |
| Entrez ID | Symbol | Category | Interaction Types | Drug Claim Name | Drug Name | PMIDs |
| Page: 1 |

Copyright 2023-Present -The University of Texas Health Science Center at Houston |