
|
|||||
|
 | |
| |
| |
| |
| |
| |
|
Gene: ACSS2 |
Gene summary for ACSS2 |
| Gene information | Species | Human | Gene symbol | ACSS2 | Gene ID | 55902 |
| Gene name | acyl-CoA synthetase short chain family member 2 | |
| Gene Alias | ACAS2 | |
| Cytomap | 20q11.22 | |
| Gene Type | protein-coding | GO ID | GO:0006066 | UniProtAcc | Q96FY7 |
Top |
Malignant transformation analysis |
| Identification of the aberrant gene expression in precancerous and cancerous lesions by comparing the gene expression of stem-like cells in diseased tissues with normal stem cells |
| Entrez ID | Symbol | Replicates | Species | Organ | Tissue | Adj P-value | Log2FC | Malignancy |
| 55902 | ACSS2 | P21T-E | Human | Esophagus | ESCC | 2.82e-14 | 4.18e-01 | 0.1617 |
| 55902 | ACSS2 | P22T-E | Human | Esophagus | ESCC | 7.91e-22 | 4.51e-01 | 0.1236 |
| 55902 | ACSS2 | P23T-E | Human | Esophagus | ESCC | 5.05e-24 | 5.77e-01 | 0.108 |
| 55902 | ACSS2 | P24T-E | Human | Esophagus | ESCC | 1.05e-09 | 1.98e-01 | 0.1287 |
| 55902 | ACSS2 | P26T-E | Human | Esophagus | ESCC | 2.39e-37 | 6.98e-01 | 0.1276 |
| 55902 | ACSS2 | P27T-E | Human | Esophagus | ESCC | 3.98e-17 | 2.12e-01 | 0.1055 |
| 55902 | ACSS2 | P28T-E | Human | Esophagus | ESCC | 1.07e-23 | 5.51e-01 | 0.1149 |
| 55902 | ACSS2 | P30T-E | Human | Esophagus | ESCC | 1.38e-08 | 2.59e-01 | 0.137 |
| 55902 | ACSS2 | P31T-E | Human | Esophagus | ESCC | 7.25e-08 | 2.13e-01 | 0.1251 |
| 55902 | ACSS2 | P32T-E | Human | Esophagus | ESCC | 2.32e-14 | 3.58e-01 | 0.1666 |
| 55902 | ACSS2 | P36T-E | Human | Esophagus | ESCC | 7.26e-12 | 3.13e-01 | 0.1187 |
| 55902 | ACSS2 | P37T-E | Human | Esophagus | ESCC | 4.10e-09 | 1.39e-01 | 0.1371 |
| 55902 | ACSS2 | P38T-E | Human | Esophagus | ESCC | 6.12e-06 | 1.60e-01 | 0.127 |
| 55902 | ACSS2 | P39T-E | Human | Esophagus | ESCC | 8.88e-05 | 1.81e-01 | 0.0894 |
| 55902 | ACSS2 | P40T-E | Human | Esophagus | ESCC | 4.97e-05 | 1.03e-01 | 0.109 |
| 55902 | ACSS2 | P42T-E | Human | Esophagus | ESCC | 3.34e-10 | 3.34e-01 | 0.1175 |
| 55902 | ACSS2 | P44T-E | Human | Esophagus | ESCC | 7.87e-04 | 7.00e-02 | 0.1096 |
| 55902 | ACSS2 | P47T-E | Human | Esophagus | ESCC | 9.95e-14 | 2.50e-01 | 0.1067 |
| 55902 | ACSS2 | P48T-E | Human | Esophagus | ESCC | 7.84e-20 | 1.61e-01 | 0.0959 |
| 55902 | ACSS2 | P49T-E | Human | Esophagus | ESCC | 1.84e-08 | 7.08e-01 | 0.1768 |
| Page: 1 2 3 4 5 6 |
| Tissue | Expression Dynamics | Abbreviation |
| Colorectum (GSE201348) |  | FAP: Familial adenomatous polyposis |
| CRC: Colorectal cancer | ||
| Colorectum (HTA11) | 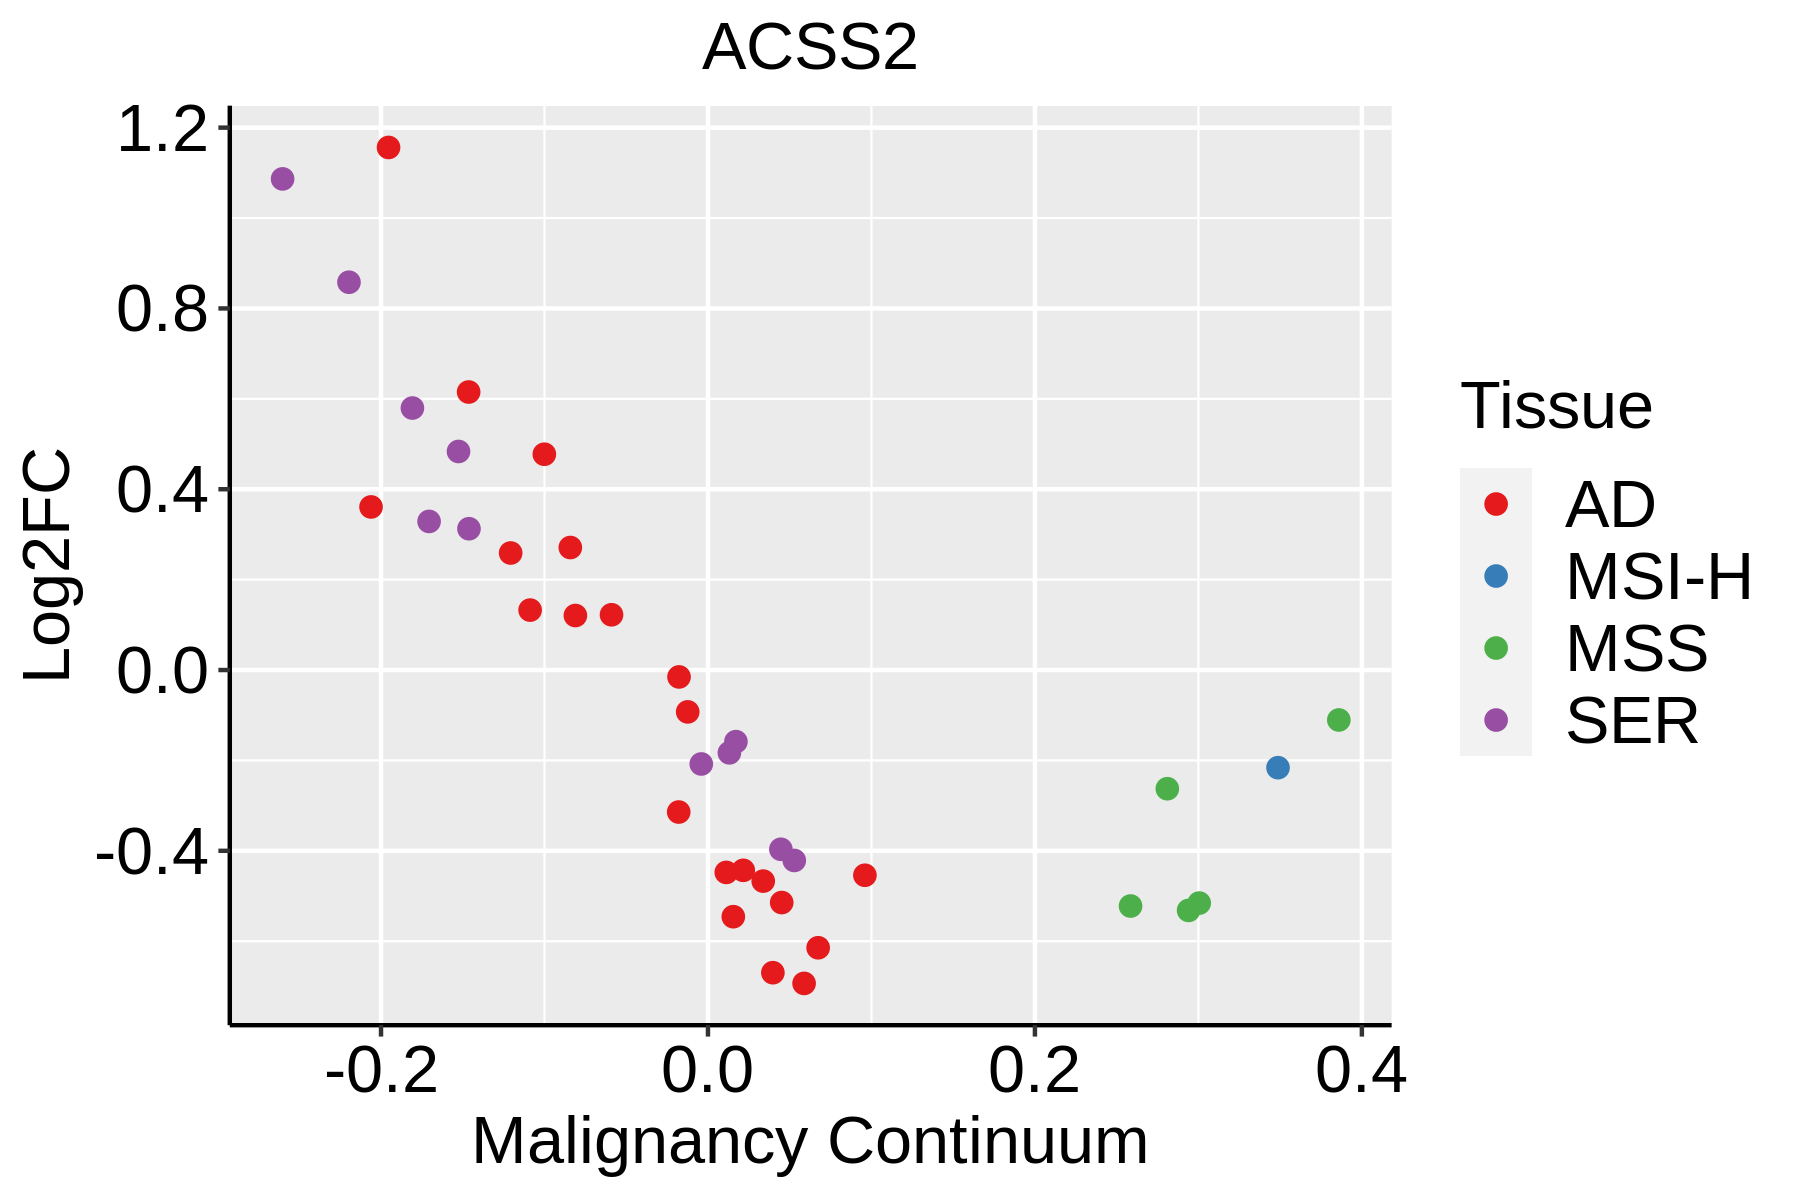 | AD: Adenomas |
| SER: Sessile serrated lesions | ||
| MSI-H: Microsatellite-high colorectal cancer | ||
| MSS: Microsatellite stable colorectal cancer | ||
| Esophagus | 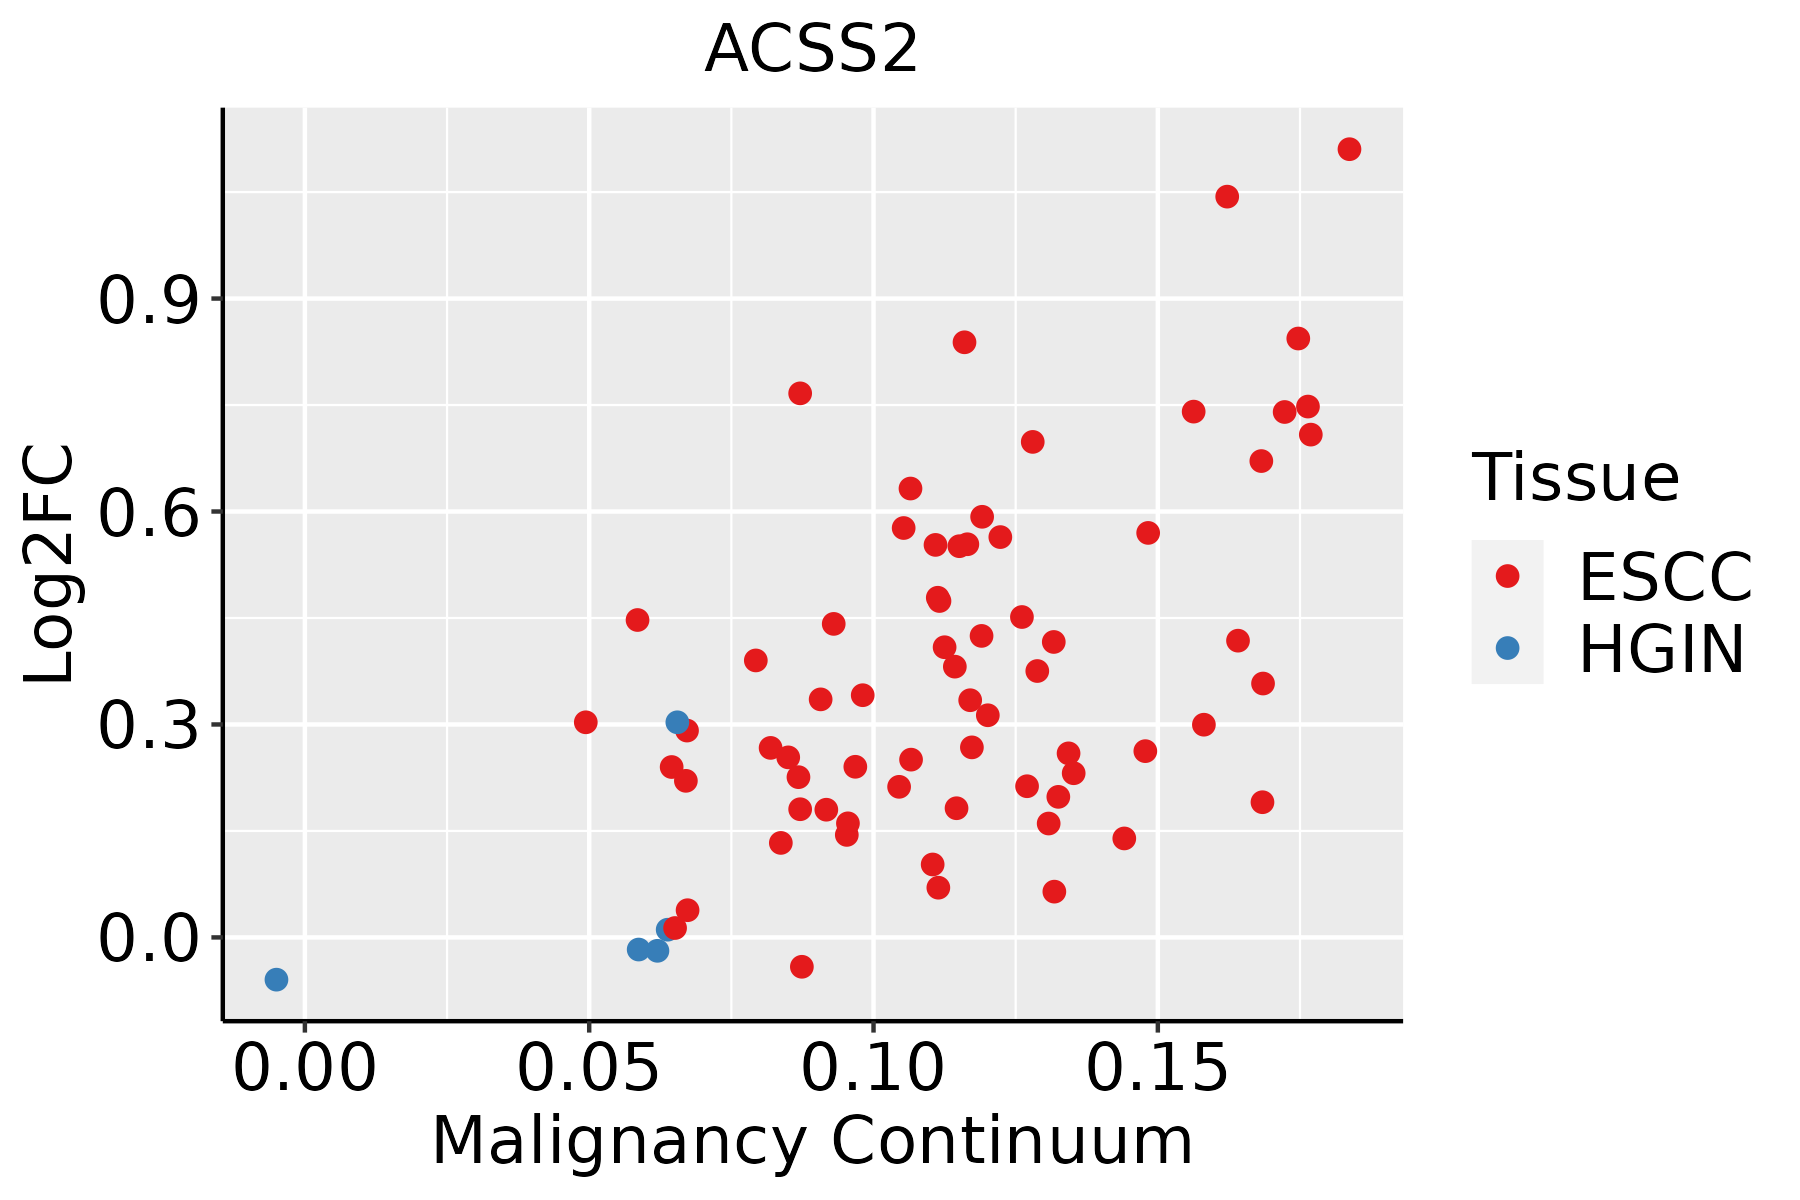 | ESCC: Esophageal squamous cell carcinoma |
| HGIN: High-grade intraepithelial neoplasias | ||
| LGIN: Low-grade intraepithelial neoplasias | ||
| Liver | 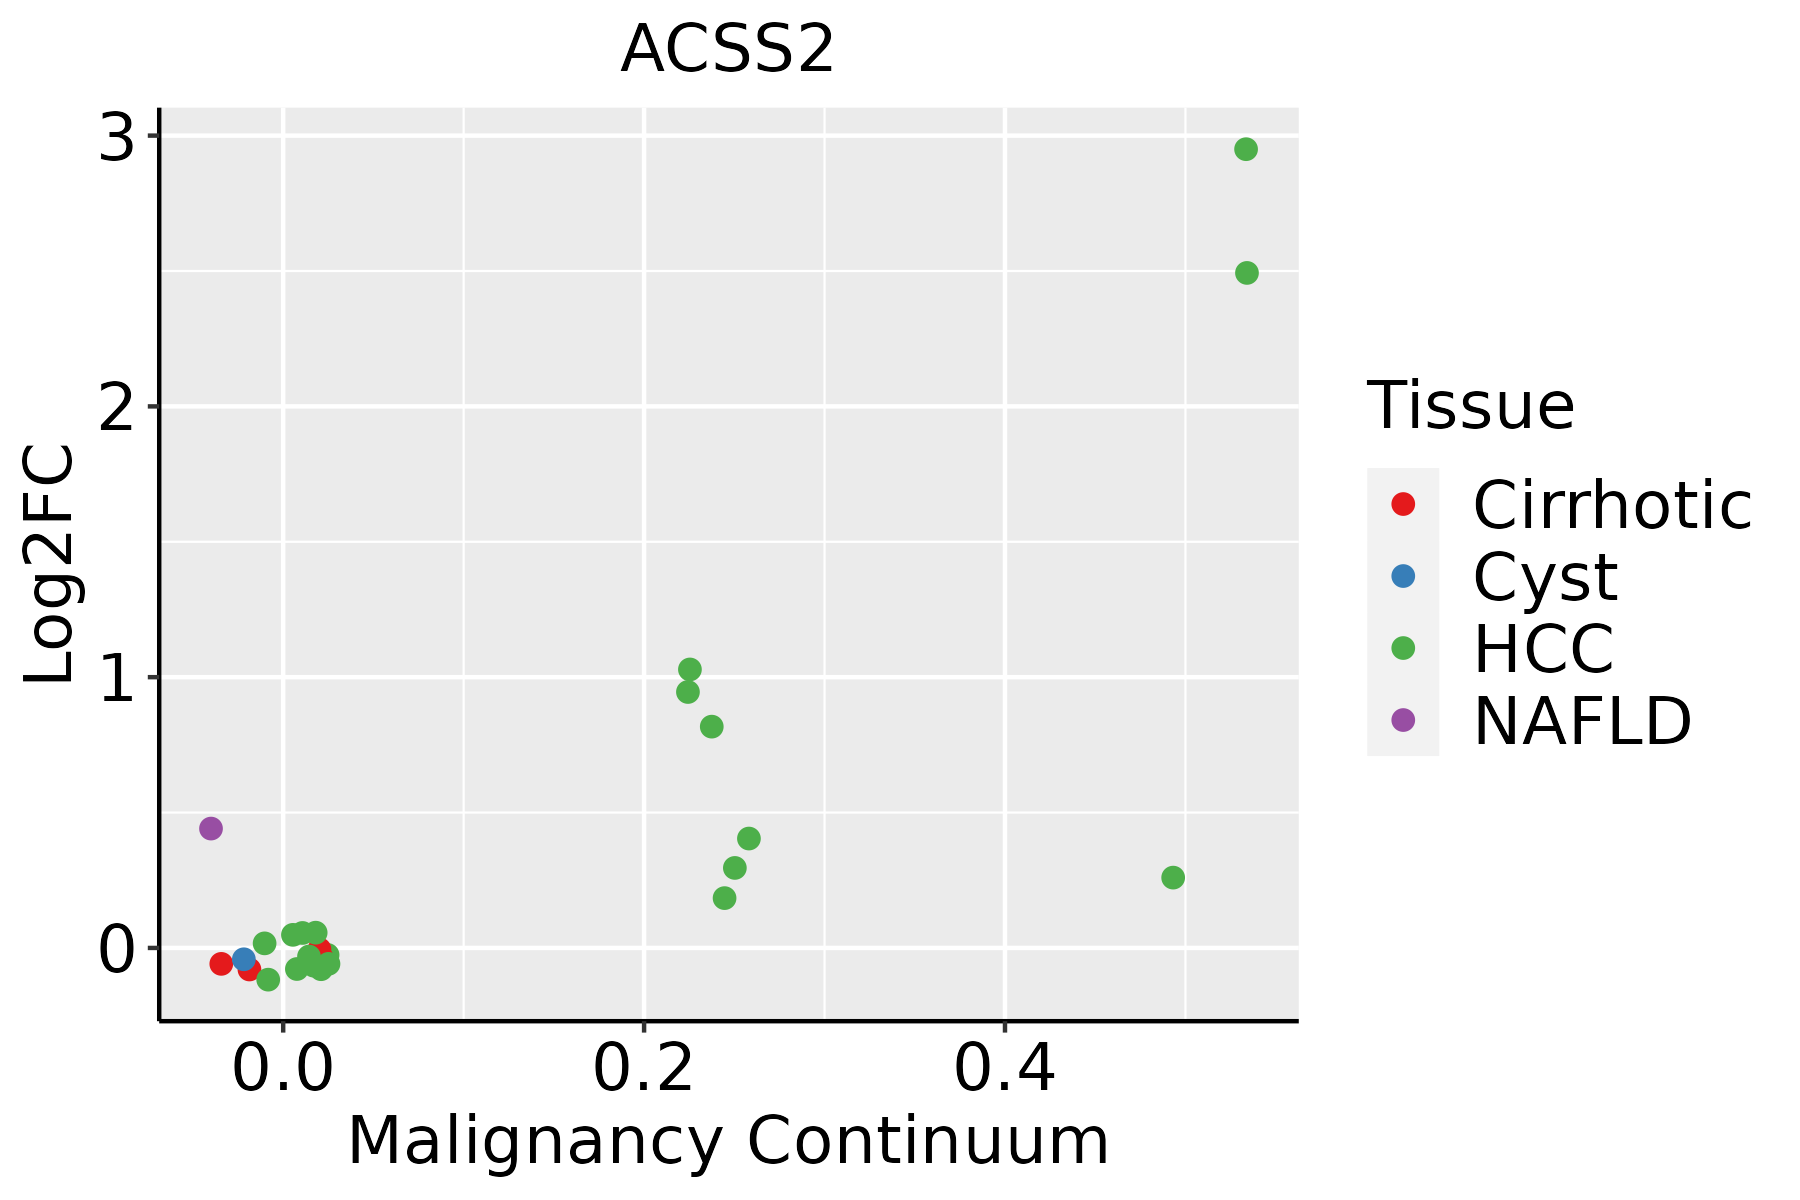 | HCC: Hepatocellular carcinoma |
| NAFLD: Non-alcoholic fatty liver disease |
| ∗log2FC in expression of this searched gene in stem-like cells from each diseased tissue sample relative to stem-like cells in normal samples in each tissue plotted against the malignancy continuum. Samples are colored based on if they are from different disease stage. |
Top |
Malignant transformation related pathway analysis |
| Find out the enriched GO biological processes and KEGG pathways involved in transition from healthy to precancer to cancer |
| Tissue | Disease Stage | Enriched GO biological Processes |
| Colorectum | AD |  |
| Colorectum | SER |  |
| Colorectum | MSS |  |
| Colorectum | MSI-H |  |
| Colorectum | FAP |  |
| ∗Top 15 enriched GO BP terms are showed in the bar plot of each disease state in each tissue. Each row represents a significant GO biological process which is colored according to the -log10(p.adjust). |
| Page: 1 2 3 4 5 6 7 8 9 |
| GO ID | Tissue | Disease Stage | Description | Gene Ratio | Bg Ratio | pvalue | p.adjust | Count |
| GO:0006091 | Colorectum | AD | generation of precursor metabolites and energy | 209/3918 | 490/18723 | 3.17e-28 | 6.61e-25 | 209 |
| GO:0009150 | Colorectum | AD | purine ribonucleotide metabolic process | 142/3918 | 368/18723 | 4.29e-15 | 1.17e-12 | 142 |
| GO:0006163 | Colorectum | AD | purine nucleotide metabolic process | 149/3918 | 396/18723 | 1.08e-14 | 2.80e-12 | 149 |
| GO:0072521 | Colorectum | AD | purine-containing compound metabolic process | 153/3918 | 416/18723 | 4.34e-14 | 1.01e-11 | 153 |
| GO:0009259 | Colorectum | AD | ribonucleotide metabolic process | 144/3918 | 385/18723 | 5.25e-14 | 1.13e-11 | 144 |
| GO:0019693 | Colorectum | AD | ribose phosphate metabolic process | 145/3918 | 396/18723 | 3.01e-13 | 5.71e-11 | 145 |
| GO:0009117 | Colorectum | AD | nucleotide metabolic process | 168/3918 | 489/18723 | 2.20e-12 | 3.36e-10 | 168 |
| GO:0006753 | Colorectum | AD | nucleoside phosphate metabolic process | 169/3918 | 497/18723 | 4.99e-12 | 6.98e-10 | 169 |
| GO:0009152 | Colorectum | AD | purine ribonucleotide biosynthetic process | 64/3918 | 169/18723 | 3.09e-07 | 1.22e-05 | 64 |
| GO:0009260 | Colorectum | AD | ribonucleotide biosynthetic process | 66/3918 | 182/18723 | 1.25e-06 | 4.02e-05 | 66 |
| GO:0046390 | Colorectum | AD | ribose phosphate biosynthetic process | 67/3918 | 190/18723 | 3.21e-06 | 9.05e-05 | 67 |
| GO:0006164 | Colorectum | AD | purine nucleotide biosynthetic process | 66/3918 | 191/18723 | 8.22e-06 | 1.97e-04 | 66 |
| GO:0072522 | Colorectum | AD | purine-containing compound biosynthetic process | 68/3918 | 200/18723 | 1.12e-05 | 2.55e-04 | 68 |
| GO:0006066 | Colorectum | AD | alcohol metabolic process | 106/3918 | 353/18723 | 3.02e-05 | 5.57e-04 | 106 |
| GO:0006631 | Colorectum | AD | fatty acid metabolic process | 114/3918 | 390/18723 | 5.58e-05 | 9.44e-04 | 114 |
| GO:1901293 | Colorectum | AD | nucleoside phosphate biosynthetic process | 80/3918 | 256/18723 | 6.31e-05 | 1.05e-03 | 80 |
| GO:0006790 | Colorectum | AD | sulfur compound metabolic process | 101/3918 | 339/18723 | 6.46e-05 | 1.07e-03 | 101 |
| GO:0009165 | Colorectum | AD | nucleotide biosynthetic process | 79/3918 | 254/18723 | 8.33e-05 | 1.30e-03 | 79 |
| GO:0033865 | Colorectum | AD | nucleoside bisphosphate metabolic process | 42/3918 | 128/18723 | 1.12e-03 | 1.02e-02 | 42 |
| GO:0033875 | Colorectum | AD | ribonucleoside bisphosphate metabolic process | 42/3918 | 128/18723 | 1.12e-03 | 1.02e-02 | 42 |
| Page: 1 2 3 4 5 6 7 8 9 10 |
| Pathway ID | Tissue | Disease Stage | Description | Gene Ratio | Bg Ratio | pvalue | p.adjust | qvalue | Count |
| hsa00620 | Colorectum | AD | Pyruvate metabolism | 28/2092 | 47/8465 | 3.71e-07 | 5.41e-06 | 3.45e-06 | 28 |
| hsa00640 | Colorectum | AD | Propanoate metabolism | 18/2092 | 32/8465 | 1.33e-04 | 1.11e-03 | 7.08e-04 | 18 |
| hsa006201 | Colorectum | AD | Pyruvate metabolism | 28/2092 | 47/8465 | 3.71e-07 | 5.41e-06 | 3.45e-06 | 28 |
| hsa006401 | Colorectum | AD | Propanoate metabolism | 18/2092 | 32/8465 | 1.33e-04 | 1.11e-03 | 7.08e-04 | 18 |
| hsa012002 | Colorectum | SER | Carbon metabolism | 40/1580 | 115/8465 | 2.77e-05 | 3.41e-04 | 2.47e-04 | 40 |
| hsa006402 | Colorectum | SER | Propanoate metabolism | 13/1580 | 32/8465 | 3.20e-03 | 2.12e-02 | 1.54e-02 | 13 |
| hsa012003 | Colorectum | SER | Carbon metabolism | 40/1580 | 115/8465 | 2.77e-05 | 3.41e-04 | 2.47e-04 | 40 |
| hsa006403 | Colorectum | SER | Propanoate metabolism | 13/1580 | 32/8465 | 3.20e-03 | 2.12e-02 | 1.54e-02 | 13 |
| hsa006204 | Colorectum | MSS | Pyruvate metabolism | 24/1875 | 47/8465 | 1.25e-05 | 1.35e-04 | 8.27e-05 | 24 |
| hsa012004 | Colorectum | MSS | Carbon metabolism | 43/1875 | 115/8465 | 1.37e-04 | 1.17e-03 | 7.19e-04 | 43 |
| hsa006404 | Colorectum | MSS | Propanoate metabolism | 15/1875 | 32/8465 | 1.68e-03 | 9.05e-03 | 5.55e-03 | 15 |
| hsa006205 | Colorectum | MSS | Pyruvate metabolism | 24/1875 | 47/8465 | 1.25e-05 | 1.35e-04 | 8.27e-05 | 24 |
| hsa012005 | Colorectum | MSS | Carbon metabolism | 43/1875 | 115/8465 | 1.37e-04 | 1.17e-03 | 7.19e-04 | 43 |
| hsa006405 | Colorectum | MSS | Propanoate metabolism | 15/1875 | 32/8465 | 1.68e-03 | 9.05e-03 | 5.55e-03 | 15 |
| hsa006406 | Colorectum | FAP | Propanoate metabolism | 15/1404 | 32/8465 | 6.21e-05 | 6.10e-04 | 3.71e-04 | 15 |
| hsa006206 | Colorectum | FAP | Pyruvate metabolism | 17/1404 | 47/8465 | 9.18e-04 | 5.20e-03 | 3.16e-03 | 17 |
| hsa006407 | Colorectum | FAP | Propanoate metabolism | 15/1404 | 32/8465 | 6.21e-05 | 6.10e-04 | 3.71e-04 | 15 |
| hsa006207 | Colorectum | FAP | Pyruvate metabolism | 17/1404 | 47/8465 | 9.18e-04 | 5.20e-03 | 3.16e-03 | 17 |
| hsa012008 | Colorectum | CRC | Carbon metabolism | 28/1091 | 115/8465 | 5.43e-04 | 5.48e-03 | 3.72e-03 | 28 |
| hsa006408 | Colorectum | CRC | Propanoate metabolism | 11/1091 | 32/8465 | 1.51e-03 | 1.17e-02 | 7.94e-03 | 11 |
| Page: 1 2 3 |
Top |
Cell-cell communication analysis |
| Identification of potential cell-cell interactions between two cell types and their ligand-receptor pairs for different disease states |
| Ligand | Receptor | LRpair | Pathway | Tissue | Disease Stage |
| Page: 1 |
Top |
Single-cell gene regulatory network inference analysis |
| Find out the significant the regulons (TFs) and the target genes of each regulon across cell types for different disease states |
| TF | Cell Type | Tissue | Disease Stage | Target Gene | RSS | Regulon Activity |
| ∗The dot plots of a searched regulon are shown for all cell subpopulations in each disease state of each tissue based on the regulon specific score inferred using pySCENIC and by calculating the average expression. |
| Page: 1 |
Top |
Somatic mutation of malignant transformation related genes |
| Annotation of somatic variants for genes involved in malignant transformation |
| Hugo Symbol | Variant Class | Variant Classification | dbSNP RS | HGVSc | HGVSp | HGVSp Short | SWISSPROT | BIOTYPE | SIFT | PolyPhen | Tumor Sample Barcode | Tissue | Histology | Sex | Age | Stage | Therapy Types | Drugs | Outcome |
| ACSS2 | SNV | Missense_Mutation | c.535N>T | p.Ala179Ser | p.A179S | Q9NR19 | protein_coding | deleterious(0.03) | probably_damaging(0.913) | TCGA-D8-A1XL-01 | Breast | breast invasive carcinoma | Female | <65 | I/II | Chemotherapy | doxorubicine+cyclophosphamide+tamoxifen | SD | |
| ACSS2 | SNV | Missense_Mutation | novel | c.1966N>A | p.Ala656Thr | p.A656T | Q9NR19 | protein_coding | deleterious(0) | possibly_damaging(0.71) | TCGA-2W-A8YY-01 | Cervix | cervical & endocervical cancer | Female | <65 | I/II | Chemotherapy | cisplatin | CR |
| ACSS2 | SNV | Missense_Mutation | c.403N>G | p.Gln135Glu | p.Q135E | Q9NR19 | protein_coding | tolerated(0.26) | benign(0.01) | TCGA-DR-A0ZM-01 | Cervix | cervical & endocervical cancer | Female | <65 | III/IV | Unspecific | Cisplatin | SD | |
| ACSS2 | SNV | Missense_Mutation | novel | c.2033N>T | p.Arg678Leu | p.R678L | Q9NR19 | protein_coding | deleterious(0) | probably_damaging(0.987) | TCGA-A6-3808-01 | Colorectum | colon adenocarcinoma | Male | >=65 | I/II | Unknown | Unknown | SD |
| ACSS2 | SNV | Missense_Mutation | novel | c.517C>A | p.Leu173Ile | p.L173I | Q9NR19 | protein_coding | deleterious(0.05) | possibly_damaging(0.461) | TCGA-AA-3939-01 | Colorectum | colon adenocarcinoma | Male | >=65 | I/II | Unknown | Unknown | SD |
| ACSS2 | SNV | Missense_Mutation | novel | c.1518C>A | p.Phe506Leu | p.F506L | Q9NR19 | protein_coding | deleterious(0.01) | probably_damaging(0.976) | TCGA-AA-3984-01 | Colorectum | colon adenocarcinoma | Female | <65 | I/II | Unknown | Unknown | SD |
| ACSS2 | SNV | Missense_Mutation | rs757812388 | c.329G>A | p.Arg110Gln | p.R110Q | Q9NR19 | protein_coding | deleterious(0.01) | possibly_damaging(0.746) | TCGA-AA-A00N-01 | Colorectum | colon adenocarcinoma | Male | >=65 | I/II | Unknown | Unknown | PD |
| ACSS2 | SNV | Missense_Mutation | rs774600970 | c.1705N>T | p.Arg569Trp | p.R569W | Q9NR19 | protein_coding | deleterious(0) | probably_damaging(1) | TCGA-AA-A022-01 | Colorectum | colon adenocarcinoma | Female | >=65 | I/II | Unknown | Unknown | SD |
| ACSS2 | SNV | Missense_Mutation | novel | c.2050N>T | p.Ala684Ser | p.A684S | Q9NR19 | protein_coding | deleterious(0) | probably_damaging(0.951) | TCGA-AA-A02J-01 | Colorectum | colon adenocarcinoma | Female | >=65 | III/IV | Unknown | Unknown | PD |
| ACSS2 | SNV | Missense_Mutation | rs754546126 | c.1639N>A | p.Glu547Lys | p.E547K | Q9NR19 | protein_coding | tolerated(0.28) | benign(0.014) | TCGA-AZ-4315-01 | Colorectum | colon adenocarcinoma | Male | <65 | I/II | Unknown | Unknown | SD |
| Page: 1 2 3 4 5 6 7 |
Top |
Related drugs of malignant transformation related genes |
| Identification of chemicals and drugs interact with genes involved in malignant transfromation |
| (DGIdb 4.0) |
| Entrez ID | Symbol | Category | Interaction Types | Drug Claim Name | Drug Name | PMIDs |
| 55902 | ACSS2 | ENZYME, TRANSCRIPTION FACTOR | docetaxel | DOCETAXEL | 21636554 | |
| 55902 | ACSS2 | ENZYME, TRANSCRIPTION FACTOR | inhibitor | 405560508 | ||
| 55902 | ACSS2 | ENZYME, TRANSCRIPTION FACTOR | paclitaxel | PACLITAXEL | 21636554 | |
| 55902 | ACSS2 | ENZYME, TRANSCRIPTION FACTOR | gemcitabine | GEMCITABINE | 21636554 | |
| 55902 | ACSS2 | ENZYME, TRANSCRIPTION FACTOR | ethanol | ALCOHOL | 28550509 | |
| 55902 | ACSS2 | ENZYME, TRANSCRIPTION FACTOR | cisplatin | CISPLATIN | 21636554 | |
| 55902 | ACSS2 | ENZYME, TRANSCRIPTION FACTOR | carboplatin | CARBOPLATIN | 21636554 |
| Page: 1 |

Copyright 2023-Present -The University of Texas Health Science Center at Houston |