
|
|||||
|
 | |
| |
| |
| |
| |
| |
|
Gene: ACAP3 |
Gene summary for ACAP3 |
| Gene information | Species | Human | Gene symbol | ACAP3 | Gene ID | 116983 |
| Gene name | ArfGAP with coiled-coil, ankyrin repeat and PH domains 3 | |
| Gene Alias | CENTB5 | |
| Cytomap | 1p36.33 | |
| Gene Type | protein-coding | GO ID | GO:0001764 | UniProtAcc | Q8WTZ1 |
Top |
Malignant transformation analysis |
| Identification of the aberrant gene expression in precancerous and cancerous lesions by comparing the gene expression of stem-like cells in diseased tissues with normal stem cells |
| Entrez ID | Symbol | Replicates | Species | Organ | Tissue | Adj P-value | Log2FC | Malignancy |
| 116983 | ACAP3 | S029 | Human | Liver | HCC | 2.64e-05 | 3.87e-01 | 0.2581 |
| 116983 | ACAP3 | C21 | Human | Oral cavity | OSCC | 2.98e-14 | 5.10e-01 | 0.2678 |
| 116983 | ACAP3 | C30 | Human | Oral cavity | OSCC | 8.78e-22 | 9.38e-01 | 0.3055 |
| 116983 | ACAP3 | C51 | Human | Oral cavity | OSCC | 5.01e-13 | 7.27e-01 | 0.2674 |
| 116983 | ACAP3 | C57 | Human | Oral cavity | OSCC | 2.12e-02 | 2.91e-01 | 0.1679 |
| 116983 | ACAP3 | C08 | Human | Oral cavity | OSCC | 4.19e-03 | 1.71e-01 | 0.1919 |
| 116983 | ACAP3 | LN22 | Human | Oral cavity | OSCC | 2.77e-02 | 3.68e-01 | 0.1733 |
| 116983 | ACAP3 | LP15 | Human | Oral cavity | LP | 5.11e-05 | 8.38e-01 | 0.2174 |
| 116983 | ACAP3 | LP17 | Human | Oral cavity | LP | 8.05e-03 | 6.74e-01 | 0.2349 |
| 116983 | ACAP3 | SYSMH1 | Human | Oral cavity | OSCC | 4.14e-07 | 3.43e-01 | 0.1127 |
| 116983 | ACAP3 | SYSMH2 | Human | Oral cavity | OSCC | 7.83e-09 | 3.27e-01 | 0.2326 |
| 116983 | ACAP3 | SYSMH3 | Human | Oral cavity | OSCC | 7.11e-16 | 5.92e-01 | 0.2442 |
| 116983 | ACAP3 | P4_S8_cSCC | Human | Skin | cSCC | 1.25e-09 | 2.18e-01 | -0.3095 |
| 116983 | ACAP3 | P1_cSCC | Human | Skin | cSCC | 5.98e-19 | 7.21e-01 | 0.0292 |
| 116983 | ACAP3 | P2_cSCC | Human | Skin | cSCC | 9.47e-08 | 3.88e-01 | -0.024 |
| 116983 | ACAP3 | P4_cSCC | Human | Skin | cSCC | 2.08e-07 | 2.60e-01 | -0.00290000000000005 |
| 116983 | ACAP3 | P10_cSCC | Human | Skin | cSCC | 1.78e-12 | 4.60e-01 | 0.1017 |
| Page: 1 2 3 4 |
| Tissue | Expression Dynamics | Abbreviation |
| Esophagus | 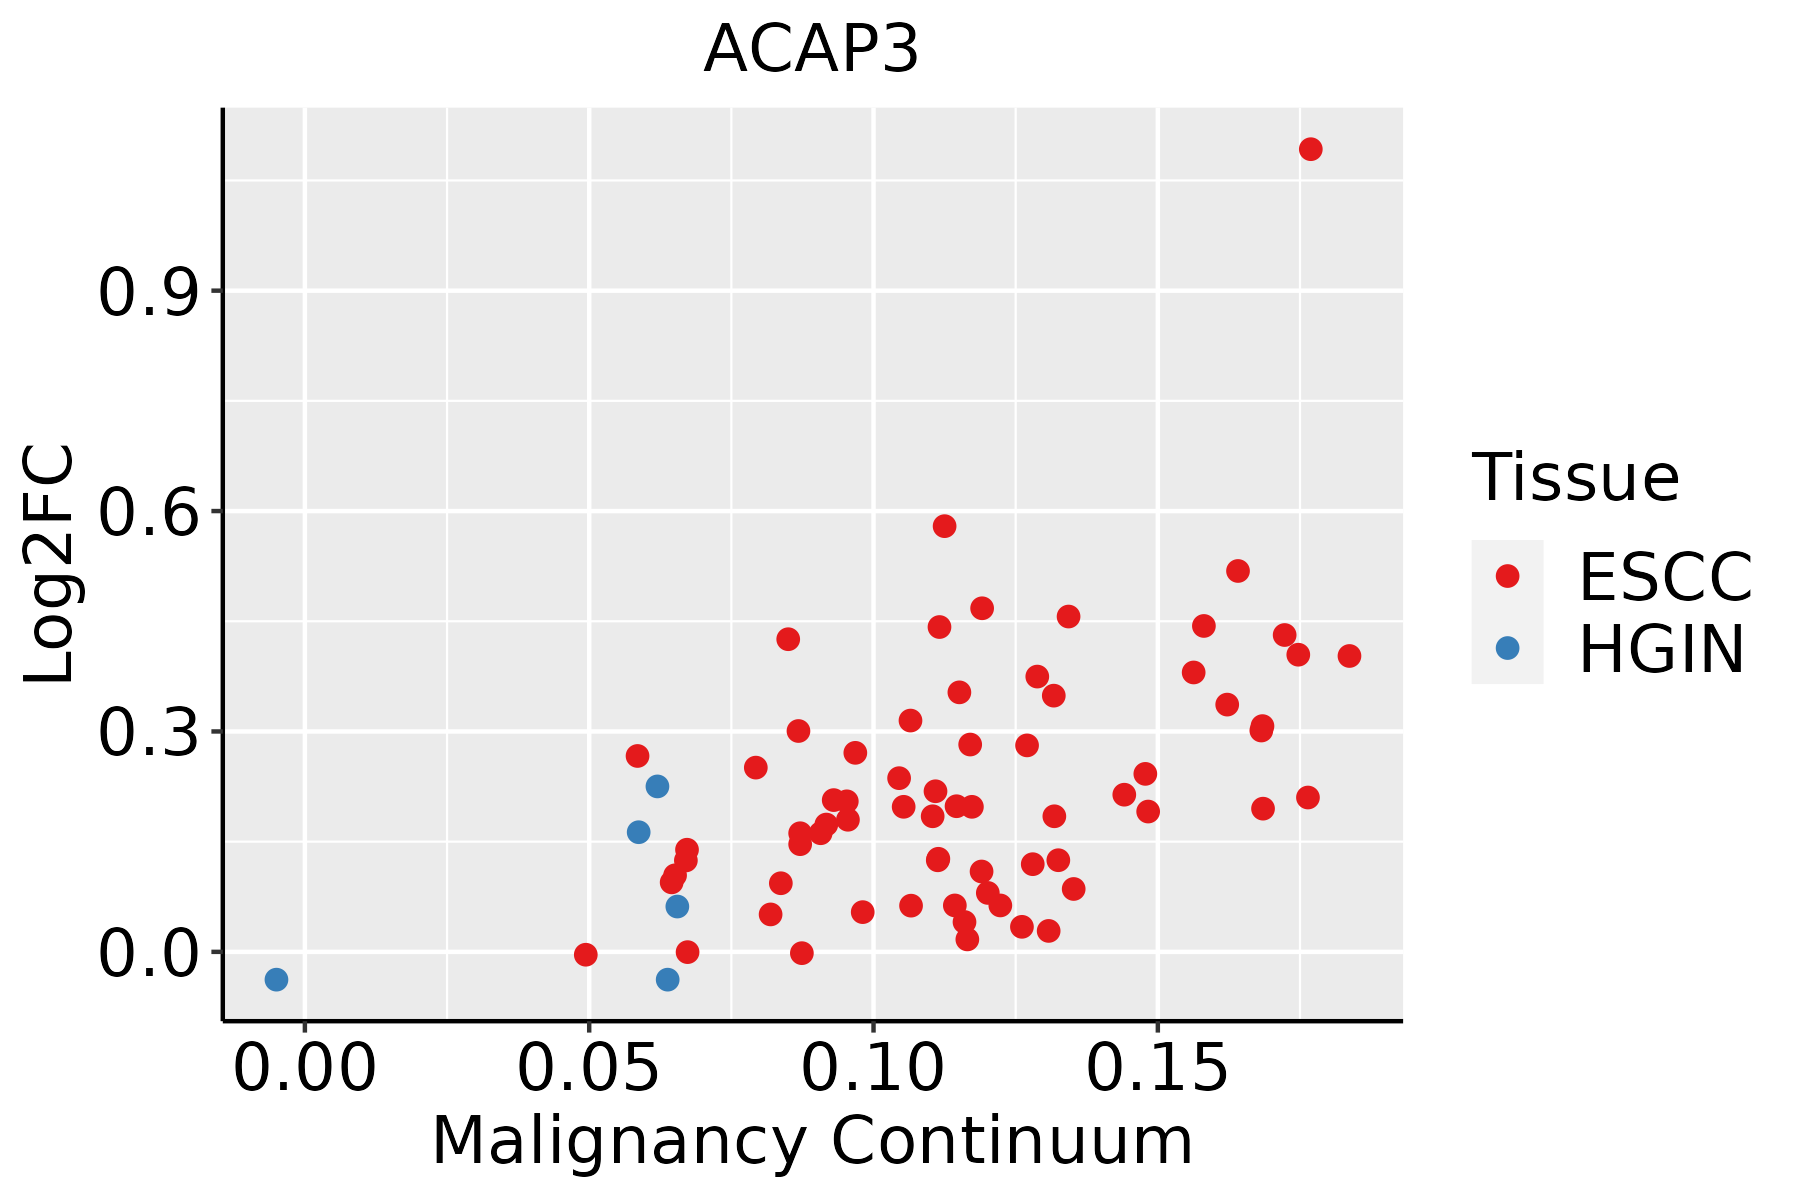 | ESCC: Esophageal squamous cell carcinoma |
| HGIN: High-grade intraepithelial neoplasias | ||
| LGIN: Low-grade intraepithelial neoplasias | ||
| Liver |  | HCC: Hepatocellular carcinoma |
| NAFLD: Non-alcoholic fatty liver disease | ||
| Oral Cavity | 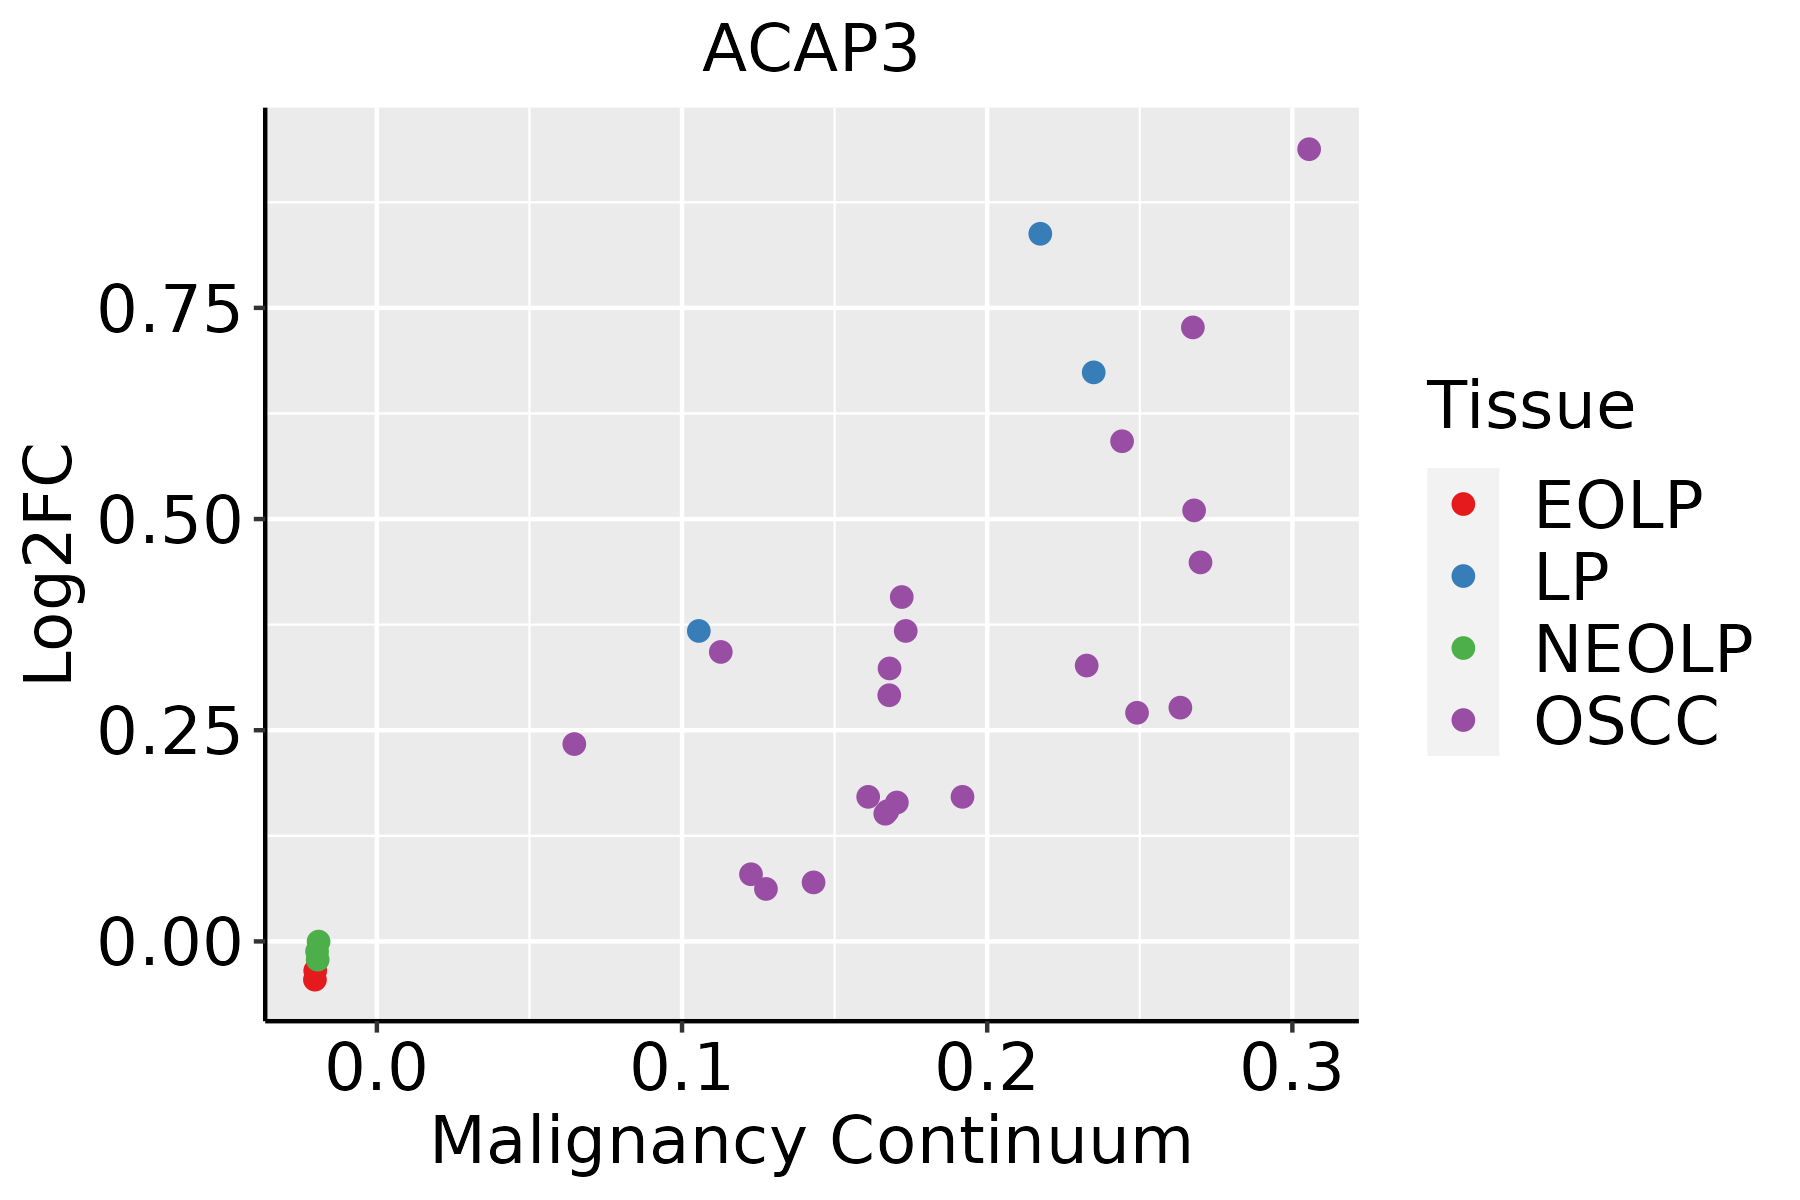 | EOLP: Erosive Oral lichen planus |
| LP: leukoplakia | ||
| NEOLP: Non-erosive oral lichen planus | ||
| OSCC: Oral squamous cell carcinoma | ||
| Skin | 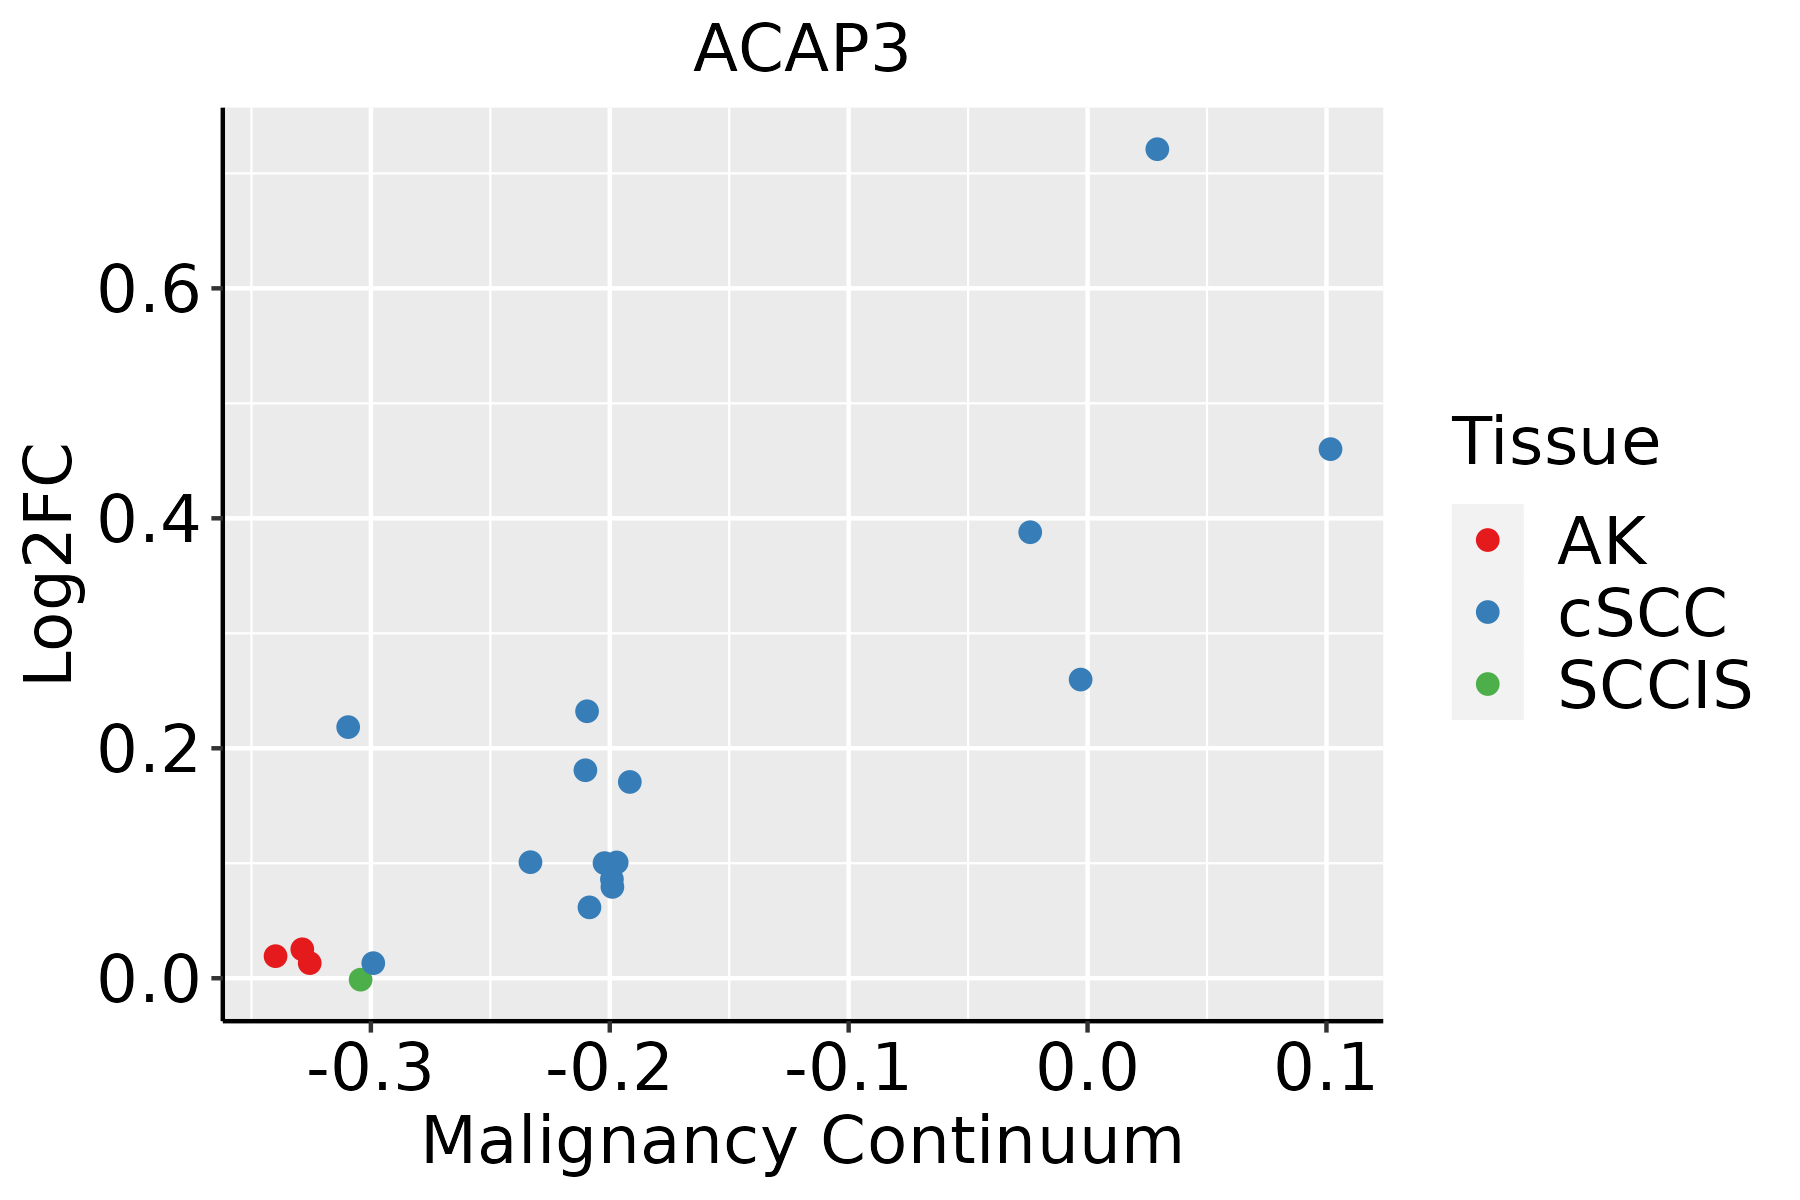 | AK: Actinic keratosis |
| cSCC: Cutaneous squamous cell carcinoma | ||
| SCCIS:squamous cell carcinoma in situ |
| ∗log2FC in expression of this searched gene in stem-like cells from each diseased tissue sample relative to stem-like cells in normal samples in each tissue plotted against the malignancy continuum. Samples are colored based on if they are from different disease stage. |
Top |
Malignant transformation related pathway analysis |
| Find out the enriched GO biological processes and KEGG pathways involved in transition from healthy to precancer to cancer |
| Tissue | Disease Stage | Enriched GO biological Processes |
| Colorectum | AD |  |
| Colorectum | SER |  |
| Colorectum | MSS |  |
| Colorectum | MSI-H |  |
| Colorectum | FAP |  |
| ∗Top 15 enriched GO BP terms are showed in the bar plot of each disease state in each tissue. Each row represents a significant GO biological process which is colored according to the -log10(p.adjust). |
| Page: 1 2 3 4 5 6 7 8 9 |
| GO ID | Tissue | Disease Stage | Description | Gene Ratio | Bg Ratio | pvalue | p.adjust | Count |
| GO:001097516 | Esophagus | ESCC | regulation of neuron projection development | 240/8552 | 445/18723 | 2.48e-04 | 1.53e-03 | 240 |
| GO:001097511 | Liver | HCC | regulation of neuron projection development | 220/7958 | 445/18723 | 1.68e-03 | 8.78e-03 | 220 |
| GO:001097510 | Oral cavity | OSCC | regulation of neuron projection development | 210/7305 | 445/18723 | 2.35e-04 | 1.52e-03 | 210 |
| GO:001097522 | Skin | cSCC | regulation of neuron projection development | 141/4864 | 445/18723 | 3.72e-03 | 1.99e-02 | 141 |
| Page: 1 |
| Pathway ID | Tissue | Disease Stage | Description | Gene Ratio | Bg Ratio | pvalue | p.adjust | qvalue | Count |
| hsa0414429 | Esophagus | HGIN | Endocytosis | 76/1383 | 251/8465 | 1.74e-08 | 3.34e-07 | 2.65e-07 | 76 |
| hsa04144113 | Esophagus | HGIN | Endocytosis | 76/1383 | 251/8465 | 1.74e-08 | 3.34e-07 | 2.65e-07 | 76 |
| hsa04144210 | Esophagus | ESCC | Endocytosis | 186/4205 | 251/8465 | 9.74e-16 | 4.66e-14 | 2.39e-14 | 186 |
| hsa0414437 | Esophagus | ESCC | Endocytosis | 186/4205 | 251/8465 | 9.74e-16 | 4.66e-14 | 2.39e-14 | 186 |
| hsa0414422 | Liver | HCC | Endocytosis | 178/4020 | 251/8465 | 2.03e-14 | 5.22e-13 | 2.91e-13 | 178 |
| hsa0414432 | Liver | HCC | Endocytosis | 178/4020 | 251/8465 | 2.03e-14 | 5.22e-13 | 2.91e-13 | 178 |
| hsa0414427 | Oral cavity | OSCC | Endocytosis | 174/3704 | 251/8465 | 9.42e-17 | 4.51e-15 | 2.29e-15 | 174 |
| hsa04144112 | Oral cavity | OSCC | Endocytosis | 174/3704 | 251/8465 | 9.42e-17 | 4.51e-15 | 2.29e-15 | 174 |
| Page: 1 |
Top |
Cell-cell communication analysis |
| Identification of potential cell-cell interactions between two cell types and their ligand-receptor pairs for different disease states |
| Ligand | Receptor | LRpair | Pathway | Tissue | Disease Stage |
| Page: 1 |
Top |
Single-cell gene regulatory network inference analysis |
| Find out the significant the regulons (TFs) and the target genes of each regulon across cell types for different disease states |
| TF | Cell Type | Tissue | Disease Stage | Target Gene | RSS | Regulon Activity |
| ∗The dot plots of a searched regulon are shown for all cell subpopulations in each disease state of each tissue based on the regulon specific score inferred using pySCENIC and by calculating the average expression. |
| Page: 1 |
Top |
Somatic mutation of malignant transformation related genes |
| Annotation of somatic variants for genes involved in malignant transformation |
| Hugo Symbol | Variant Class | Variant Classification | dbSNP RS | HGVSc | HGVSp | HGVSp Short | SWISSPROT | BIOTYPE | SIFT | PolyPhen | Tumor Sample Barcode | Tissue | Histology | Sex | Age | Stage | Therapy Types | Drugs | Outcome |
| ACAP3 | SNV | Missense_Mutation | novel | c.391N>T | p.Asp131Tyr | p.D131Y | Q96P50 | protein_coding | deleterious(0) | probably_damaging(0.935) | TCGA-A7-A6VX-01 | Breast | breast invasive carcinoma | Female | >=65 | I/II | Chemotherapy | docetaxel | CR |
| ACAP3 | SNV | Missense_Mutation | c.2152G>A | p.Val718Ile | p.V718I | Q96P50 | protein_coding | tolerated(0.15) | benign(0.007) | TCGA-BH-A18V-01 | Breast | breast invasive carcinoma | Female | <65 | I/II | Unknown | Unknown | SD | |
| ACAP3 | SNV | Missense_Mutation | c.211N>A | p.Asp71Asn | p.D71N | Q96P50 | protein_coding | deleterious(0) | possibly_damaging(0.613) | TCGA-EW-A1IY-01 | Breast | breast invasive carcinoma | Female | <65 | I/II | Chemotherapy | taxotere | SD | |
| ACAP3 | SNV | Missense_Mutation | rs532645854 | c.217N>A | p.Val73Ile | p.V73I | Q96P50 | protein_coding | tolerated(0.08) | benign(0.042) | TCGA-GM-A2DB-01 | Breast | breast invasive carcinoma | Female | <65 | I/II | Chemotherapy | taxol | CR |
| ACAP3 | SNV | Missense_Mutation | c.1687G>C | p.Val563Leu | p.V563L | Q96P50 | protein_coding | tolerated(0.48) | benign(0) | TCGA-DG-A2KL-01 | Cervix | cervical & endocervical cancer | Female | <65 | I/II | Chemotherapy | cisplatin | SD | |
| ACAP3 | SNV | Missense_Mutation | c.680N>G | p.Ile227Ser | p.I227S | Q96P50 | protein_coding | tolerated(0.11) | benign(0.118) | TCGA-HM-A3JK-01 | Cervix | cervical & endocervical cancer | Female | <65 | I/II | Chemotherapy | cisplatin | SD | |
| ACAP3 | SNV | Missense_Mutation | c.247N>A | p.Asp83Asn | p.D83N | Q96P50 | protein_coding | tolerated(0.12) | benign(0.197) | TCGA-JX-A3Q0-01 | Cervix | cervical & endocervical cancer | Female | <65 | III/IV | Unknown | Unknown | SD | |
| ACAP3 | SNV | Missense_Mutation | rs765208758 | c.1099N>T | p.Arg367Cys | p.R367C | Q96P50 | protein_coding | deleterious(0) | possibly_damaging(0.794) | TCGA-AD-6895-01 | Colorectum | colon adenocarcinoma | Male | >=65 | III/IV | Unknown | Unknown | SD |
| ACAP3 | SNV | Missense_Mutation | novel | c.1454C>T | p.Ala485Val | p.A485V | Q96P50 | protein_coding | deleterious(0) | benign(0.033) | TCGA-AD-6964-01 | Colorectum | colon adenocarcinoma | Male | <65 | III/IV | Chemotherapy | folfox | PD |
| ACAP3 | SNV | Missense_Mutation | c.2096C>T | p.Ala699Val | p.A699V | Q96P50 | protein_coding | tolerated(0.33) | benign(0.003) | TCGA-AZ-6601-01 | Colorectum | colon adenocarcinoma | Male | >=65 | I/II | Unknown | Unknown | PD |
| Page: 1 2 3 4 5 |
Top |
Related drugs of malignant transformation related genes |
| Identification of chemicals and drugs interact with genes involved in malignant transfromation |
| (DGIdb 4.0) |
| Entrez ID | Symbol | Category | Interaction Types | Drug Claim Name | Drug Name | PMIDs |
| Page: 1 |

Copyright 2023-Present -The University of Texas Health Science Center at Houston |