
|
|||||
|
 | |
| |
| |
| |
| |
| |
|
Gene: ABHD2 |
Gene summary for ABHD2 |
| Gene information | Species | Human | Gene symbol | ABHD2 | Gene ID | 11057 |
| Gene name | abhydrolase domain containing 2, acylglycerol lipase | |
| Gene Alias | HS1-2 | |
| Cytomap | 15q26.1 | |
| Gene Type | protein-coding | GO ID | GO:0000003 | UniProtAcc | A0A024RC89 |
Top |
Malignant transformation analysis |
| Identification of the aberrant gene expression in precancerous and cancerous lesions by comparing the gene expression of stem-like cells in diseased tissues with normal stem cells |
| Entrez ID | Symbol | Replicates | Species | Organ | Tissue | Adj P-value | Log2FC | Malignancy |
| 11057 | ABHD2 | P37T-E | Human | Esophagus | ESCC | 1.29e-10 | 2.77e-01 | 0.1371 |
| 11057 | ABHD2 | P38T-E | Human | Esophagus | ESCC | 4.35e-02 | 1.19e-01 | 0.127 |
| 11057 | ABHD2 | P39T-E | Human | Esophagus | ESCC | 1.17e-36 | 9.50e-01 | 0.0894 |
| 11057 | ABHD2 | P40T-E | Human | Esophagus | ESCC | 1.23e-07 | 4.10e-01 | 0.109 |
| 11057 | ABHD2 | P42T-E | Human | Esophagus | ESCC | 5.88e-26 | 1.08e+00 | 0.1175 |
| 11057 | ABHD2 | P44T-E | Human | Esophagus | ESCC | 1.20e-04 | 1.68e-01 | 0.1096 |
| 11057 | ABHD2 | P47T-E | Human | Esophagus | ESCC | 3.72e-07 | 1.76e-01 | 0.1067 |
| 11057 | ABHD2 | P48T-E | Human | Esophagus | ESCC | 8.69e-17 | 6.05e-01 | 0.0959 |
| 11057 | ABHD2 | P49T-E | Human | Esophagus | ESCC | 1.55e-05 | 7.96e-01 | 0.1768 |
| 11057 | ABHD2 | P52T-E | Human | Esophagus | ESCC | 1.24e-12 | 2.41e-01 | 0.1555 |
| 11057 | ABHD2 | P54T-E | Human | Esophagus | ESCC | 1.01e-18 | 6.36e-01 | 0.0975 |
| 11057 | ABHD2 | P56T-E | Human | Esophagus | ESCC | 1.97e-02 | 5.61e-01 | 0.1613 |
| 11057 | ABHD2 | P57T-E | Human | Esophagus | ESCC | 2.57e-10 | 5.04e-01 | 0.0926 |
| 11057 | ABHD2 | P61T-E | Human | Esophagus | ESCC | 1.62e-11 | 3.32e-01 | 0.099 |
| 11057 | ABHD2 | P62T-E | Human | Esophagus | ESCC | 4.32e-15 | 1.68e-01 | 0.1302 |
| 11057 | ABHD2 | P65T-E | Human | Esophagus | ESCC | 8.07e-14 | 3.27e-01 | 0.0978 |
| 11057 | ABHD2 | P74T-E | Human | Esophagus | ESCC | 1.03e-12 | 2.99e-01 | 0.1479 |
| 11057 | ABHD2 | P75T-E | Human | Esophagus | ESCC | 7.22e-25 | 5.30e-01 | 0.1125 |
| 11057 | ABHD2 | P76T-E | Human | Esophagus | ESCC | 1.13e-09 | 1.74e-01 | 0.1207 |
| 11057 | ABHD2 | P79T-E | Human | Esophagus | ESCC | 3.76e-09 | 1.59e-01 | 0.1154 |
| Page: 1 2 3 4 5 6 7 8 |
| Tissue | Expression Dynamics | Abbreviation |
| Colorectum (GSE201348) |  | FAP: Familial adenomatous polyposis |
| CRC: Colorectal cancer | ||
| Colorectum (HTA11) |  | AD: Adenomas |
| SER: Sessile serrated lesions | ||
| MSI-H: Microsatellite-high colorectal cancer | ||
| MSS: Microsatellite stable colorectal cancer | ||
| Esophagus |  | ESCC: Esophageal squamous cell carcinoma |
| HGIN: High-grade intraepithelial neoplasias | ||
| LGIN: Low-grade intraepithelial neoplasias | ||
| Liver | 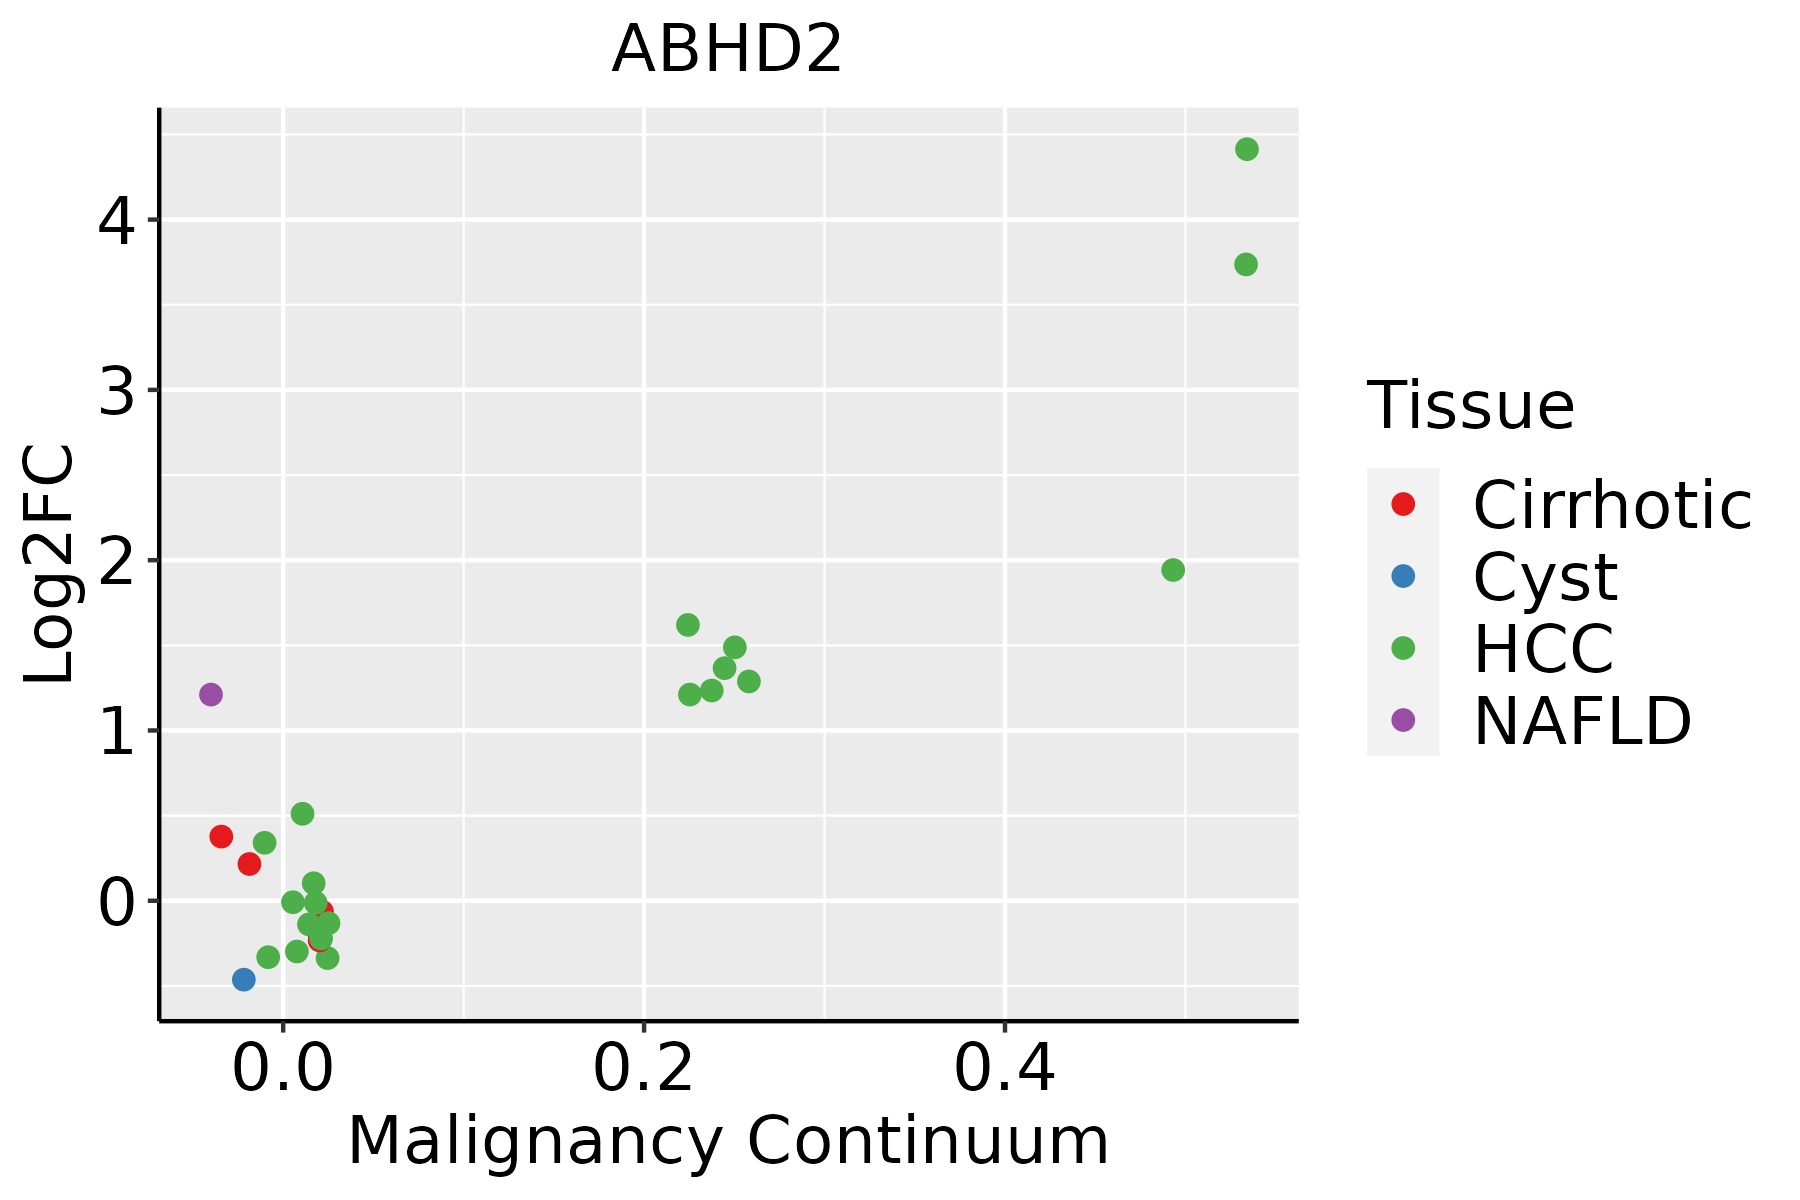 | HCC: Hepatocellular carcinoma |
| NAFLD: Non-alcoholic fatty liver disease | ||
| Oral Cavity | 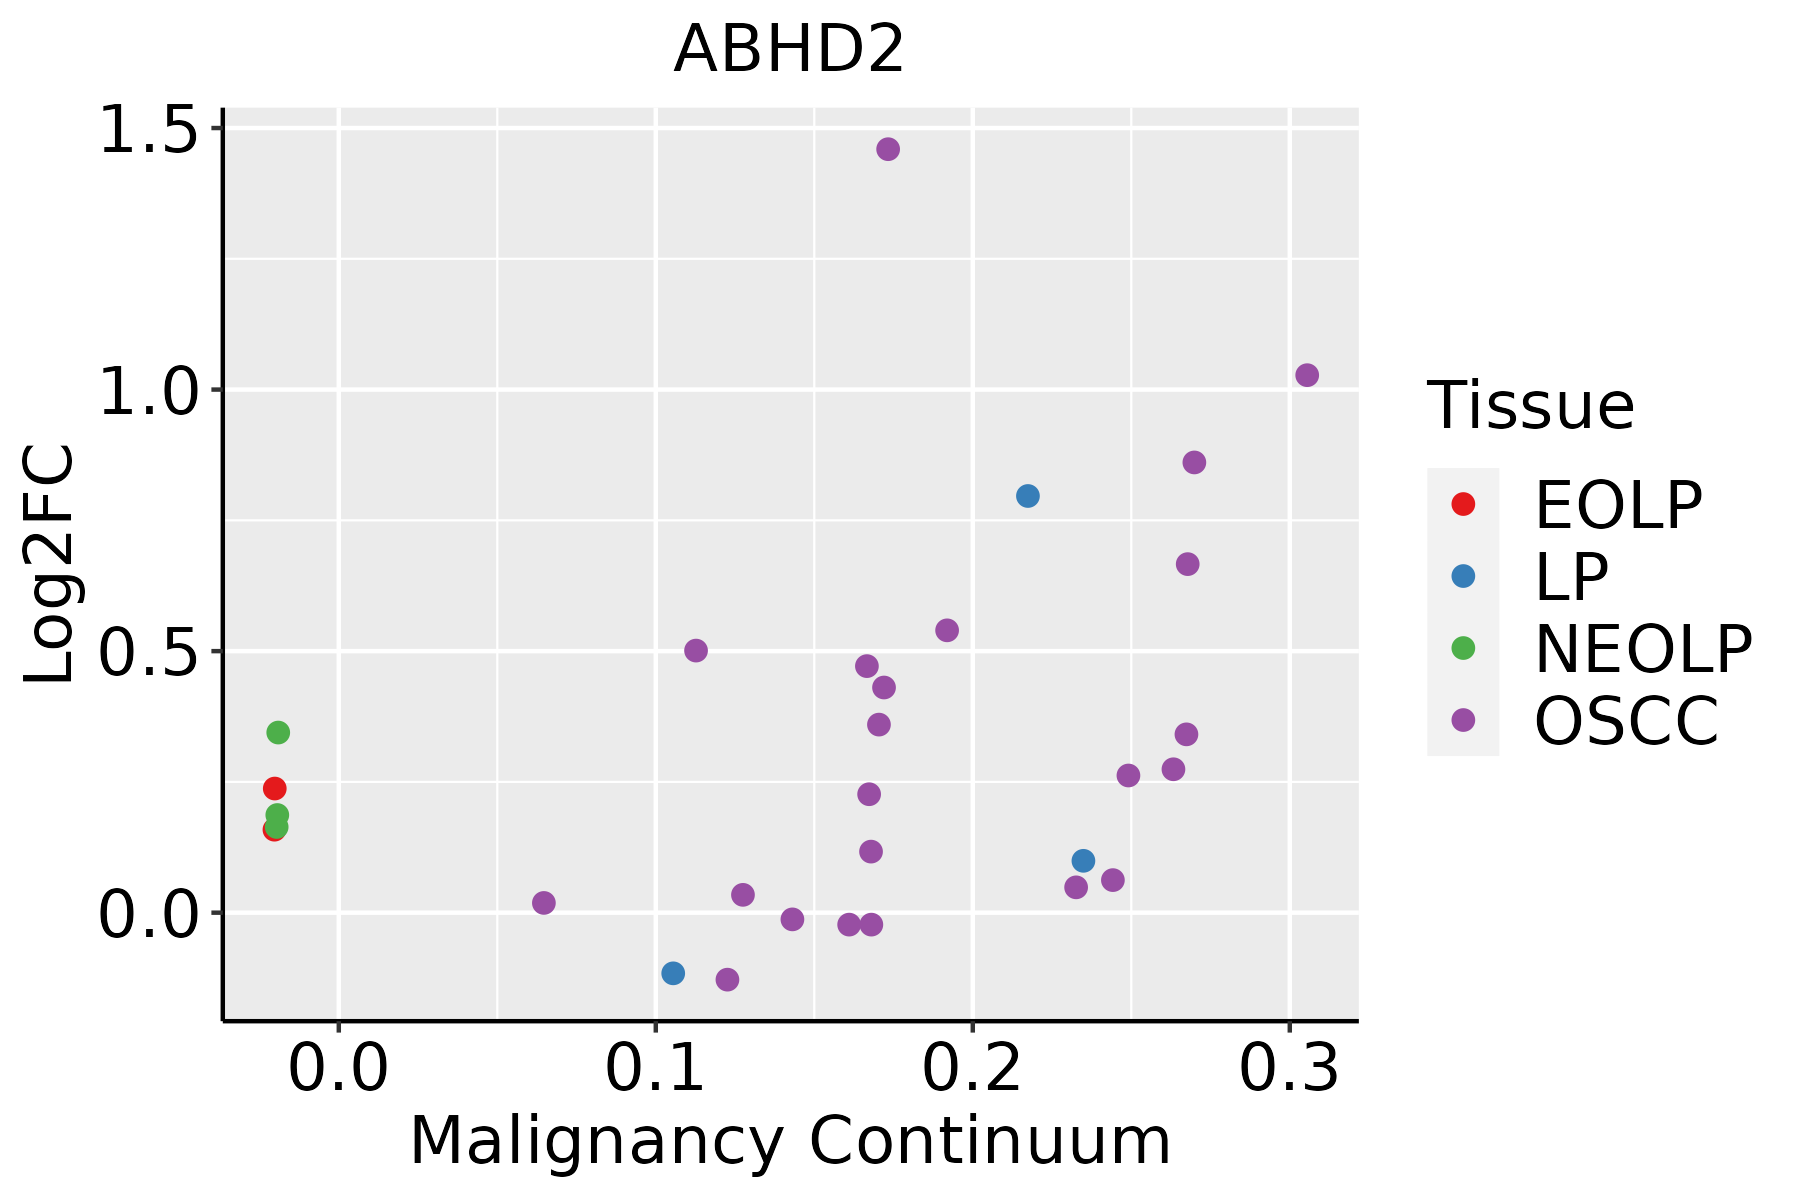 | EOLP: Erosive Oral lichen planus |
| LP: leukoplakia | ||
| NEOLP: Non-erosive oral lichen planus | ||
| OSCC: Oral squamous cell carcinoma | ||
| Prostate | 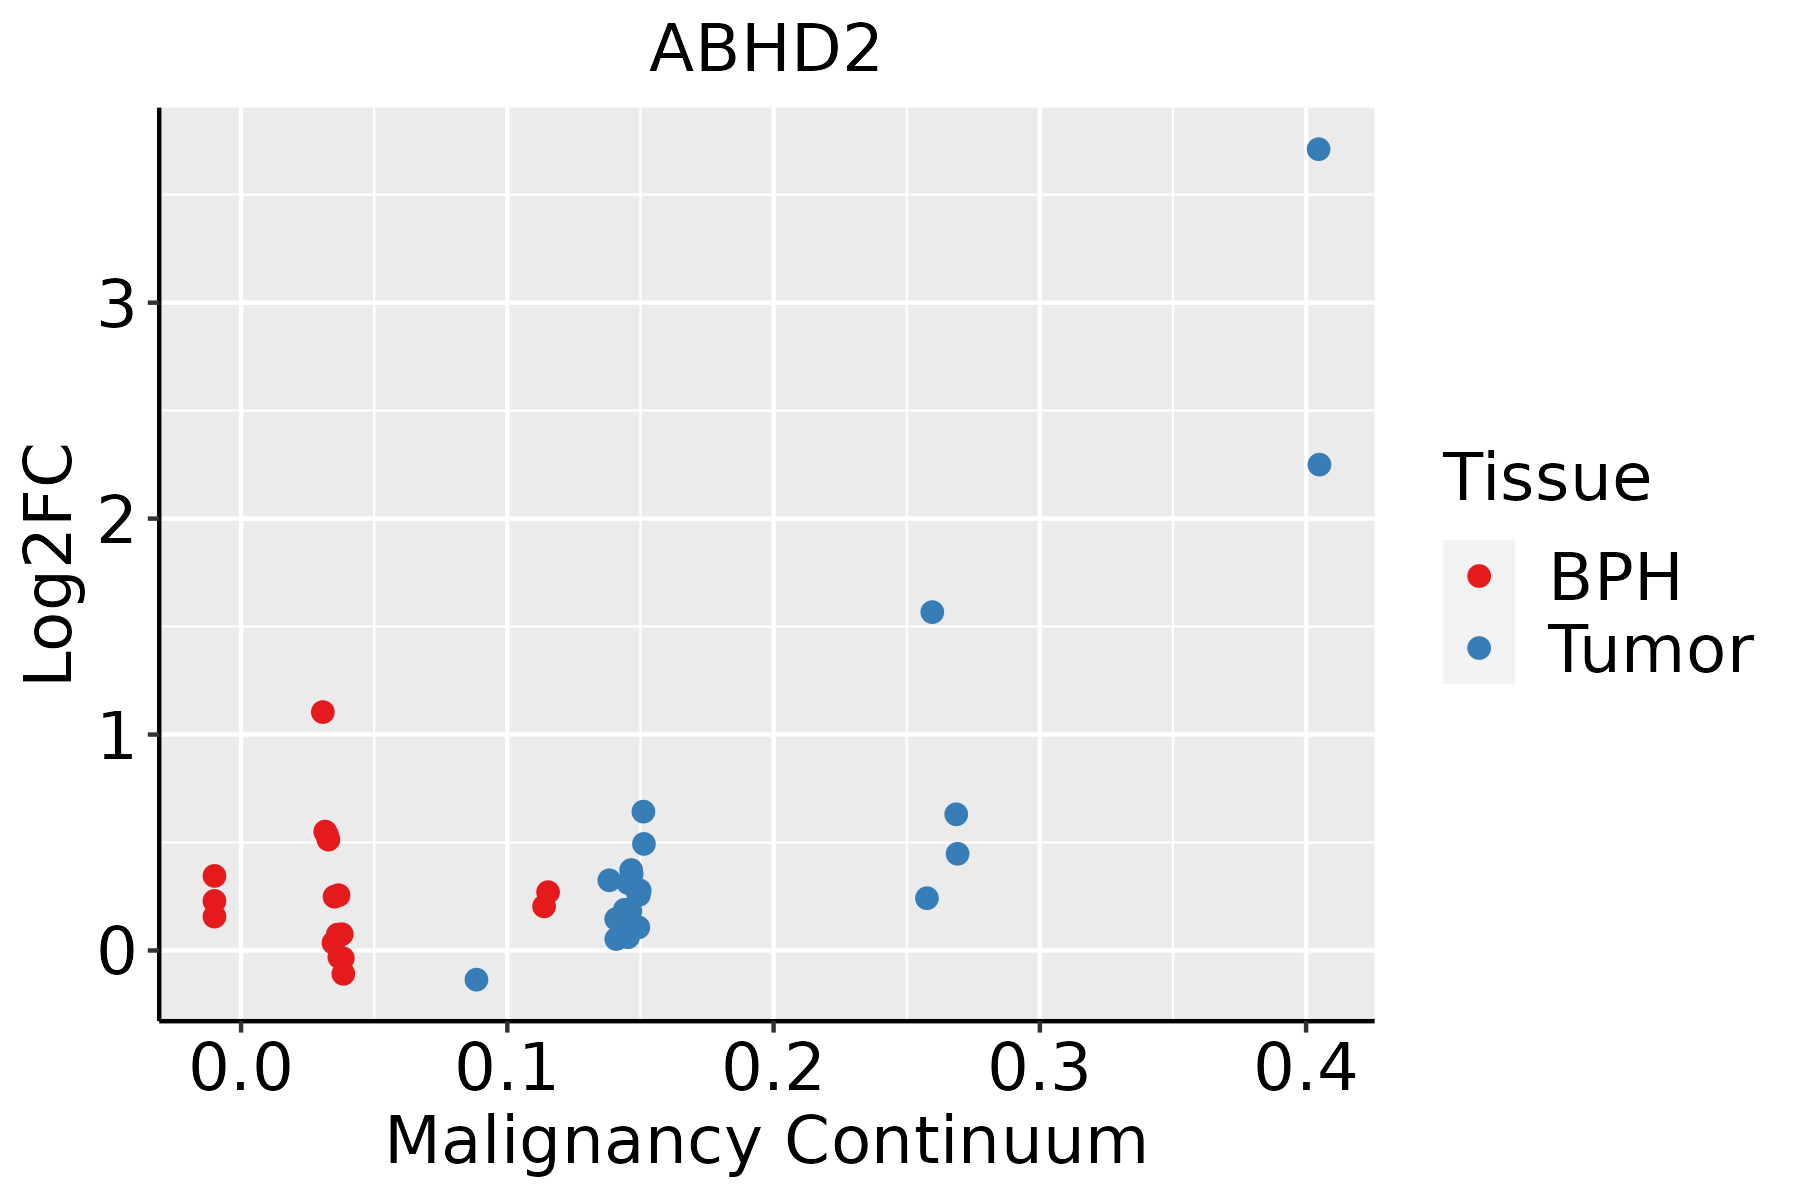 | BPH: Benign Prostatic Hyperplasia |
| Thyroid | 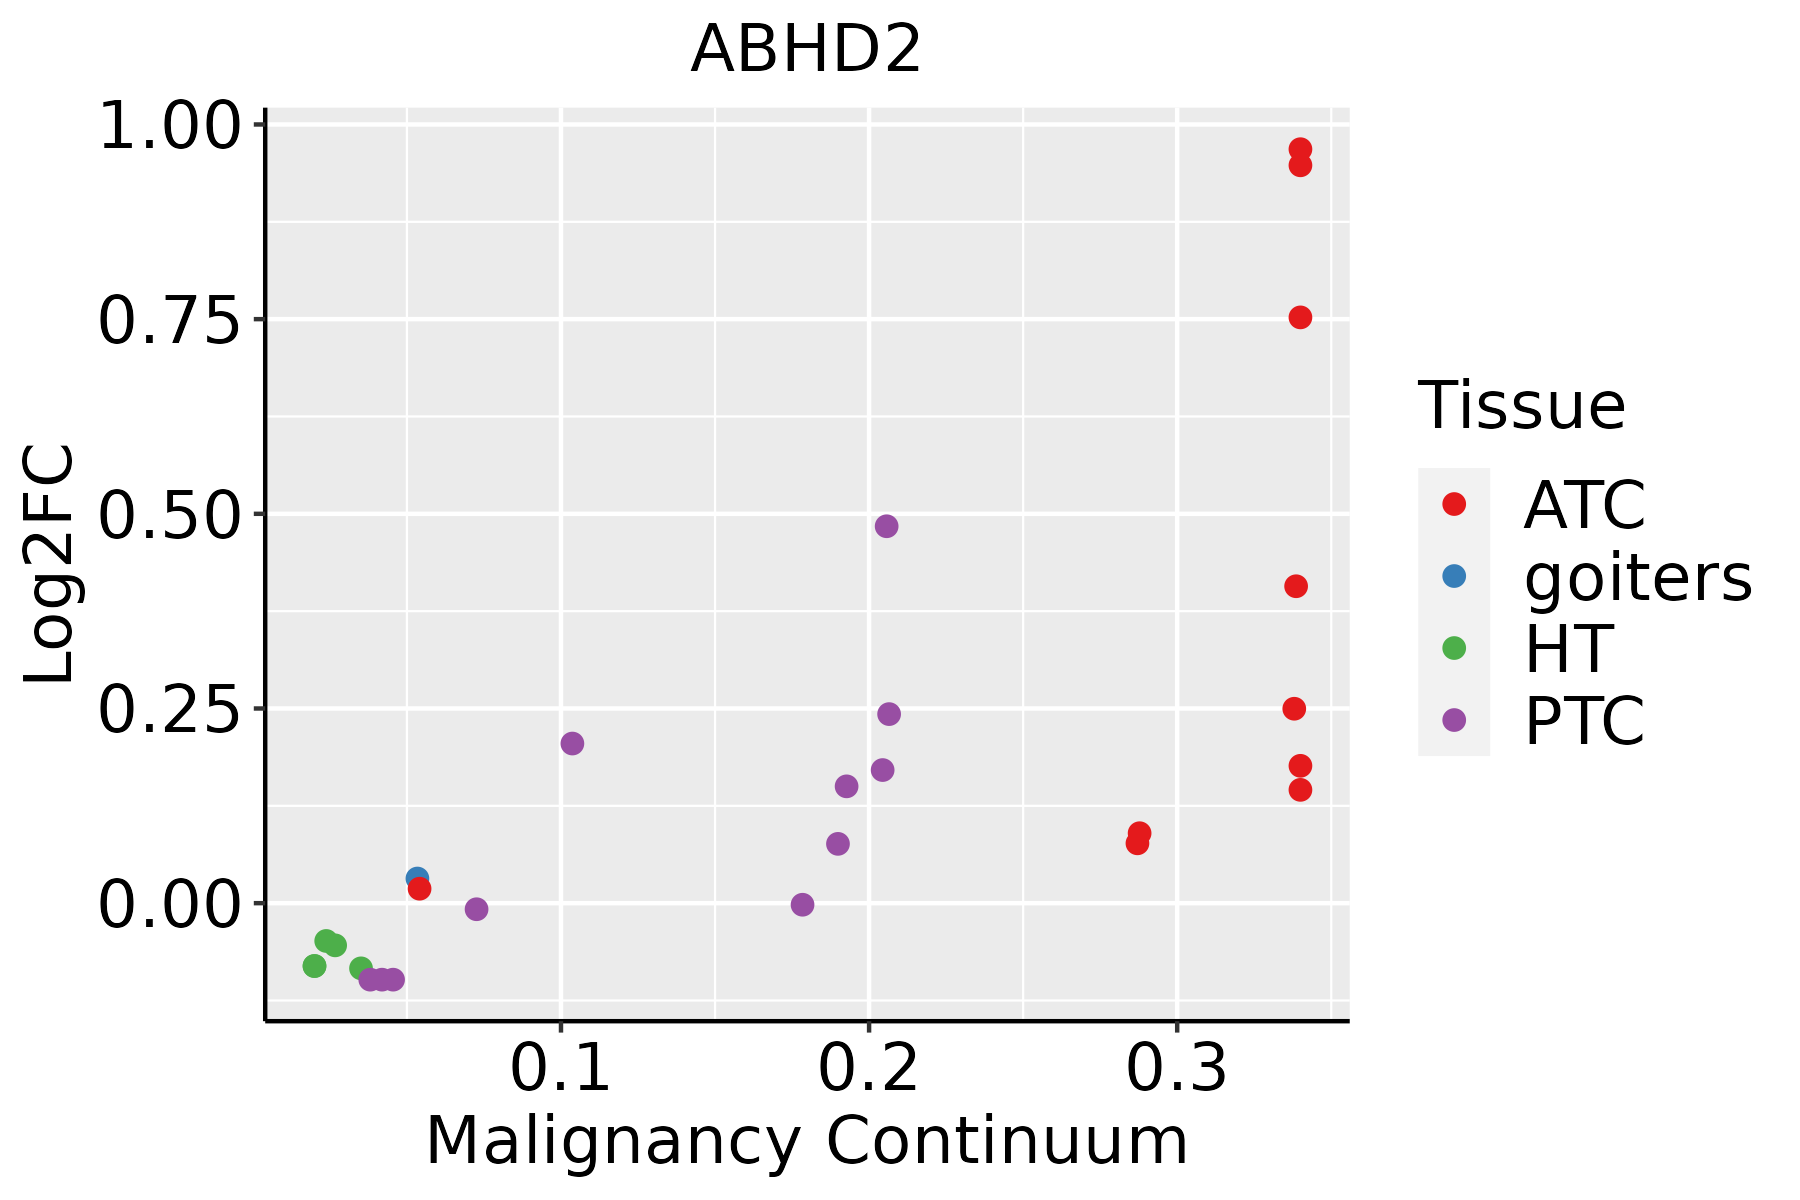 | ATC: Anaplastic thyroid cancer |
| HT: Hashimoto's thyroiditis | ||
| PTC: Papillary thyroid cancer |
| ∗log2FC in expression of this searched gene in stem-like cells from each diseased tissue sample relative to stem-like cells in normal samples in each tissue plotted against the malignancy continuum. Samples are colored based on if they are from different disease stage. |
Top |
Malignant transformation related pathway analysis |
| Find out the enriched GO biological processes and KEGG pathways involved in transition from healthy to precancer to cancer |
| Tissue | Disease Stage | Enriched GO biological Processes |
| Colorectum | AD |  |
| Colorectum | SER |  |
| Colorectum | MSS |  |
| Colorectum | MSI-H |  |
| Colorectum | FAP |  |
| ∗Top 15 enriched GO BP terms are showed in the bar plot of each disease state in each tissue. Each row represents a significant GO biological process which is colored according to the -log10(p.adjust). |
| Page: 1 2 3 4 5 6 7 8 9 |
| GO ID | Tissue | Disease Stage | Description | Gene Ratio | Bg Ratio | pvalue | p.adjust | Count |
| GO:0071383 | Colorectum | AD | cellular response to steroid hormone stimulus | 73/3918 | 204/18723 | 6.31e-07 | 2.24e-05 | 73 |
| GO:0044282 | Colorectum | AD | small molecule catabolic process | 118/3918 | 376/18723 | 1.05e-06 | 3.55e-05 | 118 |
| GO:0009062 | Colorectum | AD | fatty acid catabolic process | 41/3918 | 100/18723 | 4.02e-06 | 1.09e-04 | 41 |
| GO:0043401 | Colorectum | AD | steroid hormone mediated signaling pathway | 51/3918 | 136/18723 | 6.52e-06 | 1.63e-04 | 51 |
| GO:0048545 | Colorectum | AD | response to steroid hormone | 104/3918 | 339/18723 | 1.33e-05 | 2.90e-04 | 104 |
| GO:0009755 | Colorectum | AD | hormone-mediated signaling pathway | 64/3918 | 190/18723 | 2.78e-05 | 5.24e-04 | 64 |
| GO:0016042 | Colorectum | AD | lipid catabolic process | 97/3918 | 320/18723 | 4.31e-05 | 7.56e-04 | 97 |
| GO:0006631 | Colorectum | AD | fatty acid metabolic process | 114/3918 | 390/18723 | 5.58e-05 | 9.44e-04 | 114 |
| GO:0072329 | Colorectum | AD | monocarboxylic acid catabolic process | 44/3918 | 122/18723 | 8.05e-05 | 1.28e-03 | 44 |
| GO:0016054 | Colorectum | AD | organic acid catabolic process | 73/3918 | 240/18723 | 3.20e-04 | 3.81e-03 | 73 |
| GO:0044242 | Colorectum | AD | cellular lipid catabolic process | 66/3918 | 214/18723 | 3.96e-04 | 4.50e-03 | 66 |
| GO:0046395 | Colorectum | AD | carboxylic acid catabolic process | 70/3918 | 236/18723 | 9.06e-04 | 8.71e-03 | 70 |
| GO:1901654 | Colorectum | AD | response to ketone | 59/3918 | 194/18723 | 1.14e-03 | 1.04e-02 | 59 |
| GO:00713831 | Colorectum | SER | cellular response to steroid hormone stimulus | 55/2897 | 204/18723 | 1.66e-05 | 5.05e-04 | 55 |
| GO:00160421 | Colorectum | SER | lipid catabolic process | 77/2897 | 320/18723 | 3.52e-05 | 9.18e-04 | 77 |
| GO:00485451 | Colorectum | SER | response to steroid hormone | 80/2897 | 339/18723 | 5.15e-05 | 1.25e-03 | 80 |
| GO:00442821 | Colorectum | SER | small molecule catabolic process | 87/2897 | 376/18723 | 5.31e-05 | 1.27e-03 | 87 |
| GO:00090621 | Colorectum | SER | fatty acid catabolic process | 31/2897 | 100/18723 | 7.09e-05 | 1.61e-03 | 31 |
| GO:00434011 | Colorectum | SER | steroid hormone mediated signaling pathway | 38/2897 | 136/18723 | 1.42e-04 | 2.82e-03 | 38 |
| GO:00097551 | Colorectum | SER | hormone-mediated signaling pathway | 49/2897 | 190/18723 | 1.54e-04 | 3.00e-03 | 49 |
| Page: 1 2 3 4 5 6 7 8 9 10 11 |
| Pathway ID | Tissue | Disease Stage | Description | Gene Ratio | Bg Ratio | pvalue | p.adjust | qvalue | Count |
| Page: 1 |
Top |
Cell-cell communication analysis |
| Identification of potential cell-cell interactions between two cell types and their ligand-receptor pairs for different disease states |
| Ligand | Receptor | LRpair | Pathway | Tissue | Disease Stage |
| Page: 1 |
Top |
Single-cell gene regulatory network inference analysis |
| Find out the significant the regulons (TFs) and the target genes of each regulon across cell types for different disease states |
| TF | Cell Type | Tissue | Disease Stage | Target Gene | RSS | Regulon Activity |
| ∗The dot plots of a searched regulon are shown for all cell subpopulations in each disease state of each tissue based on the regulon specific score inferred using pySCENIC and by calculating the average expression. |
| Page: 1 |
Top |
Somatic mutation of malignant transformation related genes |
| Annotation of somatic variants for genes involved in malignant transformation |
| Hugo Symbol | Variant Class | Variant Classification | dbSNP RS | HGVSc | HGVSp | HGVSp Short | SWISSPROT | BIOTYPE | SIFT | PolyPhen | Tumor Sample Barcode | Tissue | Histology | Sex | Age | Stage | Therapy Types | Drugs | Outcome |
| ABHD2 | SNV | Missense_Mutation | rs777916601 | c.134A>G | p.Tyr45Cys | p.Y45C | P08910 | protein_coding | tolerated(0.07) | possibly_damaging(0.599) | TCGA-A2-A1FW-01 | Breast | breast invasive carcinoma | Female | <65 | III/IV | Chemotherapy | cytoxan | SD |
| ABHD2 | SNV | Missense_Mutation | novel | c.848N>T | p.Pro283Leu | p.P283L | P08910 | protein_coding | tolerated(0.28) | benign(0.033) | TCGA-B6-A0X1-01 | Breast | breast invasive carcinoma | Female | <65 | I/II | Unknown | Unknown | PD |
| ABHD2 | SNV | Missense_Mutation | c.389N>A | p.Ile130Asn | p.I130N | P08910 | protein_coding | deleterious(0) | possibly_damaging(0.823) | TCGA-BH-A0BT-01 | Breast | breast invasive carcinoma | Female | <65 | I/II | Chemotherapy | adriamycin | CR | |
| ABHD2 | SNV | Missense_Mutation | c.482N>G | p.Asn161Ser | p.N161S | P08910 | protein_coding | deleterious(0.03) | possibly_damaging(0.864) | TCGA-D8-A1XK-01 | Breast | breast invasive carcinoma | Female | <65 | I/II | Chemotherapy | doxorubicine+cyclophosphamide | SD | |
| ABHD2 | SNV | Missense_Mutation | c.843N>C | p.Lys281Asn | p.K281N | P08910 | protein_coding | tolerated(0.07) | benign(0.135) | TCGA-LL-A5YO-01 | Breast | breast invasive carcinoma | Female | <65 | I/II | Chemotherapy | taxotere | CR | |
| ABHD2 | SNV | Missense_Mutation | c.751N>G | p.Gln251Glu | p.Q251E | P08910 | protein_coding | deleterious(0.04) | benign(0.005) | TCGA-JW-A5VL-01 | Cervix | cervical & endocervical cancer | Female | <65 | I/II | Unknown | Unknown | SD | |
| ABHD2 | SNV | Missense_Mutation | novel | c.551N>G | p.Glu184Gly | p.E184G | P08910 | protein_coding | deleterious(0) | possibly_damaging(0.9) | TCGA-AD-6889-01 | Colorectum | colon adenocarcinoma | Male | >=65 | I/II | Chemotherapy | xeloda | PD |
| ABHD2 | SNV | Missense_Mutation | c.476T>C | p.Val159Ala | p.V159A | P08910 | protein_coding | deleterious(0.03) | benign(0.142) | TCGA-AD-6964-01 | Colorectum | colon adenocarcinoma | Male | <65 | III/IV | Chemotherapy | folfox | PD | |
| ABHD2 | SNV | Missense_Mutation | novel | c.1061C>T | p.Thr354Ile | p.T354I | P08910 | protein_coding | tolerated(0.2) | benign(0.003) | TCGA-CK-4951-01 | Colorectum | colon adenocarcinoma | Female | >=65 | I/II | Unknown | Unknown | PD |
| ABHD2 | SNV | Missense_Mutation | rs150079355 | c.697N>A | p.Val233Met | p.V233M | P08910 | protein_coding | tolerated(0.06) | benign(0.21) | TCGA-CM-4746-01 | Colorectum | colon adenocarcinoma | Male | <65 | I/II | Unknown | Unknown | SD |
| Page: 1 2 3 4 5 |
Top |
Related drugs of malignant transformation related genes |
| Identification of chemicals and drugs interact with genes involved in malignant transfromation |
| (DGIdb 4.0) |
| Entrez ID | Symbol | Category | Interaction Types | Drug Claim Name | Drug Name | PMIDs |
| Page: 1 |

Copyright 2023-Present -The University of Texas Health Science Center at Houston |