
|
|||||
|
 | |
| |
| |
| |
| |
| |
|
Gene: ABHD11 |
Gene summary for ABHD11 |
| Gene information | Species | Human | Gene symbol | ABHD11 | Gene ID | 83451 |
| Gene name | abhydrolase domain containing 11 | |
| Gene Alias | PP1226 | |
| Cytomap | 7q11.23 | |
| Gene Type | protein-coding | GO ID | GO:0008150 | UniProtAcc | Q8NFV4 |
Top |
Malignant transformation analysis |
| Identification of the aberrant gene expression in precancerous and cancerous lesions by comparing the gene expression of stem-like cells in diseased tissues with normal stem cells |
| Entrez ID | Symbol | Replicates | Species | Organ | Tissue | Adj P-value | Log2FC | Malignancy |
| 83451 | ABHD11 | P65T-E | Human | Esophagus | ESCC | 1.35e-15 | 5.10e-01 | 0.0978 |
| 83451 | ABHD11 | P74T-E | Human | Esophagus | ESCC | 1.17e-45 | 1.57e+00 | 0.1479 |
| 83451 | ABHD11 | P75T-E | Human | Esophagus | ESCC | 1.28e-67 | 1.71e+00 | 0.1125 |
| 83451 | ABHD11 | P76T-E | Human | Esophagus | ESCC | 5.03e-34 | 6.31e-01 | 0.1207 |
| 83451 | ABHD11 | P79T-E | Human | Esophagus | ESCC | 1.10e-22 | 5.32e-01 | 0.1154 |
| 83451 | ABHD11 | P80T-E | Human | Esophagus | ESCC | 1.55e-40 | 1.27e+00 | 0.155 |
| 83451 | ABHD11 | P82T-E | Human | Esophagus | ESCC | 7.21e-34 | 1.79e+00 | 0.1072 |
| 83451 | ABHD11 | P83T-E | Human | Esophagus | ESCC | 1.01e-37 | 1.28e+00 | 0.1738 |
| 83451 | ABHD11 | P84T-E | Human | Esophagus | ESCC | 2.10e-10 | 1.08e+00 | 0.0933 |
| 83451 | ABHD11 | P89T-E | Human | Esophagus | ESCC | 2.74e-19 | 1.20e+00 | 0.1752 |
| 83451 | ABHD11 | P91T-E | Human | Esophagus | ESCC | 7.53e-07 | 8.62e-01 | 0.1828 |
| 83451 | ABHD11 | P94T-E | Human | Esophagus | ESCC | 5.02e-05 | 1.52e+00 | 0.0879 |
| 83451 | ABHD11 | P104T-E | Human | Esophagus | ESCC | 4.48e-04 | 8.69e-01 | 0.0931 |
| 83451 | ABHD11 | P107T-E | Human | Esophagus | ESCC | 2.81e-39 | 9.21e-01 | 0.171 |
| 83451 | ABHD11 | P127T-E | Human | Esophagus | ESCC | 2.35e-13 | 3.92e-01 | 0.0826 |
| 83451 | ABHD11 | P128T-E | Human | Esophagus | ESCC | 9.99e-54 | 2.00e+00 | 0.1241 |
| 83451 | ABHD11 | P130T-E | Human | Esophagus | ESCC | 2.17e-29 | 6.96e-01 | 0.1676 |
| 83451 | ABHD11 | HCC1_Meng | Human | Liver | HCC | 1.64e-24 | -1.25e-01 | 0.0246 |
| 83451 | ABHD11 | HCC2_Meng | Human | Liver | HCC | 1.35e-17 | 1.56e-03 | 0.0107 |
| 83451 | ABHD11 | cirrhotic1 | Human | Liver | Cirrhotic | 1.34e-06 | 2.13e-01 | 0.0202 |
| Page: 1 2 3 4 5 6 |
| Tissue | Expression Dynamics | Abbreviation |
| Breast | 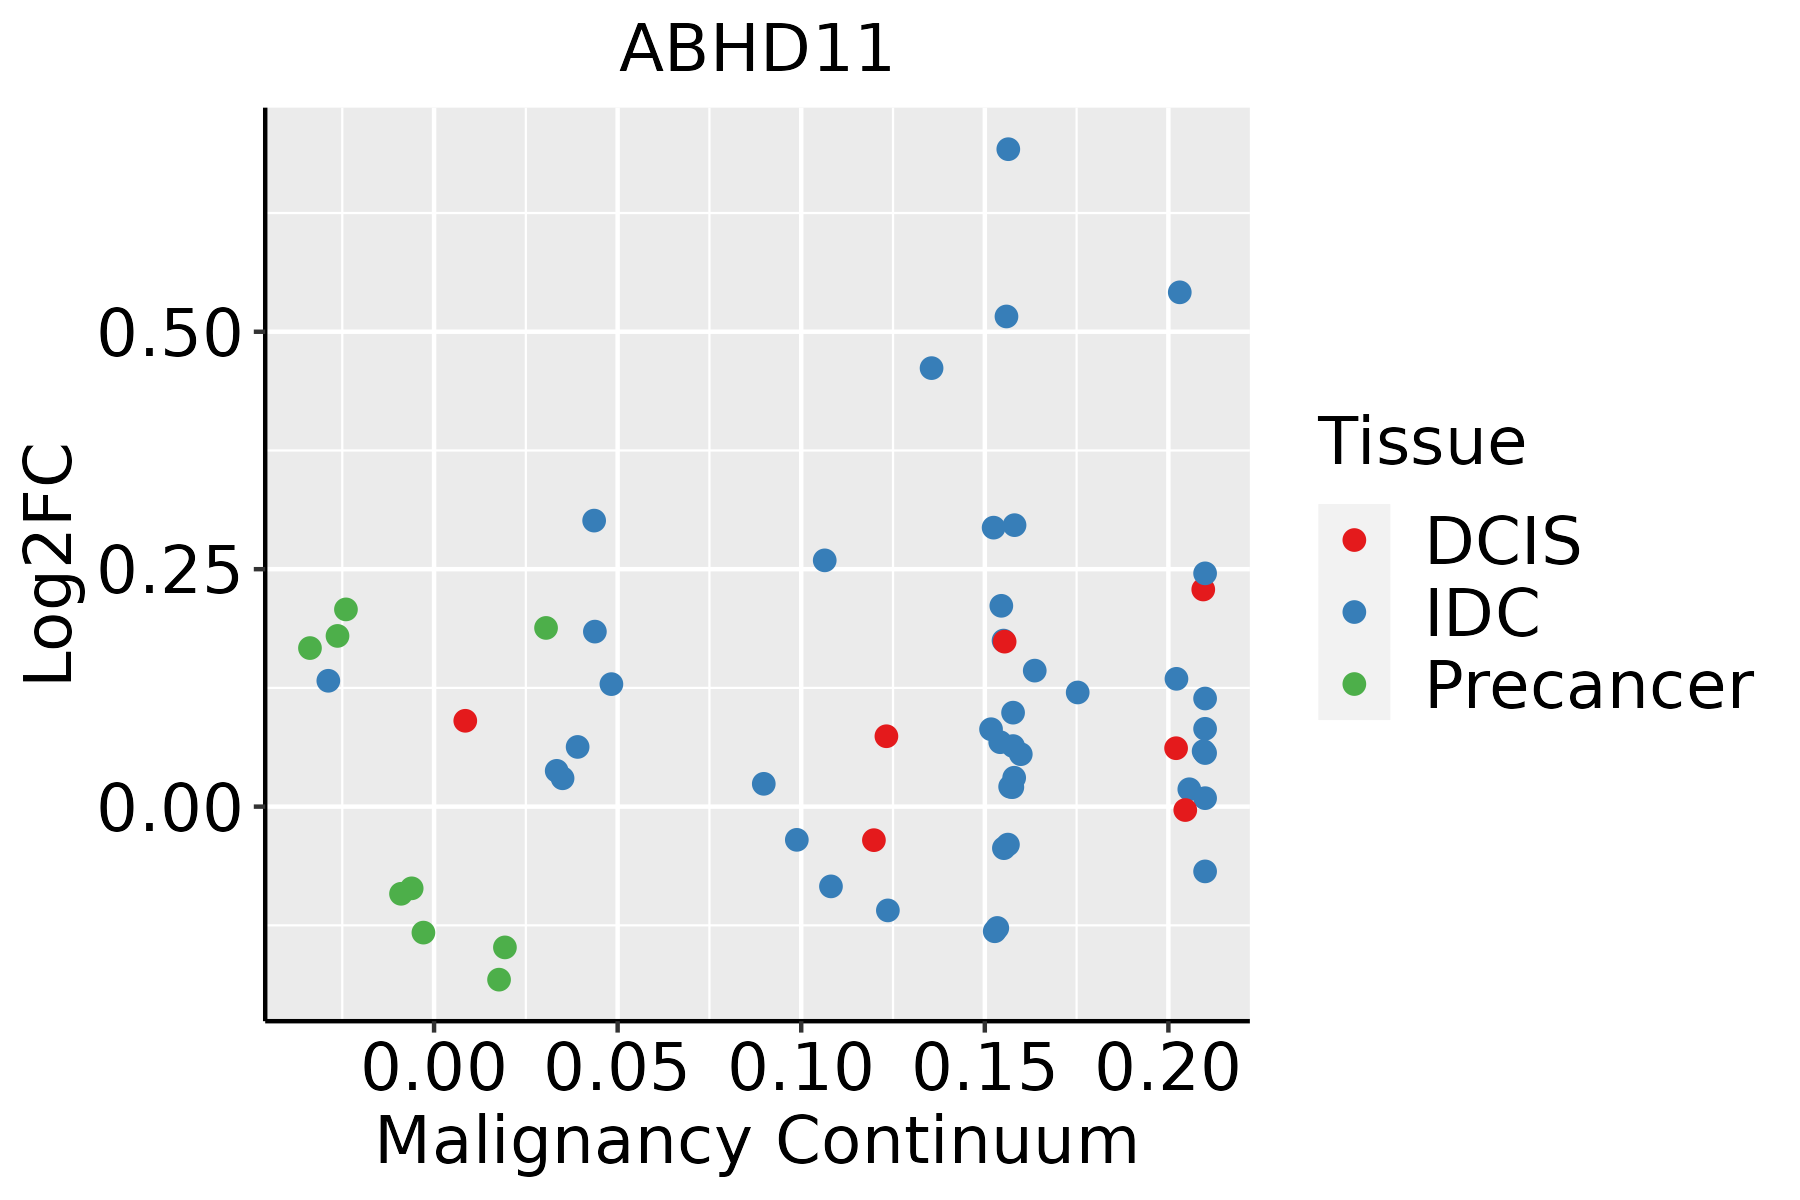 | IDC: Invasive ductal carcinoma |
| DCIS: Ductal carcinoma in situ | ||
| Precancer(BRCA1-mut): Precancerous lesion from BRCA1 mutation carriers | ||
| Esophagus | 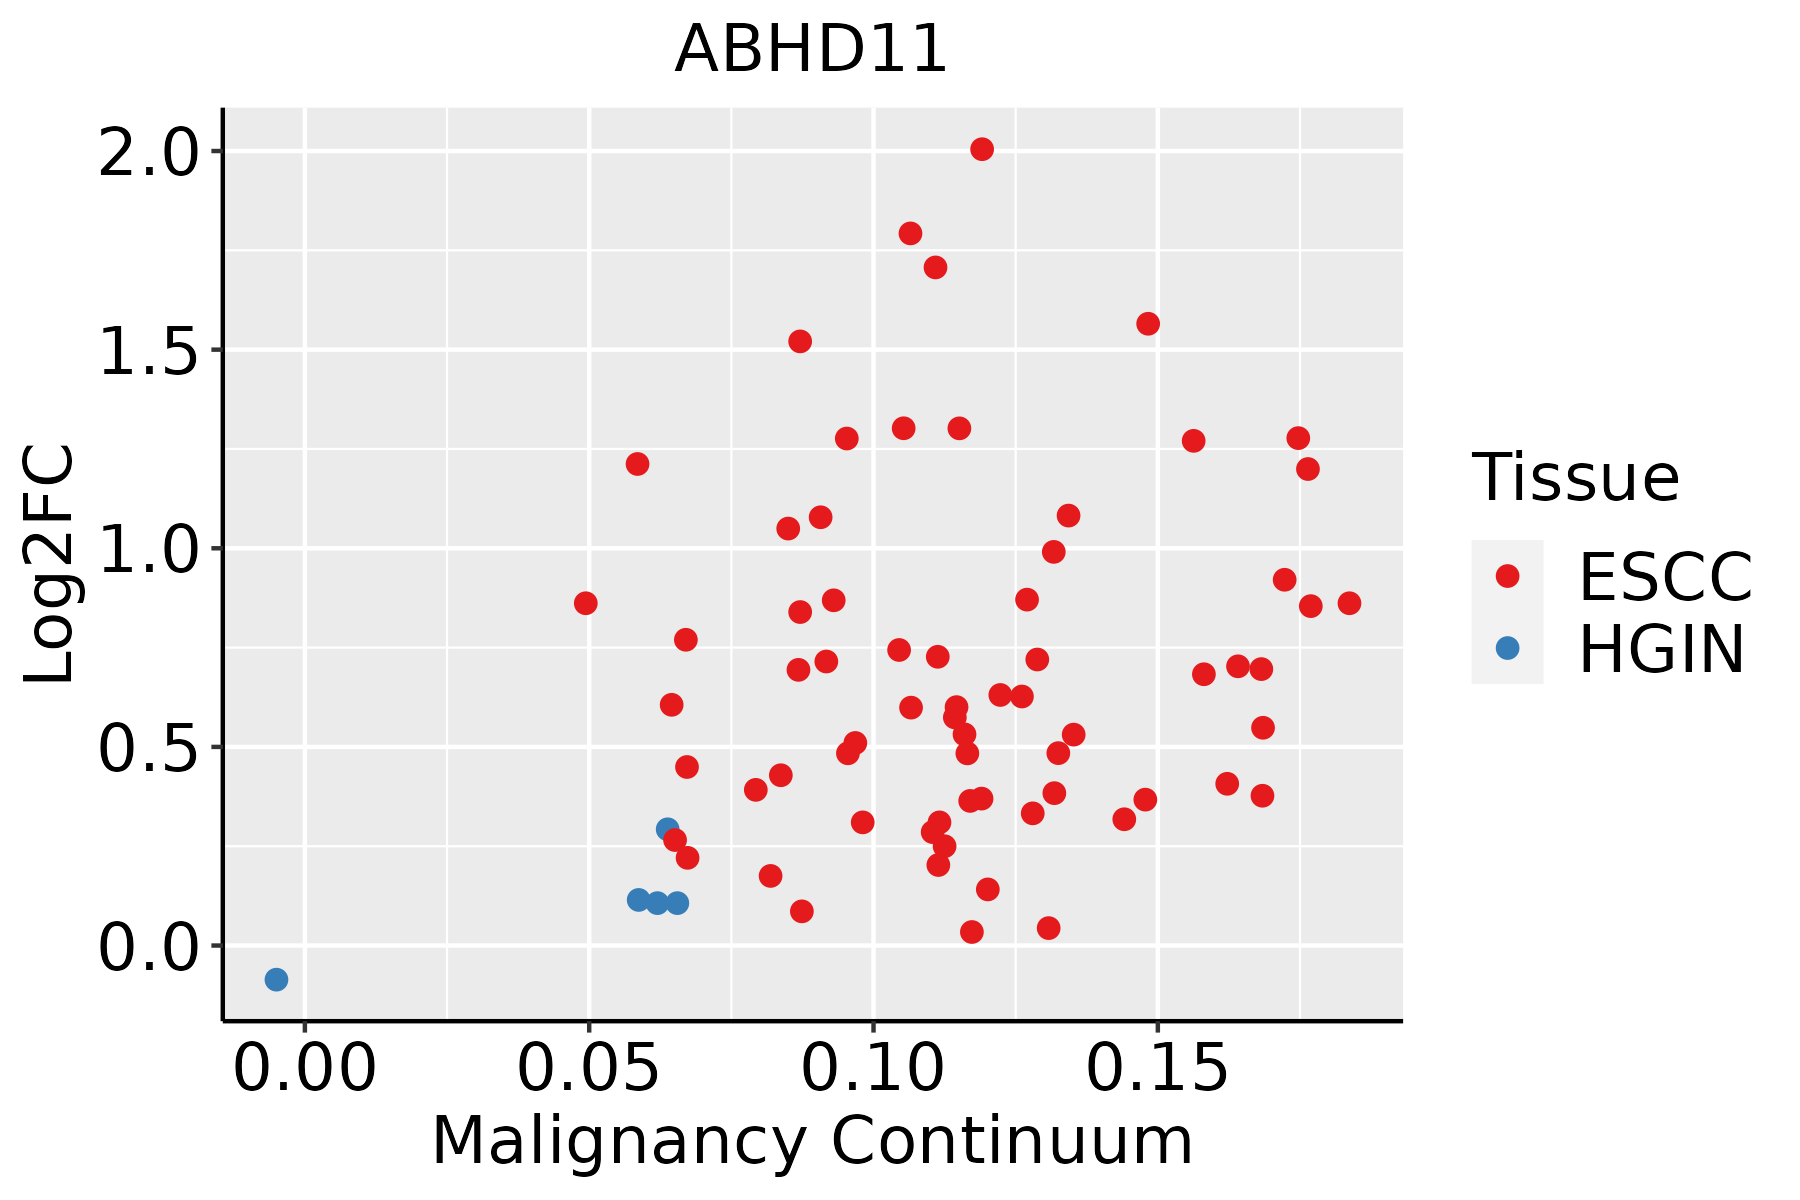 | ESCC: Esophageal squamous cell carcinoma |
| HGIN: High-grade intraepithelial neoplasias | ||
| LGIN: Low-grade intraepithelial neoplasias | ||
| Liver | 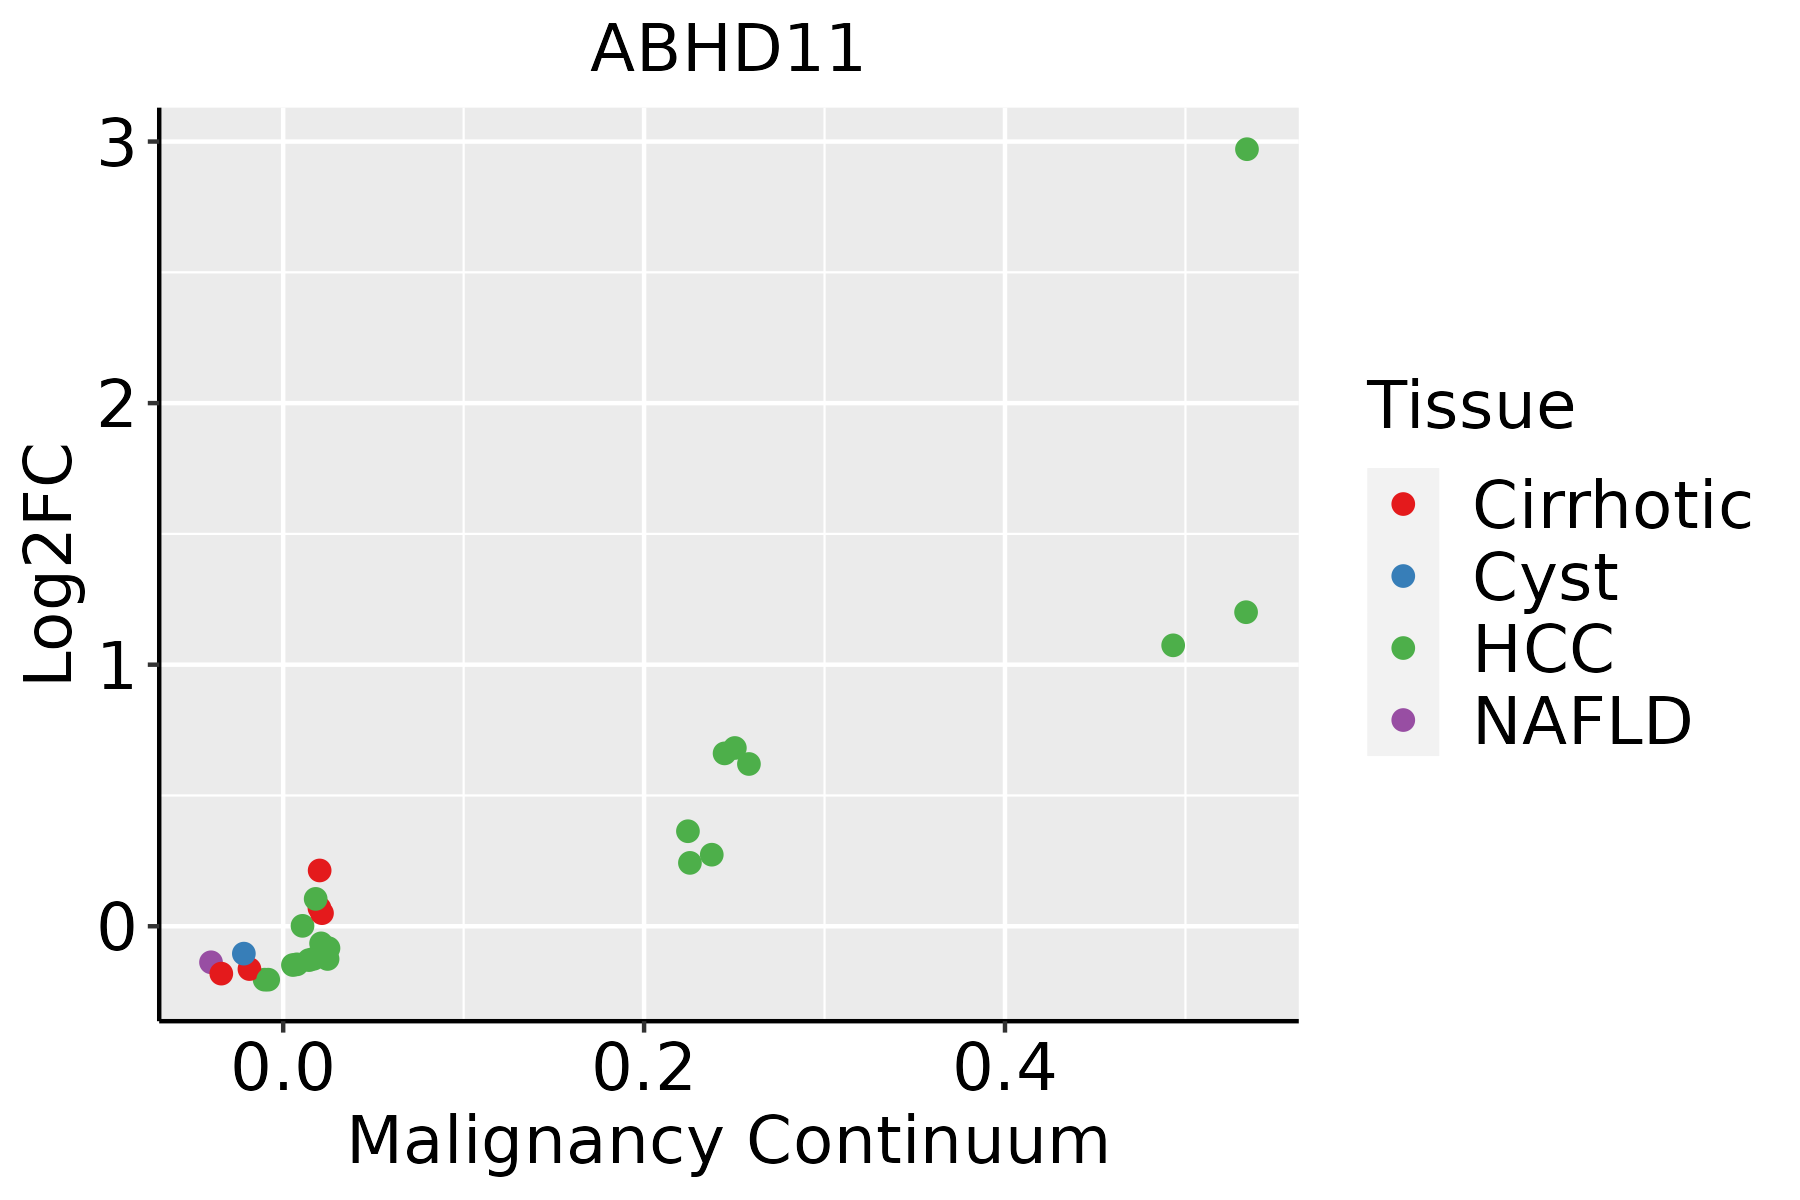 | HCC: Hepatocellular carcinoma |
| NAFLD: Non-alcoholic fatty liver disease | ||
| Oral Cavity | 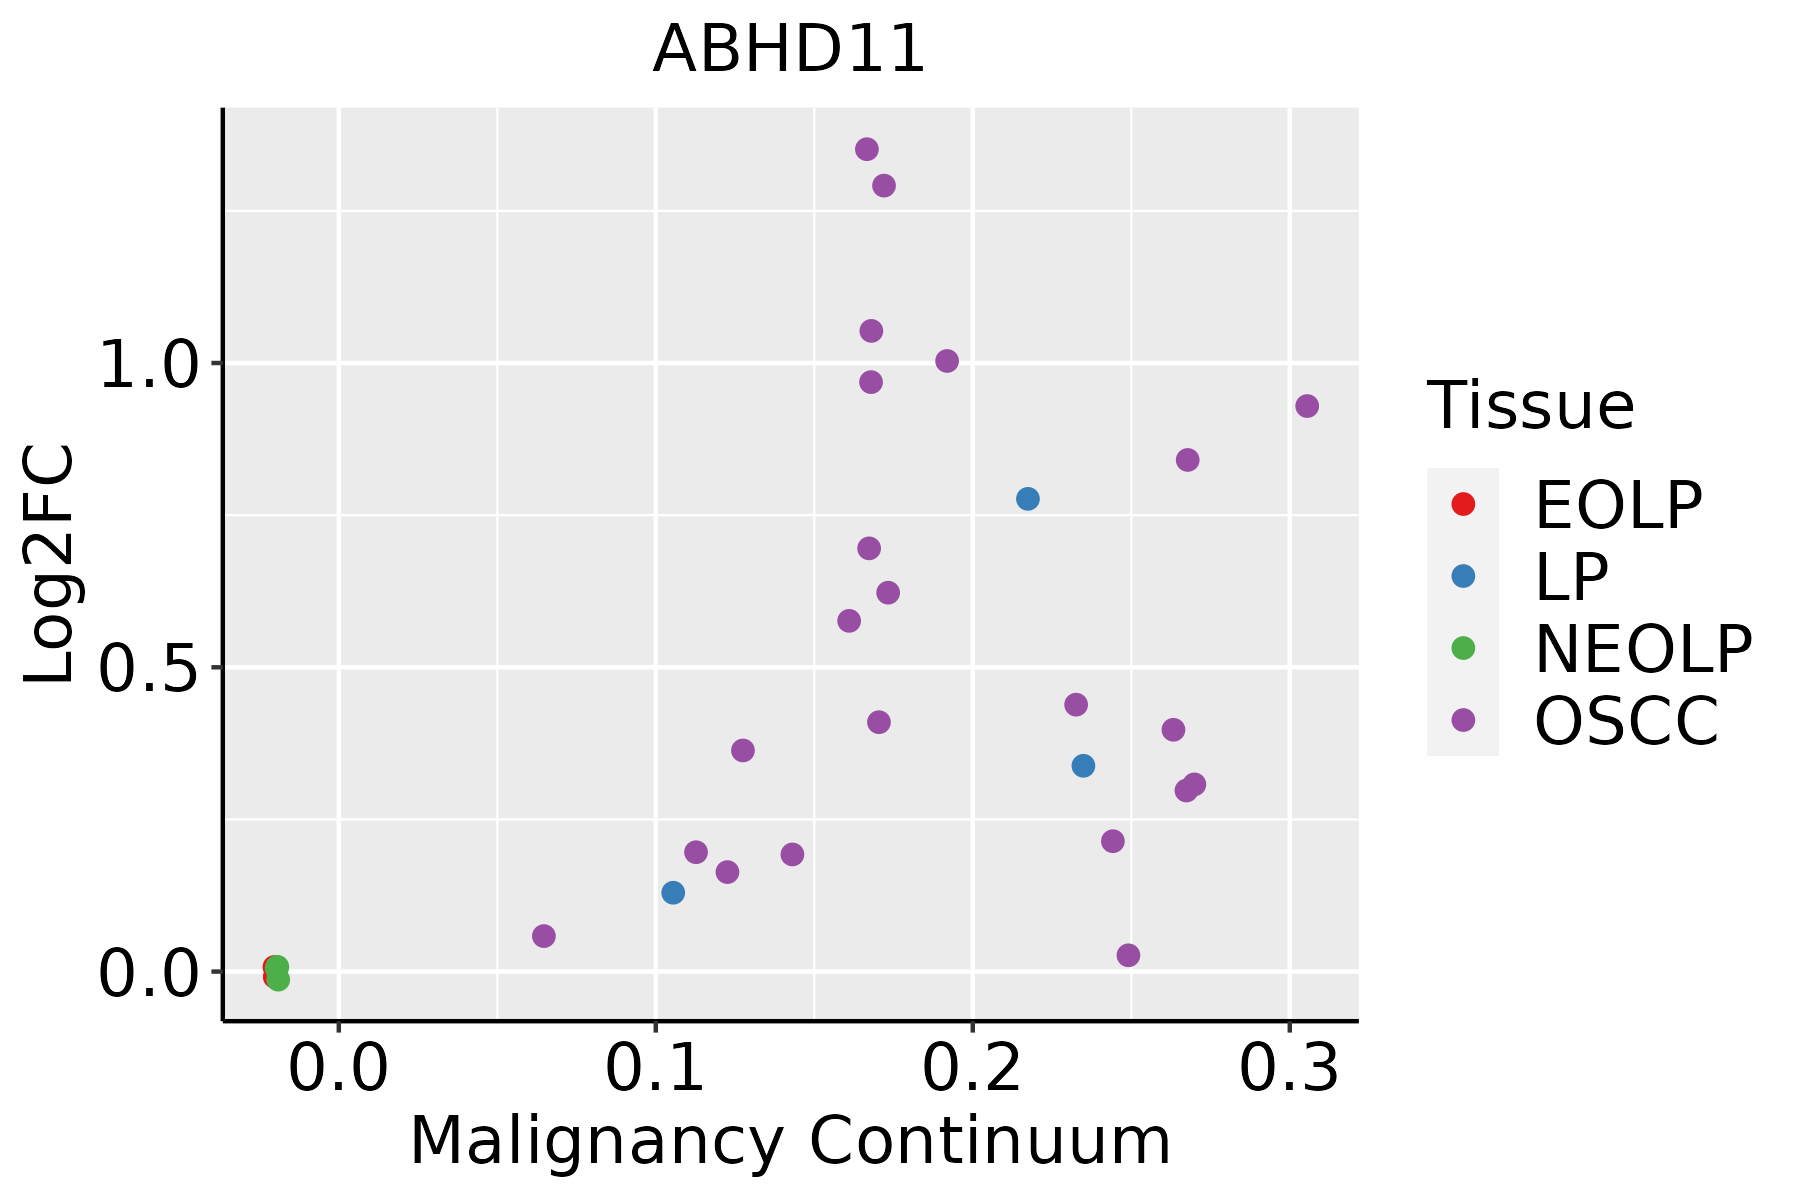 | EOLP: Erosive Oral lichen planus |
| LP: leukoplakia | ||
| NEOLP: Non-erosive oral lichen planus | ||
| OSCC: Oral squamous cell carcinoma | ||
| Prostate | 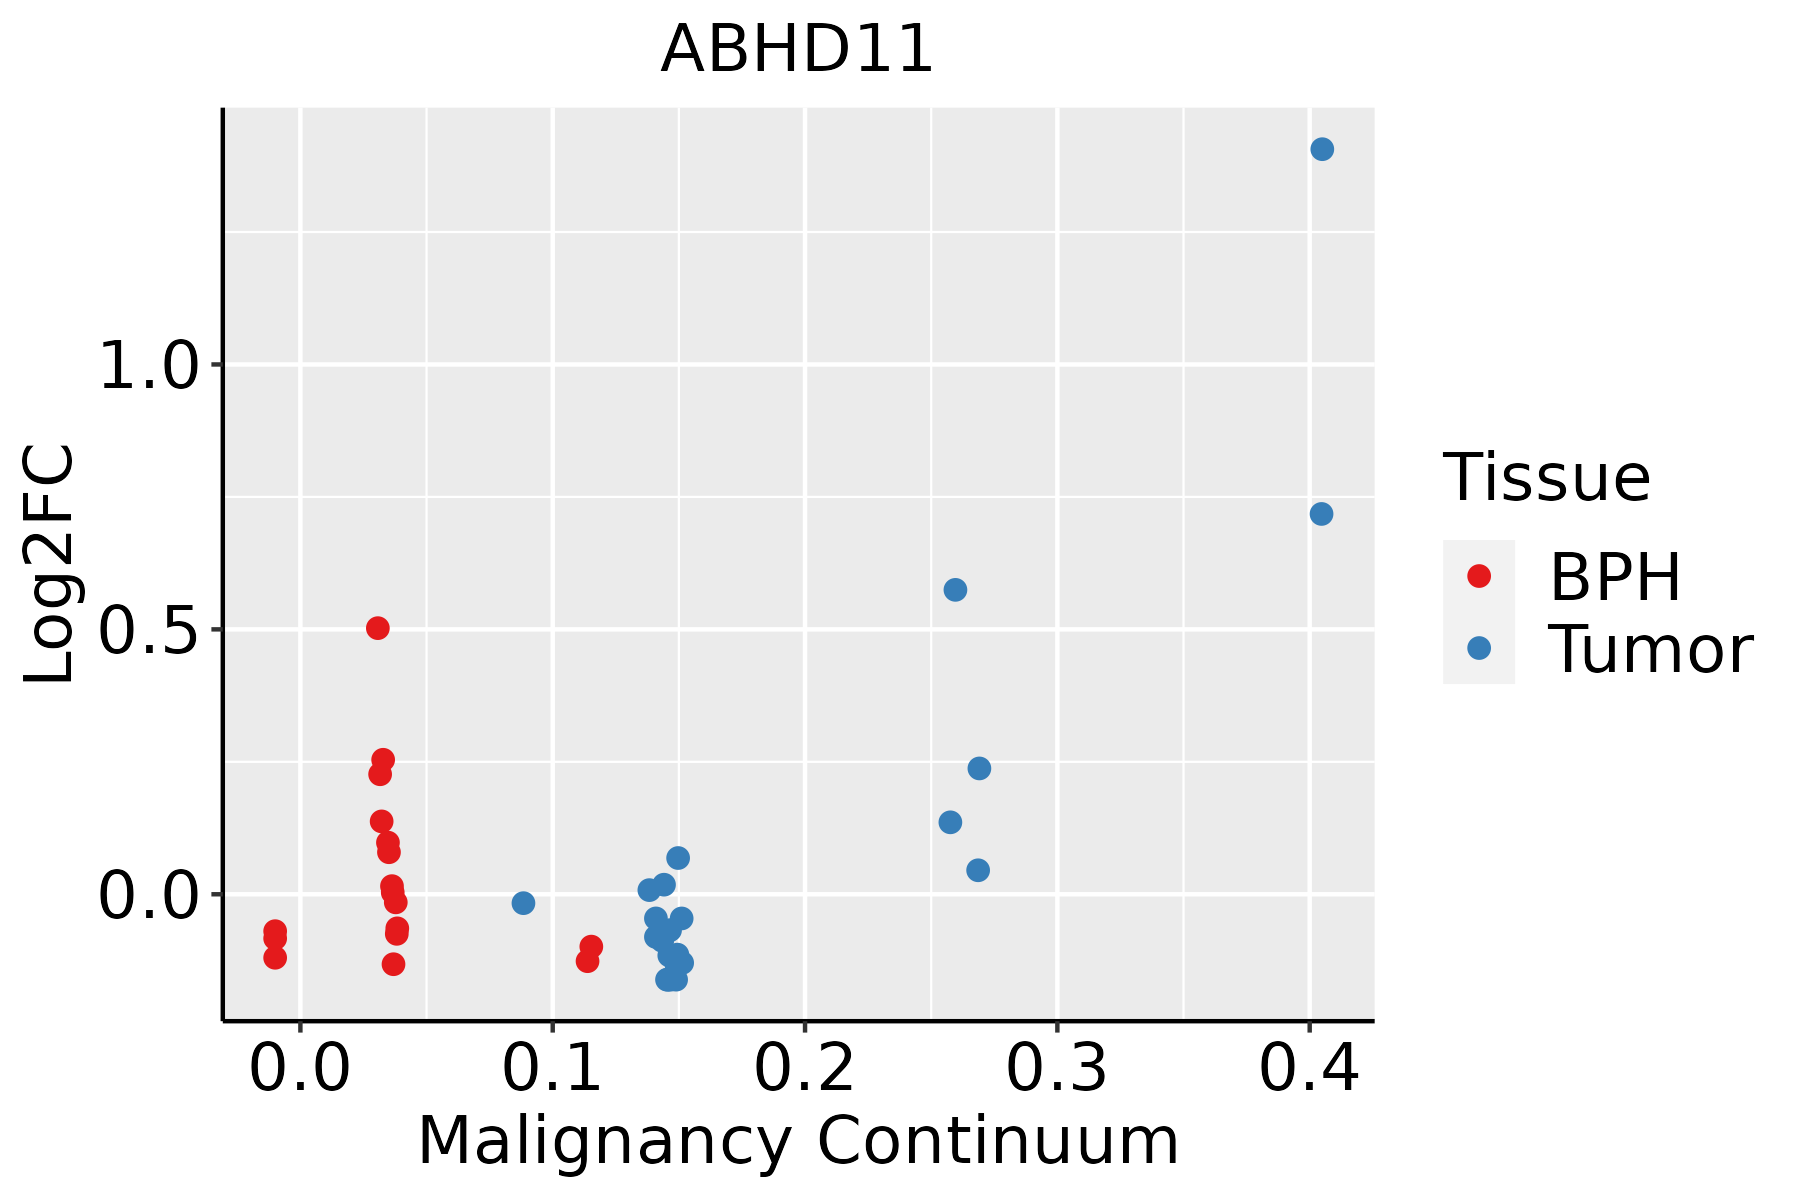 | BPH: Benign Prostatic Hyperplasia |
| Thyroid | 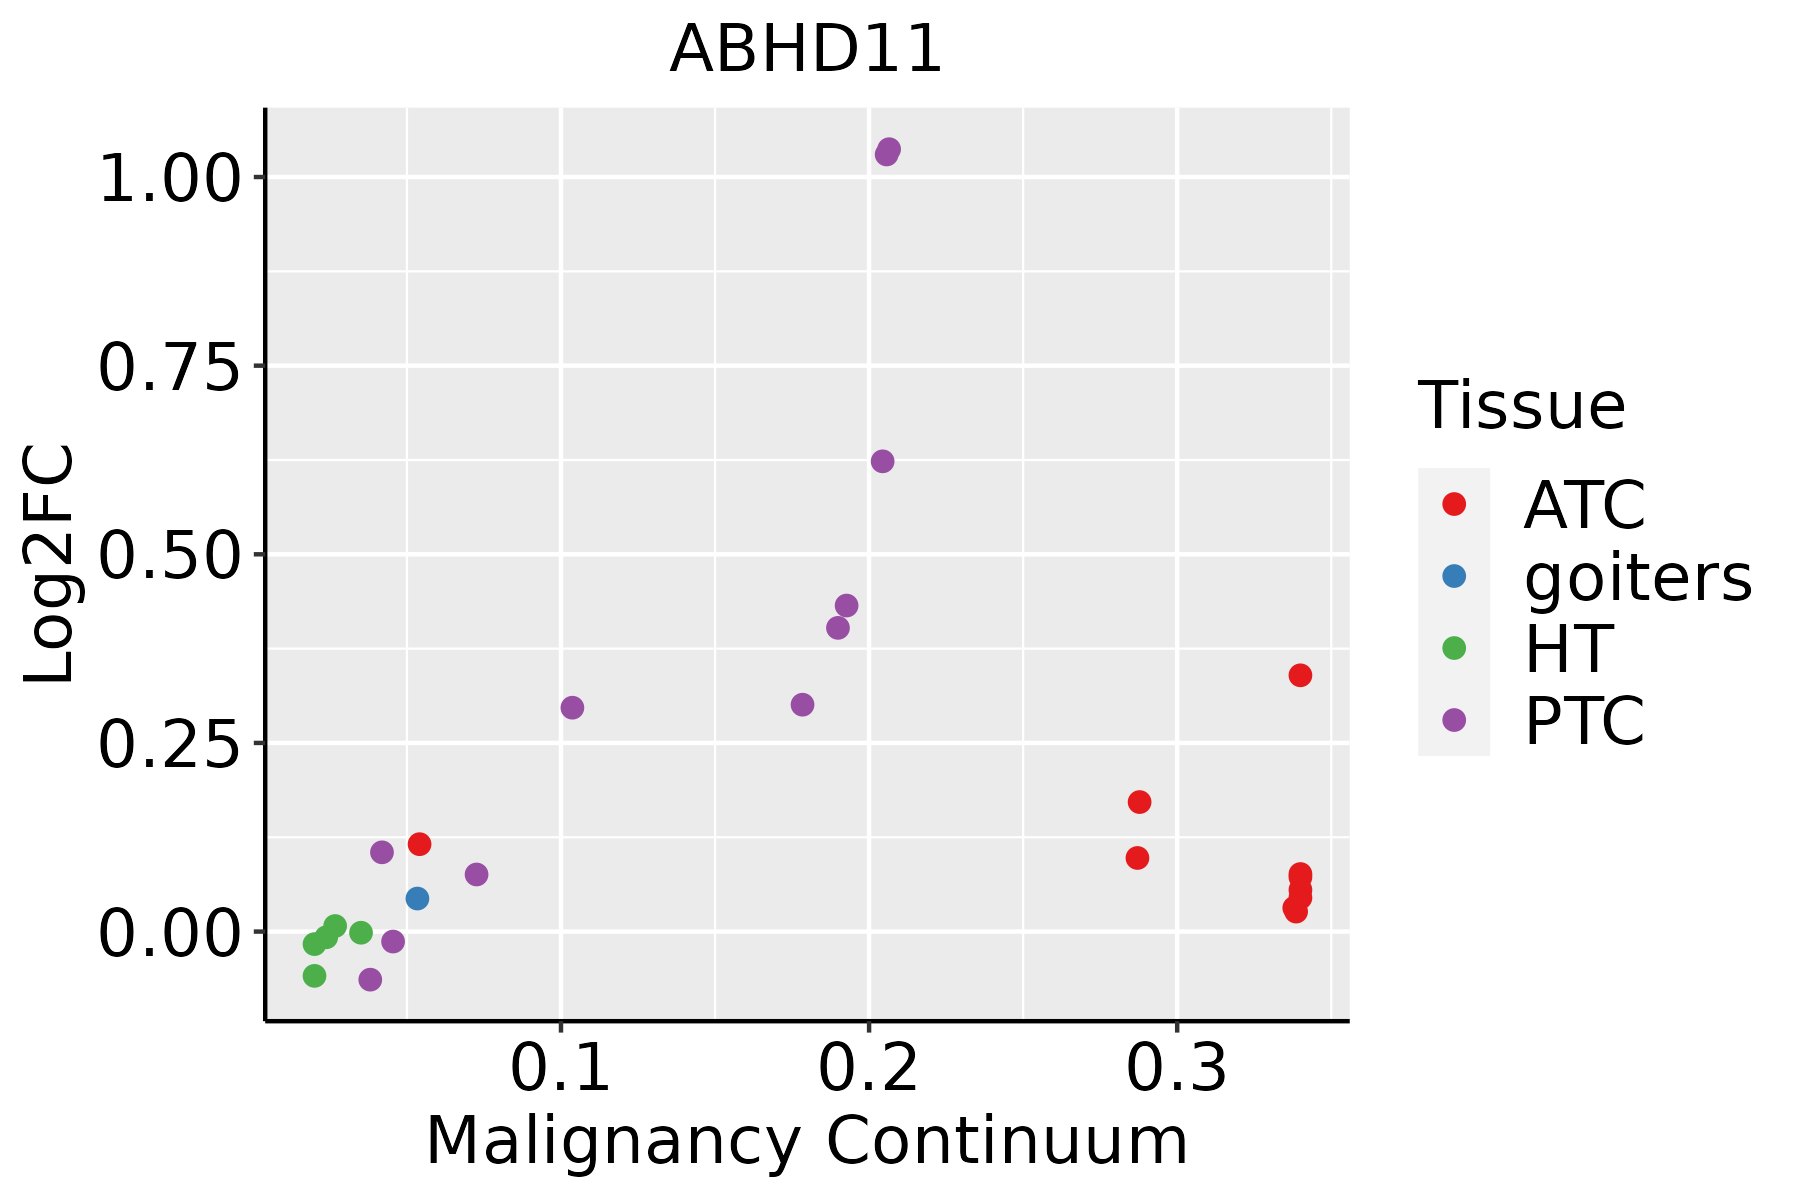 | ATC: Anaplastic thyroid cancer |
| HT: Hashimoto's thyroiditis | ||
| PTC: Papillary thyroid cancer |
| ∗log2FC in expression of this searched gene in stem-like cells from each diseased tissue sample relative to stem-like cells in normal samples in each tissue plotted against the malignancy continuum. Samples are colored based on if they are from different disease stage. |
Top |
Malignant transformation related pathway analysis |
| Find out the enriched GO biological processes and KEGG pathways involved in transition from healthy to precancer to cancer |
| Tissue | Disease Stage | Enriched GO biological Processes |
| Colorectum | AD |  |
| Colorectum | SER |  |
| Colorectum | MSS |  |
| Colorectum | MSI-H |  |
| Colorectum | FAP |  |
| ∗Top 15 enriched GO BP terms are showed in the bar plot of each disease state in each tissue. Each row represents a significant GO biological process which is colored according to the -log10(p.adjust). |
| Page: 1 2 3 4 5 6 7 8 9 |
| GO ID | Tissue | Disease Stage | Description | Gene Ratio | Bg Ratio | pvalue | p.adjust | Count |
| Page: 1 |
| Pathway ID | Tissue | Disease Stage | Description | Gene Ratio | Bg Ratio | pvalue | p.adjust | qvalue | Count |
| Page: 1 |
Top |
Cell-cell communication analysis |
| Identification of potential cell-cell interactions between two cell types and their ligand-receptor pairs for different disease states |
| Ligand | Receptor | LRpair | Pathway | Tissue | Disease Stage |
| Page: 1 |
Top |
Single-cell gene regulatory network inference analysis |
| Find out the significant the regulons (TFs) and the target genes of each regulon across cell types for different disease states |
| TF | Cell Type | Tissue | Disease Stage | Target Gene | RSS | Regulon Activity |
| ∗The dot plots of a searched regulon are shown for all cell subpopulations in each disease state of each tissue based on the regulon specific score inferred using pySCENIC and by calculating the average expression. |
| Page: 1 |
Top |
Somatic mutation of malignant transformation related genes |
| Annotation of somatic variants for genes involved in malignant transformation |
| Hugo Symbol | Variant Class | Variant Classification | dbSNP RS | HGVSc | HGVSp | HGVSp Short | SWISSPROT | BIOTYPE | SIFT | PolyPhen | Tumor Sample Barcode | Tissue | Histology | Sex | Age | Stage | Therapy Types | Drugs | Outcome |
| ABHD11 | SNV | Missense_Mutation | novel | c.431G>T | p.Gly144Val | p.G144V | Q8NFV4 | protein_coding | deleterious(0) | probably_damaging(0.998) | TCGA-C8-A12U-01 | Breast | breast invasive carcinoma | Female | <65 | I/II | Unknown | Unknown | SD |
| ABHD11 | SNV | Missense_Mutation | c.668T>C | p.Leu223Pro | p.L223P | Q8NFV4 | protein_coding | deleterious(0) | probably_damaging(0.999) | TCGA-2W-A8YY-01 | Cervix | cervical & endocervical cancer | Female | <65 | I/II | Chemotherapy | cisplatin | CR | |
| ABHD11 | SNV | Missense_Mutation | novel | c.134N>A | p.Arg45Gln | p.R45Q | Q8NFV4 | protein_coding | tolerated(0.47) | benign(0) | TCGA-C5-A3HE-01 | Cervix | cervical & endocervical cancer | Female | <65 | I/II | Unknown | Unknown | PD |
| ABHD11 | SNV | Missense_Mutation | novel | c.508N>A | p.Glu170Lys | p.E170K | Q8NFV4 | protein_coding | tolerated(0.65) | benign(0.001) | TCGA-VS-A958-01 | Cervix | cervical & endocervical cancer | Female | <65 | I/II | Chemotherapy | cisplatin | CR |
| ABHD11 | deletion | Frame_Shift_Del | novel | c.140delN | p.Gly47AlafsTer52 | p.G47Afs*52 | Q8NFV4 | protein_coding | TCGA-EA-A410-01 | Cervix | cervical & endocervical cancer | Female | <65 | I/II | Unknown | Unknown | SD | ||
| ABHD11 | SNV | Missense_Mutation | c.211N>G | p.Phe71Val | p.F71V | Q8NFV4 | protein_coding | tolerated(0.13) | benign(0.028) | TCGA-AY-A54L-01 | Colorectum | colon adenocarcinoma | Female | >=65 | I/II | Unknown | Unknown | PD | |
| ABHD11 | SNV | Missense_Mutation | c.531T>A | p.Phe177Leu | p.F177L | Q8NFV4 | protein_coding | tolerated(0.19) | benign(0.006) | TCGA-D5-6534-01 | Colorectum | colon adenocarcinoma | Female | <65 | I/II | Unknown | Unknown | SD | |
| ABHD11 | SNV | Missense_Mutation | novel | c.715N>A | p.Leu239Met | p.L239M | Q8NFV4 | protein_coding | deleterious(0.03) | probably_damaging(0.979) | TCGA-A5-A2K3-01 | Endometrium | uterine corpus endometrioid carcinoma | Female | >=65 | I/II | Chemotherapy | carboplatin | SD |
| ABHD11 | SNV | Missense_Mutation | novel | c.493G>T | p.Asp165Tyr | p.D165Y | Q8NFV4 | protein_coding | deleterious(0) | probably_damaging(1) | TCGA-A5-A2K5-01 | Endometrium | uterine corpus endometrioid carcinoma | Female | >=65 | I/II | Unknown | Unknown | SD |
| ABHD11 | SNV | Missense_Mutation | novel | c.653N>G | p.His218Arg | p.H218R | Q8NFV4 | protein_coding | deleterious(0) | benign(0) | TCGA-AX-A2HJ-01 | Endometrium | uterine corpus endometrioid carcinoma | Female | <65 | I/II | Unknown | Unknown | SD |
| Page: 1 2 3 |
Top |
Related drugs of malignant transformation related genes |
| Identification of chemicals and drugs interact with genes involved in malignant transfromation |
| (DGIdb 4.0) |
| Entrez ID | Symbol | Category | Interaction Types | Drug Claim Name | Drug Name | PMIDs |
| Page: 1 |

Copyright 2023-Present -The University of Texas Health Science Center at Houston |