
|
|||||
|
 | |
| |
| |
| |
| |
| |
|
Gene: ZSWIM7 |
Gene summary for ZSWIM7 |
| Gene information | Species | Human | Gene symbol | ZSWIM7 | Gene ID | 125150 |
| Gene name | zinc finger SWIM-type containing 7 | |
| Gene Alias | SWS1 | |
| Cytomap | 17p12 | |
| Gene Type | protein-coding | GO ID | GO:0000724 | UniProtAcc | A0A024RD64 |
Top |
Malignant transformation analysis |
| Identification of the aberrant gene expression in precancerous and cancerous lesions by comparing the gene expression of stem-like cells in diseased tissues with normal stem cells |
| Entrez ID | Symbol | Replicates | Species | Organ | Tissue | Adj P-value | Log2FC | Malignancy |
| 125150 | ZSWIM7 | P52T-E | Human | Esophagus | ESCC | 4.30e-10 | 2.58e-01 | 0.1555 |
| 125150 | ZSWIM7 | P54T-E | Human | Esophagus | ESCC | 1.56e-17 | 3.16e-01 | 0.0975 |
| 125150 | ZSWIM7 | P56T-E | Human | Esophagus | ESCC | 2.65e-06 | 1.08e+00 | 0.1613 |
| 125150 | ZSWIM7 | P57T-E | Human | Esophagus | ESCC | 1.66e-23 | 3.06e-01 | 0.0926 |
| 125150 | ZSWIM7 | P61T-E | Human | Esophagus | ESCC | 1.35e-16 | 4.31e-01 | 0.099 |
| 125150 | ZSWIM7 | P62T-E | Human | Esophagus | ESCC | 3.86e-30 | 7.53e-01 | 0.1302 |
| 125150 | ZSWIM7 | P65T-E | Human | Esophagus | ESCC | 2.28e-12 | 1.60e-01 | 0.0978 |
| 125150 | ZSWIM7 | P74T-E | Human | Esophagus | ESCC | 2.71e-14 | 5.24e-01 | 0.1479 |
| 125150 | ZSWIM7 | P75T-E | Human | Esophagus | ESCC | 1.05e-27 | 5.17e-01 | 0.1125 |
| 125150 | ZSWIM7 | P76T-E | Human | Esophagus | ESCC | 7.07e-27 | 4.44e-01 | 0.1207 |
| 125150 | ZSWIM7 | P79T-E | Human | Esophagus | ESCC | 8.63e-20 | 4.41e-01 | 0.1154 |
| 125150 | ZSWIM7 | P80T-E | Human | Esophagus | ESCC | 7.39e-22 | 6.66e-01 | 0.155 |
| 125150 | ZSWIM7 | P82T-E | Human | Esophagus | ESCC | 3.11e-11 | 7.22e-01 | 0.1072 |
| 125150 | ZSWIM7 | P83T-E | Human | Esophagus | ESCC | 1.43e-14 | 3.28e-01 | 0.1738 |
| 125150 | ZSWIM7 | P84T-E | Human | Esophagus | ESCC | 1.87e-06 | 4.92e-01 | 0.0933 |
| 125150 | ZSWIM7 | P89T-E | Human | Esophagus | ESCC | 1.93e-14 | 8.97e-01 | 0.1752 |
| 125150 | ZSWIM7 | P91T-E | Human | Esophagus | ESCC | 1.42e-09 | 1.32e+00 | 0.1828 |
| 125150 | ZSWIM7 | P94T-E | Human | Esophagus | ESCC | 3.45e-05 | 2.85e-01 | 0.0879 |
| 125150 | ZSWIM7 | P107T-E | Human | Esophagus | ESCC | 1.73e-21 | 6.10e-01 | 0.171 |
| 125150 | ZSWIM7 | P126T-E | Human | Esophagus | ESCC | 4.89e-04 | 5.20e-01 | 0.1125 |
| Page: 1 2 3 4 5 6 |
| Tissue | Expression Dynamics | Abbreviation |
| Esophagus |  | ESCC: Esophageal squamous cell carcinoma |
| HGIN: High-grade intraepithelial neoplasias | ||
| LGIN: Low-grade intraepithelial neoplasias | ||
| Liver |  | HCC: Hepatocellular carcinoma |
| NAFLD: Non-alcoholic fatty liver disease | ||
| Oral Cavity | 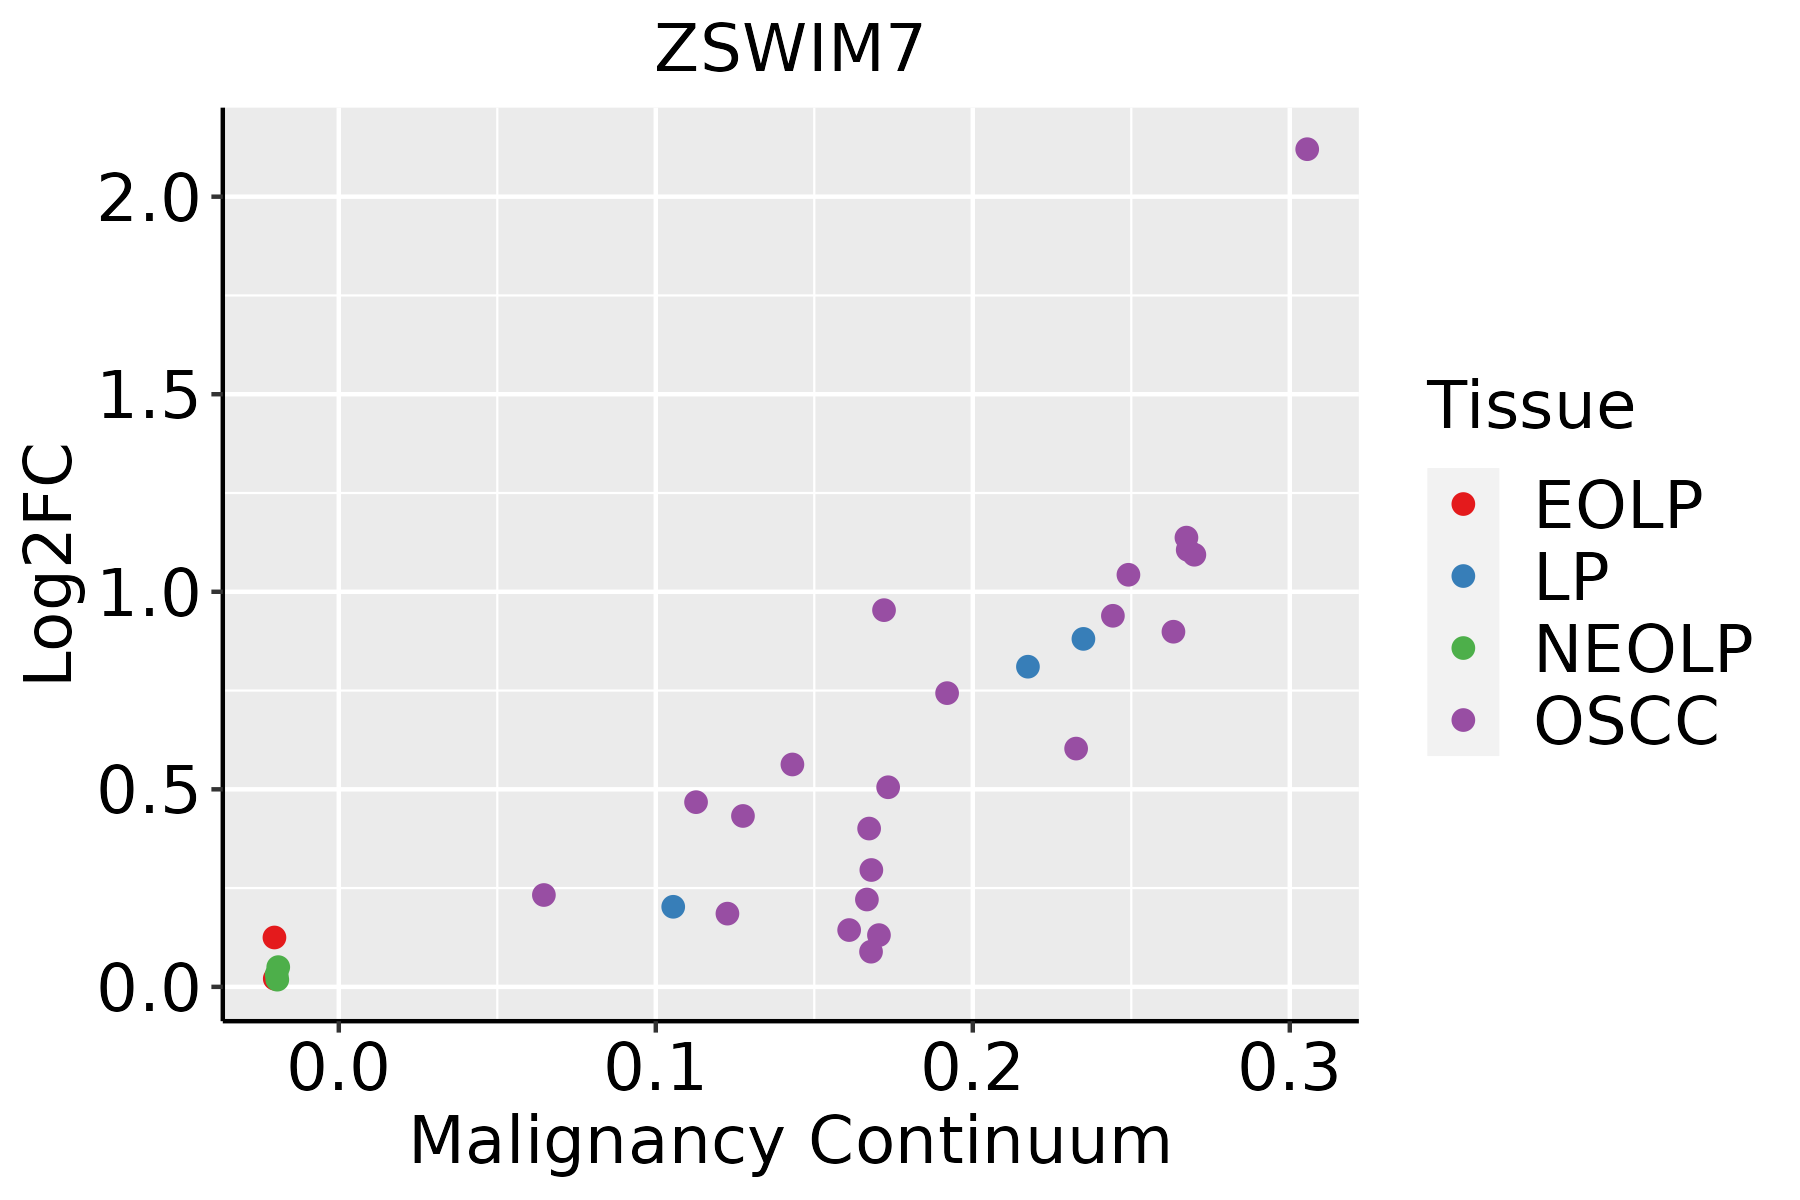 | EOLP: Erosive Oral lichen planus |
| LP: leukoplakia | ||
| NEOLP: Non-erosive oral lichen planus | ||
| OSCC: Oral squamous cell carcinoma | ||
| Skin | 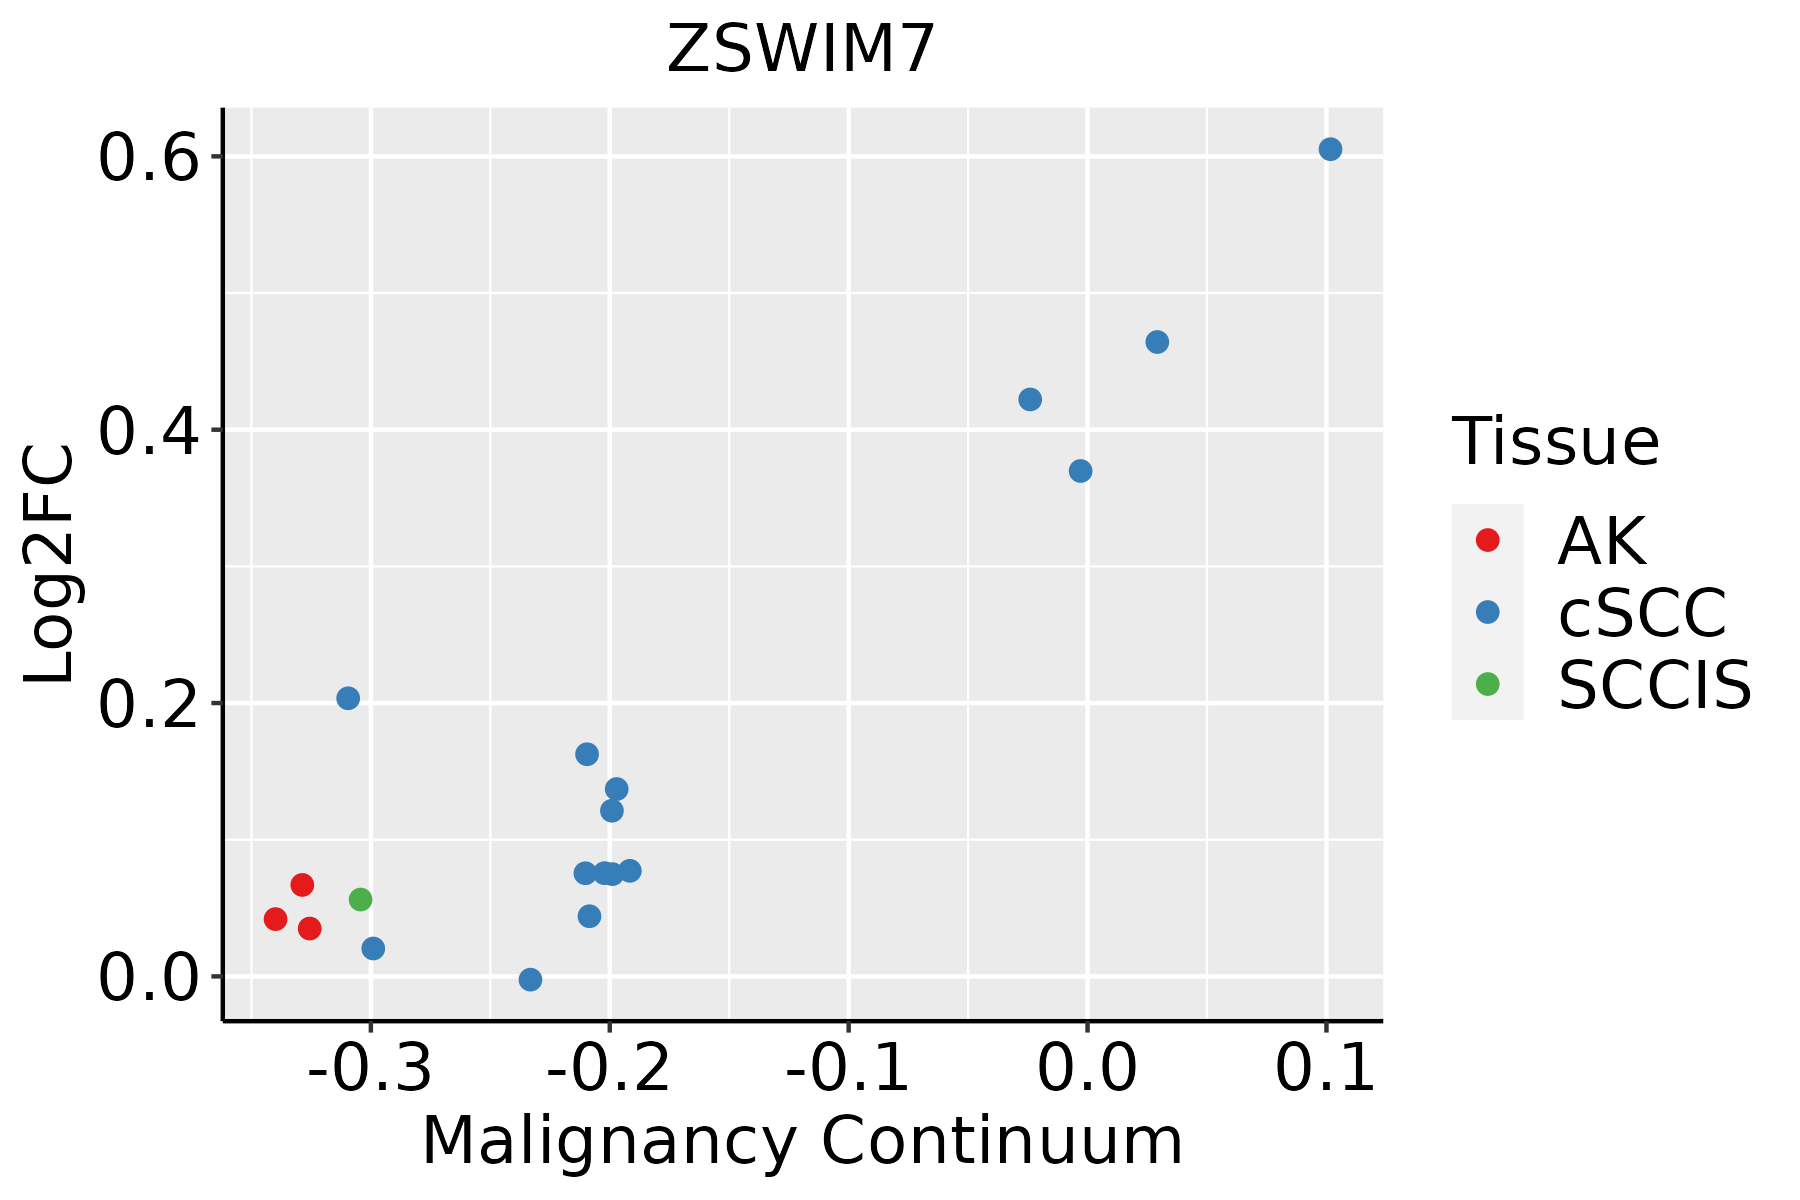 | AK: Actinic keratosis |
| cSCC: Cutaneous squamous cell carcinoma | ||
| SCCIS:squamous cell carcinoma in situ | ||
| Thyroid | 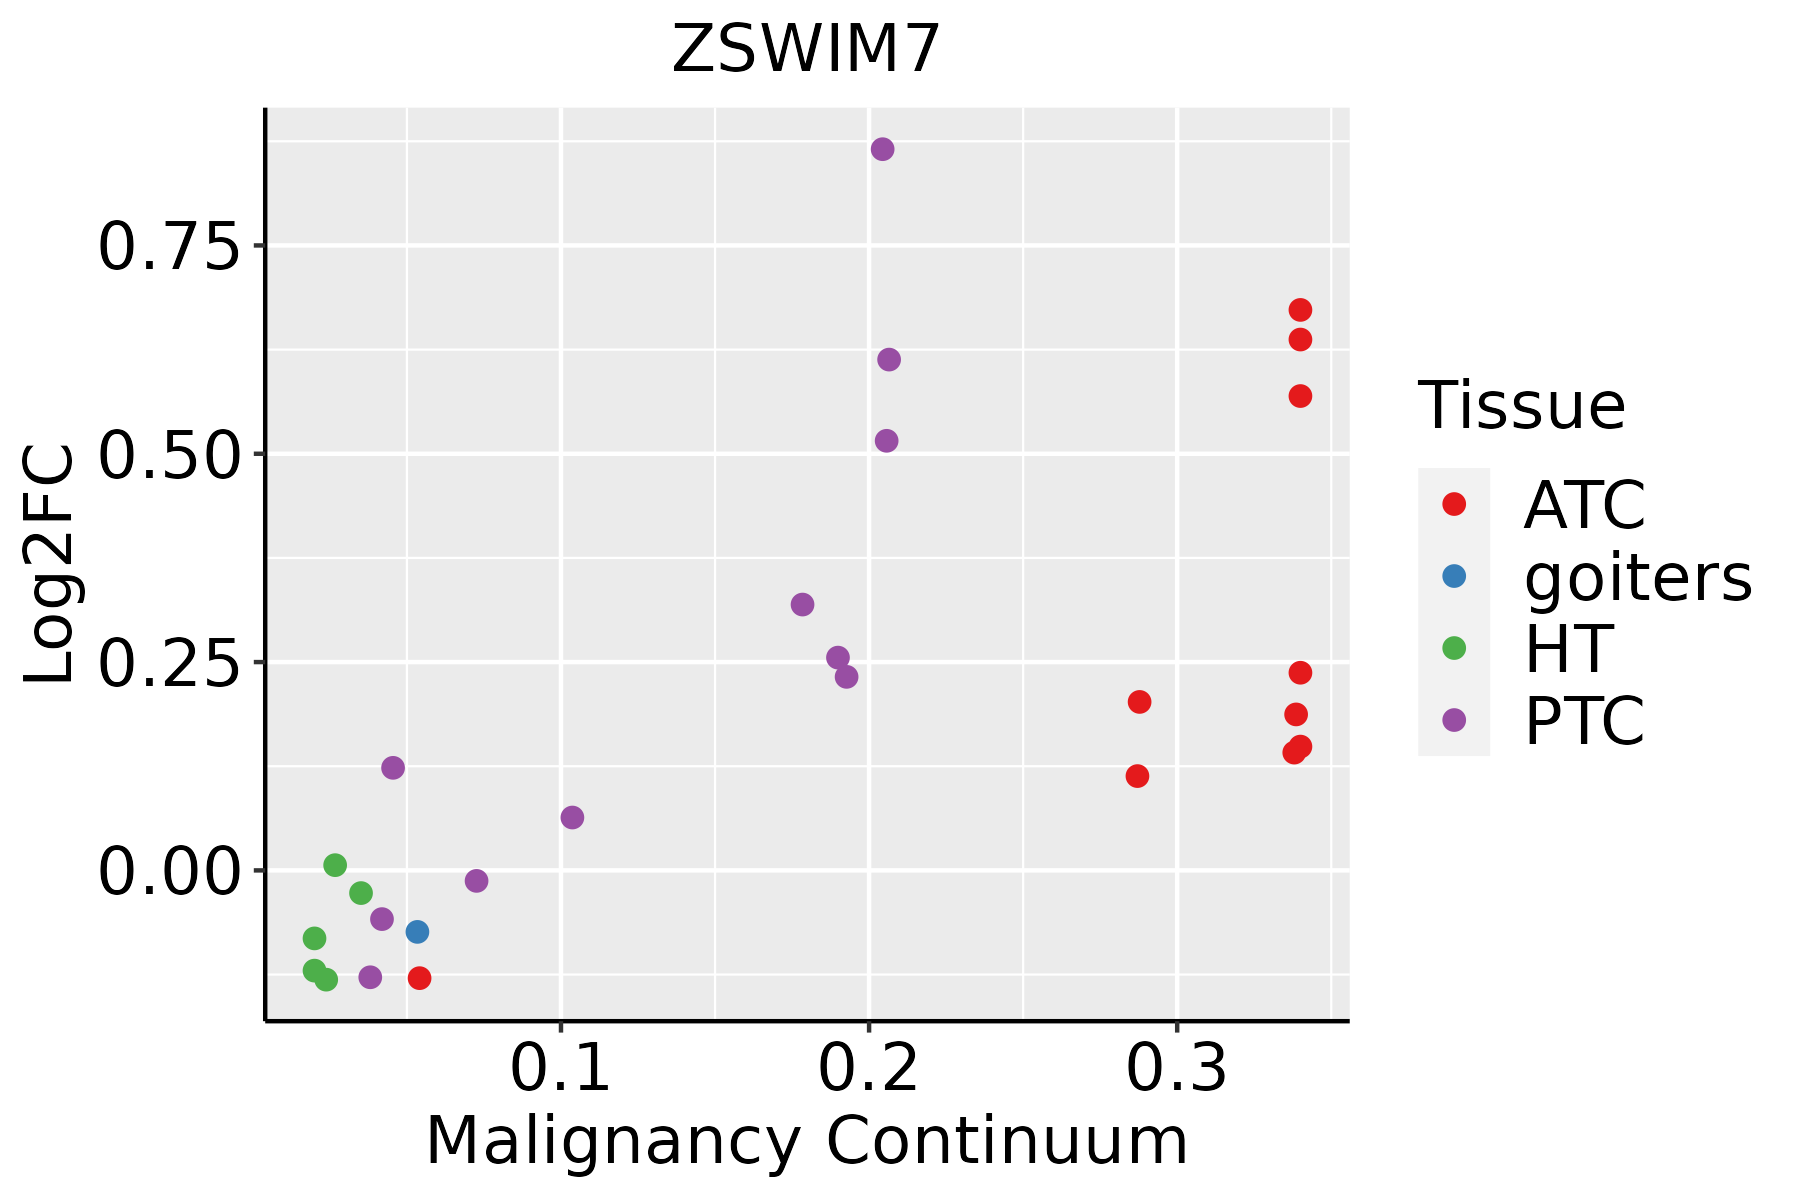 | ATC: Anaplastic thyroid cancer |
| HT: Hashimoto's thyroiditis | ||
| PTC: Papillary thyroid cancer |
| ∗log2FC in expression of this searched gene in stem-like cells from each diseased tissue sample relative to stem-like cells in normal samples in each tissue plotted against the malignancy continuum. Samples are colored based on if they are from different disease stage. |
Top |
Malignant transformation related pathway analysis |
| Find out the enriched GO biological processes and KEGG pathways involved in transition from healthy to precancer to cancer |
| Tissue | Disease Stage | Enriched GO biological Processes |
| Colorectum | AD |  |
| Colorectum | SER |  |
| Colorectum | MSS |  |
| Colorectum | MSI-H |  |
| Colorectum | FAP |  |
| ∗Top 15 enriched GO BP terms are showed in the bar plot of each disease state in each tissue. Each row represents a significant GO biological process which is colored according to the -log10(p.adjust). |
| Page: 1 2 3 4 5 6 7 8 9 |
| GO ID | Tissue | Disease Stage | Description | Gene Ratio | Bg Ratio | pvalue | p.adjust | Count |
| GO:0031647111 | Esophagus | ESCC | regulation of protein stability | 223/8552 | 298/18723 | 5.76e-25 | 1.52e-22 | 223 |
| GO:0050821111 | Esophagus | ESCC | protein stabilization | 140/8552 | 191/18723 | 6.50e-15 | 3.61e-13 | 140 |
| GO:00063024 | Esophagus | ESCC | double-strand break repair | 152/8552 | 251/18723 | 1.33e-06 | 1.62e-05 | 152 |
| GO:00063101 | Esophagus | ESCC | DNA recombination | 168/8552 | 305/18723 | 5.58e-04 | 3.05e-03 | 168 |
| GO:00007241 | Esophagus | ESCC | double-strand break repair via homologous recombination | 79/8552 | 138/18723 | 4.05e-03 | 1.62e-02 | 79 |
| GO:00007251 | Esophagus | ESCC | recombinational repair | 80/8552 | 140/18723 | 4.10e-03 | 1.63e-02 | 80 |
| GO:003164712 | Liver | Cirrhotic | regulation of protein stability | 144/4634 | 298/18723 | 6.74e-19 | 1.28e-16 | 144 |
| GO:005082112 | Liver | Cirrhotic | protein stabilization | 97/4634 | 191/18723 | 6.67e-15 | 6.97e-13 | 97 |
| GO:003164722 | Liver | HCC | regulation of protein stability | 211/7958 | 298/18723 | 2.29e-23 | 5.01e-21 | 211 |
| GO:005082122 | Liver | HCC | protein stabilization | 139/7958 | 191/18723 | 1.61e-17 | 1.71e-15 | 139 |
| GO:00063021 | Liver | HCC | double-strand break repair | 131/7958 | 251/18723 | 1.17e-03 | 6.54e-03 | 131 |
| GO:003164720 | Oral cavity | OSCC | regulation of protein stability | 193/7305 | 298/18723 | 1.30e-19 | 1.95e-17 | 193 |
| GO:005082120 | Oral cavity | OSCC | protein stabilization | 122/7305 | 191/18723 | 2.69e-12 | 1.09e-10 | 122 |
| GO:00063023 | Oral cavity | OSCC | double-strand break repair | 132/7305 | 251/18723 | 7.93e-06 | 8.52e-05 | 132 |
| GO:0006310 | Oral cavity | OSCC | DNA recombination | 147/7305 | 305/18723 | 6.33e-04 | 3.56e-03 | 147 |
| GO:0000725 | Oral cavity | OSCC | recombinational repair | 70/7305 | 140/18723 | 5.22e-03 | 2.03e-02 | 70 |
| GO:0000724 | Oral cavity | OSCC | double-strand break repair via homologous recombination | 69/7305 | 138/18723 | 5.52e-03 | 2.14e-02 | 69 |
| GO:0031647110 | Oral cavity | LP | regulation of protein stability | 132/4623 | 298/18723 | 8.16e-14 | 7.99e-12 | 132 |
| GO:0050821110 | Oral cavity | LP | protein stabilization | 88/4623 | 191/18723 | 9.15e-11 | 5.51e-09 | 88 |
| GO:000630211 | Oral cavity | LP | double-strand break repair | 80/4623 | 251/18723 | 5.81e-03 | 3.46e-02 | 80 |
| Page: 1 2 |
| Pathway ID | Tissue | Disease Stage | Description | Gene Ratio | Bg Ratio | pvalue | p.adjust | qvalue | Count |
| Page: 1 |
Top |
Cell-cell communication analysis |
| Identification of potential cell-cell interactions between two cell types and their ligand-receptor pairs for different disease states |
| Ligand | Receptor | LRpair | Pathway | Tissue | Disease Stage |
| Page: 1 |
Top |
Single-cell gene regulatory network inference analysis |
| Find out the significant the regulons (TFs) and the target genes of each regulon across cell types for different disease states |
| TF | Cell Type | Tissue | Disease Stage | Target Gene | RSS | Regulon Activity |
| ∗The dot plots of a searched regulon are shown for all cell subpopulations in each disease state of each tissue based on the regulon specific score inferred using pySCENIC and by calculating the average expression. |
| Page: 1 |
Top |
Somatic mutation of malignant transformation related genes |
| Annotation of somatic variants for genes involved in malignant transformation |
| Hugo Symbol | Variant Class | Variant Classification | dbSNP RS | HGVSc | HGVSp | HGVSp Short | SWISSPROT | BIOTYPE | SIFT | PolyPhen | Tumor Sample Barcode | Tissue | Histology | Sex | Age | Stage | Therapy Types | Drugs | Outcome |
| ZSWIM7 | SNV | Missense_Mutation | novel | c.283N>A | p.Leu95Ile | p.L95I | Q19AV6 | protein_coding | deleterious(0.03) | probably_damaging(0.989) | TCGA-AP-A1DV-01 | Endometrium | uterine corpus endometrioid carcinoma | Female | <65 | I/II | Unknown | Unknown | SD |
| ZSWIM7 | SNV | Missense_Mutation | novel | c.242C>A | p.Ser81Tyr | p.S81Y | Q19AV6 | protein_coding | deleterious(0) | probably_damaging(0.99) | TCGA-D1-A16X-01 | Endometrium | uterine corpus endometrioid carcinoma | Female | <65 | I/II | Unknown | Unknown | SD |
| ZSWIM7 | SNV | Missense_Mutation | novel | c.34N>T | p.Leu12Phe | p.L12F | Q19AV6 | protein_coding | deleterious(0) | probably_damaging(0.986) | TCGA-EC-A1QX-01 | Endometrium | uterine corpus endometrioid carcinoma | Female | >=65 | I/II | Chemotherapy | cyclophosphamide | PD |
| ZSWIM7 | SNV | Missense_Mutation | rs775419383 | c.191G>A | p.Arg64His | p.R64H | Q19AV6 | protein_coding | tolerated(0.24) | benign(0.001) | TCGA-D7-6521-01 | Stomach | stomach adenocarcinoma | Male | >=65 | I/II | Chemotherapy | plfe/flo | PD |
| Page: 1 |
Top |
Related drugs of malignant transformation related genes |
| Identification of chemicals and drugs interact with genes involved in malignant transfromation |
| (DGIdb 4.0) |
| Entrez ID | Symbol | Category | Interaction Types | Drug Claim Name | Drug Name | PMIDs |
| Page: 1 |

Copyright 2023-Present -The University of Texas Health Science Center at Houston |