
|
|||||
|
 | |
| |
| |
| |
| |
| |
|
Gene: ZNRF1 |
Gene summary for ZNRF1 |
| Gene information | Species | Human | Gene symbol | ZNRF1 | Gene ID | 84937 |
| Gene name | zinc and ring finger 1 | |
| Gene Alias | NIN283 | |
| Cytomap | 16q23.1 | |
| Gene Type | protein-coding | GO ID | GO:0000209 | UniProtAcc | Q8ND25 |
Top |
Malignant transformation analysis |
| Identification of the aberrant gene expression in precancerous and cancerous lesions by comparing the gene expression of stem-like cells in diseased tissues with normal stem cells |
| Entrez ID | Symbol | Replicates | Species | Organ | Tissue | Adj P-value | Log2FC | Malignancy |
| 84937 | ZNRF1 | P47T-E | Human | Esophagus | ESCC | 3.24e-11 | 2.38e-01 | 0.1067 |
| 84937 | ZNRF1 | P48T-E | Human | Esophagus | ESCC | 1.35e-07 | 1.70e-01 | 0.0959 |
| 84937 | ZNRF1 | P49T-E | Human | Esophagus | ESCC | 1.35e-09 | 7.12e-01 | 0.1768 |
| 84937 | ZNRF1 | P52T-E | Human | Esophagus | ESCC | 1.77e-07 | 1.62e-01 | 0.1555 |
| 84937 | ZNRF1 | P54T-E | Human | Esophagus | ESCC | 1.50e-18 | 6.19e-01 | 0.0975 |
| 84937 | ZNRF1 | P57T-E | Human | Esophagus | ESCC | 3.51e-08 | 1.42e-01 | 0.0926 |
| 84937 | ZNRF1 | P61T-E | Human | Esophagus | ESCC | 1.67e-10 | 1.46e-01 | 0.099 |
| 84937 | ZNRF1 | P62T-E | Human | Esophagus | ESCC | 1.09e-20 | 3.95e-01 | 0.1302 |
| 84937 | ZNRF1 | P65T-E | Human | Esophagus | ESCC | 2.83e-14 | 2.36e-01 | 0.0978 |
| 84937 | ZNRF1 | P75T-E | Human | Esophagus | ESCC | 1.37e-11 | 1.33e-01 | 0.1125 |
| 84937 | ZNRF1 | P76T-E | Human | Esophagus | ESCC | 2.23e-05 | 6.27e-02 | 0.1207 |
| 84937 | ZNRF1 | P79T-E | Human | Esophagus | ESCC | 1.94e-04 | 1.26e-01 | 0.1154 |
| 84937 | ZNRF1 | P80T-E | Human | Esophagus | ESCC | 2.88e-09 | 1.65e-01 | 0.155 |
| 84937 | ZNRF1 | P82T-E | Human | Esophagus | ESCC | 7.47e-09 | 2.85e-01 | 0.1072 |
| 84937 | ZNRF1 | P83T-E | Human | Esophagus | ESCC | 2.12e-19 | 4.02e-01 | 0.1738 |
| 84937 | ZNRF1 | P107T-E | Human | Esophagus | ESCC | 7.53e-03 | 5.81e-02 | 0.171 |
| 84937 | ZNRF1 | P126T-E | Human | Esophagus | ESCC | 2.15e-04 | 7.20e-01 | 0.1125 |
| 84937 | ZNRF1 | P127T-E | Human | Esophagus | ESCC | 1.50e-31 | 6.85e-01 | 0.0826 |
| 84937 | ZNRF1 | P128T-E | Human | Esophagus | ESCC | 3.14e-14 | 5.26e-01 | 0.1241 |
| 84937 | ZNRF1 | P130T-E | Human | Esophagus | ESCC | 2.62e-32 | 6.70e-01 | 0.1676 |
| Page: 1 2 3 4 5 |
| Tissue | Expression Dynamics | Abbreviation |
| Endometrium |  | AEH: Atypical endometrial hyperplasia |
| EEC: Endometrioid Cancer | ||
| Esophagus |  | ESCC: Esophageal squamous cell carcinoma |
| HGIN: High-grade intraepithelial neoplasias | ||
| LGIN: Low-grade intraepithelial neoplasias | ||
| Oral Cavity | 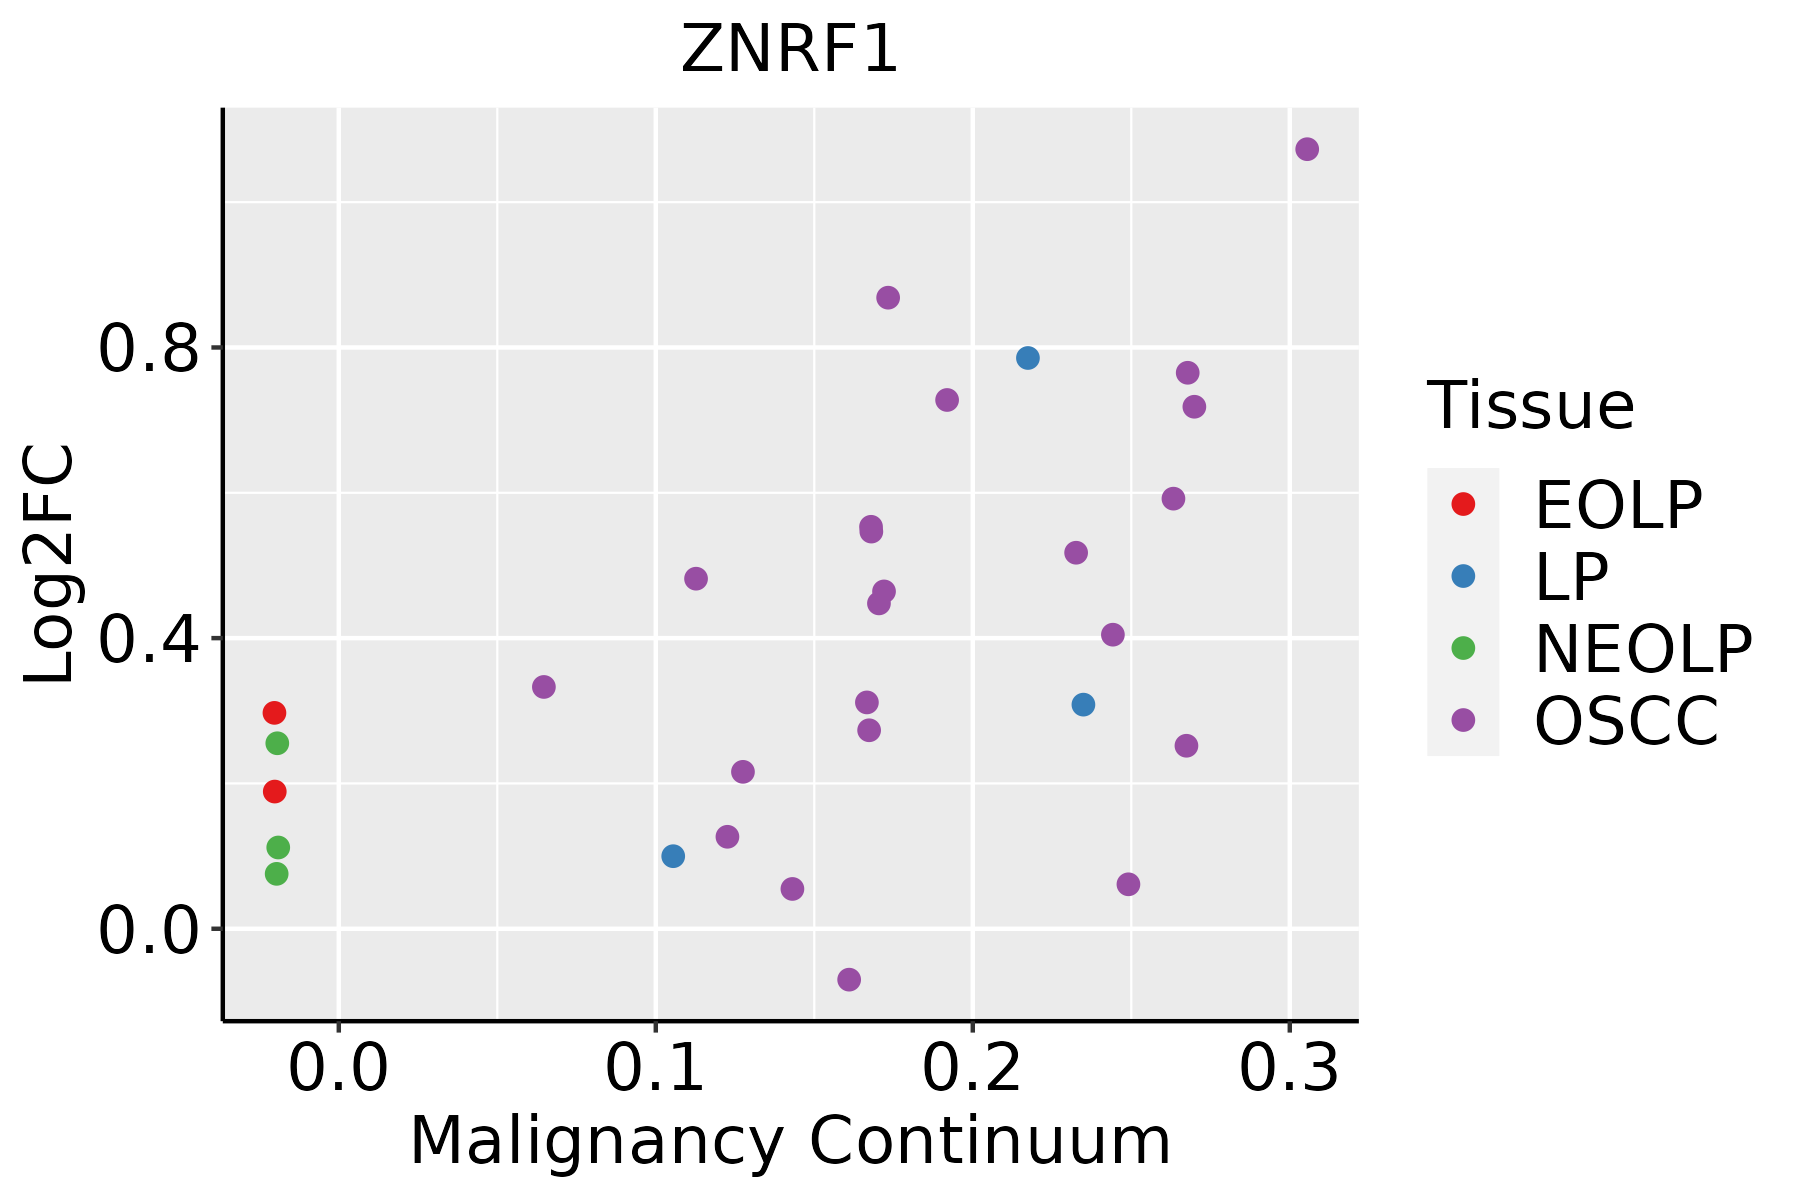 | EOLP: Erosive Oral lichen planus |
| LP: leukoplakia | ||
| NEOLP: Non-erosive oral lichen planus | ||
| OSCC: Oral squamous cell carcinoma | ||
| Thyroid | 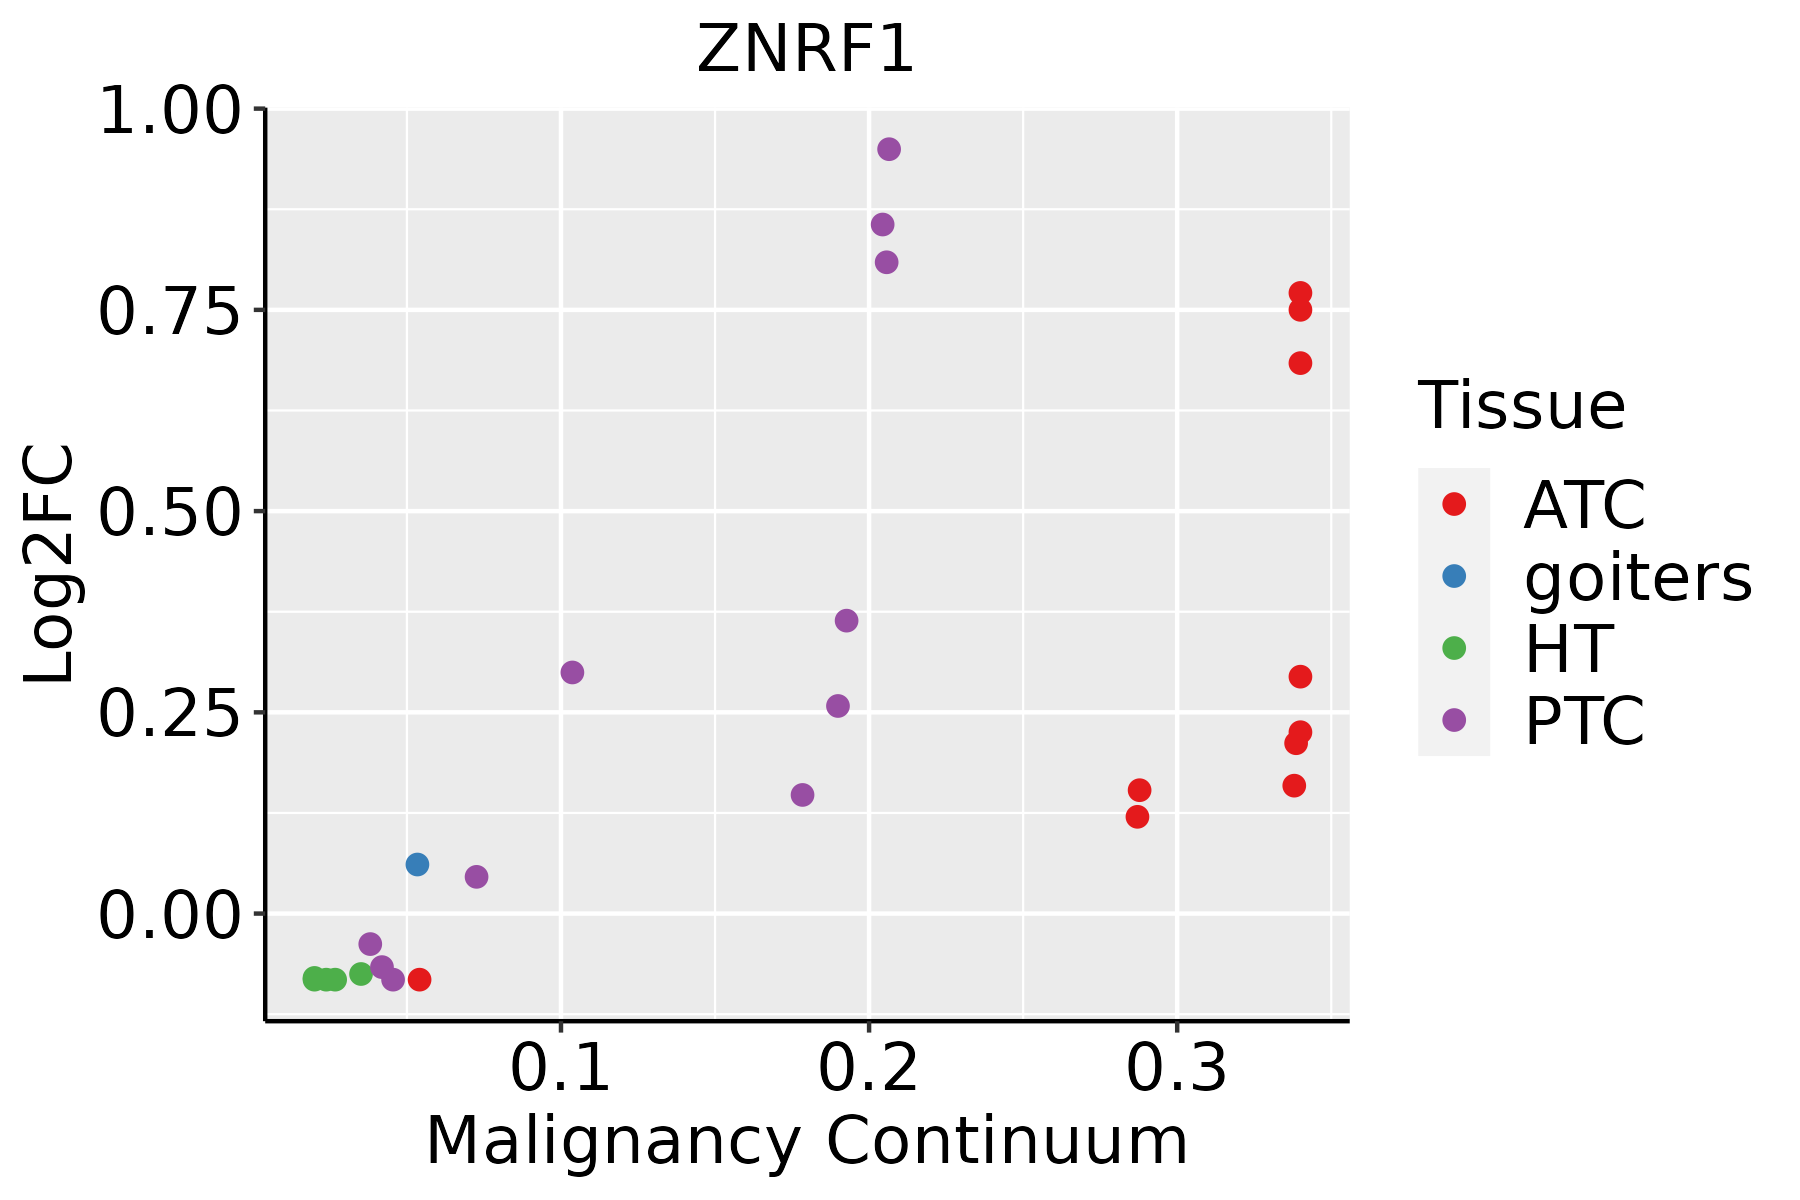 | ATC: Anaplastic thyroid cancer |
| HT: Hashimoto's thyroiditis | ||
| PTC: Papillary thyroid cancer |
| ∗log2FC in expression of this searched gene in stem-like cells from each diseased tissue sample relative to stem-like cells in normal samples in each tissue plotted against the malignancy continuum. Samples are colored based on if they are from different disease stage. |
Top |
Malignant transformation related pathway analysis |
| Find out the enriched GO biological processes and KEGG pathways involved in transition from healthy to precancer to cancer |
| Tissue | Disease Stage | Enriched GO biological Processes |
| Colorectum | AD |  |
| Colorectum | SER |  |
| Colorectum | MSS |  |
| Colorectum | MSI-H |  |
| Colorectum | FAP |  |
| ∗Top 15 enriched GO BP terms are showed in the bar plot of each disease state in each tissue. Each row represents a significant GO biological process which is colored according to the -log10(p.adjust). |
| Page: 1 2 3 4 5 6 7 8 9 |
| GO ID | Tissue | Disease Stage | Description | Gene Ratio | Bg Ratio | pvalue | p.adjust | Count |
| GO:001049817 | Endometrium | EEC | proteasomal protein catabolic process | 112/2168 | 490/18723 | 6.99e-13 | 1.40e-10 | 112 |
| GO:004316117 | Endometrium | EEC | proteasome-mediated ubiquitin-dependent protein catabolic process | 92/2168 | 412/18723 | 3.01e-10 | 3.23e-08 | 92 |
| GO:007093614 | Endometrium | EEC | protein K48-linked ubiquitination | 22/2168 | 65/18723 | 1.92e-06 | 5.79e-05 | 22 |
| GO:000020913 | Endometrium | EEC | protein polyubiquitination | 46/2168 | 236/18723 | 2.65e-04 | 3.04e-03 | 46 |
| GO:0010498111 | Esophagus | ESCC | proteasomal protein catabolic process | 369/8552 | 490/18723 | 1.13e-41 | 1.80e-38 | 369 |
| GO:0043161111 | Esophagus | ESCC | proteasome-mediated ubiquitin-dependent protein catabolic process | 312/8552 | 412/18723 | 3.53e-36 | 4.48e-33 | 312 |
| GO:000020917 | Esophagus | ESCC | protein polyubiquitination | 170/8552 | 236/18723 | 1.40e-16 | 1.09e-14 | 170 |
| GO:007093617 | Esophagus | ESCC | protein K48-linked ubiquitination | 55/8552 | 65/18723 | 8.42e-11 | 2.58e-09 | 55 |
| GO:001049820 | Oral cavity | OSCC | proteasomal protein catabolic process | 336/7305 | 490/18723 | 5.45e-41 | 8.63e-38 | 336 |
| GO:004316120 | Oral cavity | OSCC | proteasome-mediated ubiquitin-dependent protein catabolic process | 285/7305 | 412/18723 | 5.68e-36 | 5.99e-33 | 285 |
| GO:000020910 | Oral cavity | OSCC | protein polyubiquitination | 150/7305 | 236/18723 | 1.59e-14 | 9.27e-13 | 150 |
| GO:00709369 | Oral cavity | OSCC | protein K48-linked ubiquitination | 53/7305 | 65/18723 | 2.47e-12 | 1.02e-10 | 53 |
| GO:0010498110 | Oral cavity | LP | proteasomal protein catabolic process | 224/4623 | 490/18723 | 9.57e-25 | 4.00e-22 | 224 |
| GO:0043161110 | Oral cavity | LP | proteasome-mediated ubiquitin-dependent protein catabolic process | 190/4623 | 412/18723 | 1.08e-21 | 2.93e-19 | 190 |
| GO:007093616 | Oral cavity | LP | protein K48-linked ubiquitination | 32/4623 | 65/18723 | 1.61e-05 | 2.81e-04 | 32 |
| GO:000020915 | Oral cavity | LP | protein polyubiquitination | 82/4623 | 236/18723 | 3.23e-04 | 3.26e-03 | 82 |
| GO:007093622 | Oral cavity | EOLP | protein K48-linked ubiquitination | 31/2218 | 65/18723 | 9.08e-13 | 2.27e-10 | 31 |
| GO:001049825 | Oral cavity | EOLP | proteasomal protein catabolic process | 108/2218 | 490/18723 | 7.79e-11 | 9.51e-09 | 108 |
| GO:000020923 | Oral cavity | EOLP | protein polyubiquitination | 62/2218 | 236/18723 | 7.88e-10 | 5.90e-08 | 62 |
| GO:004316125 | Oral cavity | EOLP | proteasome-mediated ubiquitin-dependent protein catabolic process | 92/2218 | 412/18723 | 9.87e-10 | 6.96e-08 | 92 |
| Page: 1 2 |
| Pathway ID | Tissue | Disease Stage | Description | Gene Ratio | Bg Ratio | pvalue | p.adjust | qvalue | Count |
| Page: 1 |
Top |
Cell-cell communication analysis |
| Identification of potential cell-cell interactions between two cell types and their ligand-receptor pairs for different disease states |
| Ligand | Receptor | LRpair | Pathway | Tissue | Disease Stage |
| Page: 1 |
Top |
Single-cell gene regulatory network inference analysis |
| Find out the significant the regulons (TFs) and the target genes of each regulon across cell types for different disease states |
| TF | Cell Type | Tissue | Disease Stage | Target Gene | RSS | Regulon Activity |
| ∗The dot plots of a searched regulon are shown for all cell subpopulations in each disease state of each tissue based on the regulon specific score inferred using pySCENIC and by calculating the average expression. |
| Page: 1 |
Top |
Somatic mutation of malignant transformation related genes |
| Annotation of somatic variants for genes involved in malignant transformation |
| Hugo Symbol | Variant Class | Variant Classification | dbSNP RS | HGVSc | HGVSp | HGVSp Short | SWISSPROT | BIOTYPE | SIFT | PolyPhen | Tumor Sample Barcode | Tissue | Histology | Sex | Age | Stage | Therapy Types | Drugs | Outcome |
| ZNRF1 | SNV | Missense_Mutation | c.571N>G | p.Leu191Val | p.L191V | Q8ND25 | protein_coding | deleterious(0.04) | possibly_damaging(0.856) | TCGA-A2-A0T0-01 | Breast | breast invasive carcinoma | Female | <65 | I/II | Chemotherapy | taxotere | SD | |
| ZNRF1 | SNV | Missense_Mutation | novel | c.377N>G | p.Asp126Gly | p.D126G | Q8ND25 | protein_coding | tolerated(0.34) | benign(0.188) | TCGA-AO-A128-01 | Breast | breast invasive carcinoma | Female | <65 | I/II | Chemotherapy | doxorubicin | SD |
| ZNRF1 | insertion | Frame_Shift_Ins | novel | c.478_479insGGCTCATGCCTGTAATCTCAGA | p.His160ArgfsTer23 | p.H160Rfs*23 | Q8ND25 | protein_coding | TCGA-A8-A09B-01 | Breast | breast invasive carcinoma | Female | <65 | III/IV | Chemotherapy | 5-fluorouracil | SD | ||
| ZNRF1 | SNV | Missense_Mutation | c.368C>T | p.Ser123Leu | p.S123L | Q8ND25 | protein_coding | tolerated(0.61) | possibly_damaging(0.885) | TCGA-EK-A2PG-01 | Cervix | cervical & endocervical cancer | Female | >=65 | I/II | Unknown | Unknown | SD | |
| ZNRF1 | SNV | Missense_Mutation | c.337G>A | p.Asp113Asn | p.D113N | Q8ND25 | protein_coding | tolerated(0.09) | benign(0.098) | TCGA-CK-4951-01 | Colorectum | colon adenocarcinoma | Female | >=65 | I/II | Unknown | Unknown | PD | |
| ZNRF1 | SNV | Missense_Mutation | rs777896004 | c.506N>A | p.Arg169His | p.R169H | Q8ND25 | protein_coding | deleterious(0) | probably_damaging(0.964) | TCGA-D5-6928-01 | Colorectum | colon adenocarcinoma | Male | >=65 | I/II | Unknown | Unknown | SD |
| ZNRF1 | deletion | Frame_Shift_Del | c.199delG | p.Val67CysfsTer96 | p.V67Cfs*96 | Q8ND25 | protein_coding | TCGA-WS-AB45-01 | Colorectum | colon adenocarcinoma | Female | <65 | I/II | Unknown | Unknown | SD | |||
| ZNRF1 | SNV | Missense_Mutation | rs760873292 | c.587N>T | p.Thr196Met | p.T196M | Q8ND25 | protein_coding | deleterious(0) | probably_damaging(0.91) | TCGA-AP-A059-01 | Endometrium | uterine corpus endometrioid carcinoma | Female | >=65 | I/II | Unknown | Unknown | SD |
| ZNRF1 | SNV | Missense_Mutation | novel | c.596N>T | p.Arg199Met | p.R199M | Q8ND25 | protein_coding | deleterious(0) | probably_damaging(0.993) | TCGA-B5-A1MX-01 | Endometrium | uterine corpus endometrioid carcinoma | Female | <65 | I/II | Hormone Therapy | megace | SD |
| ZNRF1 | SNV | Missense_Mutation | novel | c.290N>G | p.Tyr97Cys | p.Y97C | Q8ND25 | protein_coding | tolerated(0.07) | benign(0.253) | TCGA-EC-A1NJ-01 | Endometrium | uterine corpus endometrioid carcinoma | Female | >=65 | I/II | Unknown | Unknown | SD |
| Page: 1 2 |
Top |
Related drugs of malignant transformation related genes |
| Identification of chemicals and drugs interact with genes involved in malignant transfromation |
| (DGIdb 4.0) |
| Entrez ID | Symbol | Category | Interaction Types | Drug Claim Name | Drug Name | PMIDs |
| Page: 1 |

Copyright 2023-Present -The University of Texas Health Science Center at Houston |