
|
|||||
|
 | |
| |
| |
| |
| |
| |
|
Gene: ZNF768 |
Gene summary for ZNF768 |
| Gene information | Species | Human | Gene symbol | ZNF768 | Gene ID | 79724 |
| Gene name | zinc finger protein 768 | |
| Gene Alias | ZNF768 | |
| Cytomap | 16p11.2 | |
| Gene Type | protein-coding | GO ID | GO:0006139 | UniProtAcc | A0A024QZC8 |
Top |
Malignant transformation analysis |
| Identification of the aberrant gene expression in precancerous and cancerous lesions by comparing the gene expression of stem-like cells in diseased tissues with normal stem cells |
| Entrez ID | Symbol | Replicates | Species | Organ | Tissue | Adj P-value | Log2FC | Malignancy |
| 79724 | ZNF768 | P80T-E | Human | Esophagus | ESCC | 7.99e-08 | 2.73e-01 | 0.155 |
| 79724 | ZNF768 | P82T-E | Human | Esophagus | ESCC | 1.03e-05 | 2.61e-01 | 0.1072 |
| 79724 | ZNF768 | P83T-E | Human | Esophagus | ESCC | 2.56e-09 | 2.41e-01 | 0.1738 |
| 79724 | ZNF768 | P107T-E | Human | Esophagus | ESCC | 7.49e-07 | 1.67e-01 | 0.171 |
| 79724 | ZNF768 | P126T-E | Human | Esophagus | ESCC | 4.06e-02 | 2.99e-01 | 0.1125 |
| 79724 | ZNF768 | P127T-E | Human | Esophagus | ESCC | 1.04e-04 | 1.04e-01 | 0.0826 |
| 79724 | ZNF768 | P128T-E | Human | Esophagus | ESCC | 1.55e-06 | 2.63e-01 | 0.1241 |
| 79724 | ZNF768 | P130T-E | Human | Esophagus | ESCC | 2.14e-20 | 3.47e-01 | 0.1676 |
| 79724 | ZNF768 | HCC1_Meng | Human | Liver | HCC | 1.35e-07 | -2.13e-02 | 0.0246 |
| 79724 | ZNF768 | HCC2_Meng | Human | Liver | HCC | 4.08e-18 | 8.52e-02 | 0.0107 |
| 79724 | ZNF768 | cirrhotic2 | Human | Liver | Cirrhotic | 2.31e-04 | 8.67e-02 | 0.0201 |
| 79724 | ZNF768 | HCC2 | Human | Liver | HCC | 1.49e-04 | 1.07e+00 | 0.5341 |
| 79724 | ZNF768 | S014 | Human | Liver | HCC | 5.92e-20 | 6.21e-01 | 0.2254 |
| 79724 | ZNF768 | S015 | Human | Liver | HCC | 1.93e-11 | 5.02e-01 | 0.2375 |
| 79724 | ZNF768 | S016 | Human | Liver | HCC | 2.32e-15 | 4.74e-01 | 0.2243 |
| 79724 | ZNF768 | S027 | Human | Liver | HCC | 7.08e-05 | 5.10e-01 | 0.2446 |
| 79724 | ZNF768 | S028 | Human | Liver | HCC | 5.83e-20 | 6.11e-01 | 0.2503 |
| 79724 | ZNF768 | S029 | Human | Liver | HCC | 6.13e-12 | 4.63e-01 | 0.2581 |
| 79724 | ZNF768 | C04 | Human | Oral cavity | OSCC | 1.15e-05 | 3.48e-01 | 0.2633 |
| 79724 | ZNF768 | C30 | Human | Oral cavity | OSCC | 1.33e-17 | 6.90e-01 | 0.3055 |
| Page: 1 2 3 4 |
| Tissue | Expression Dynamics | Abbreviation |
| Esophagus | 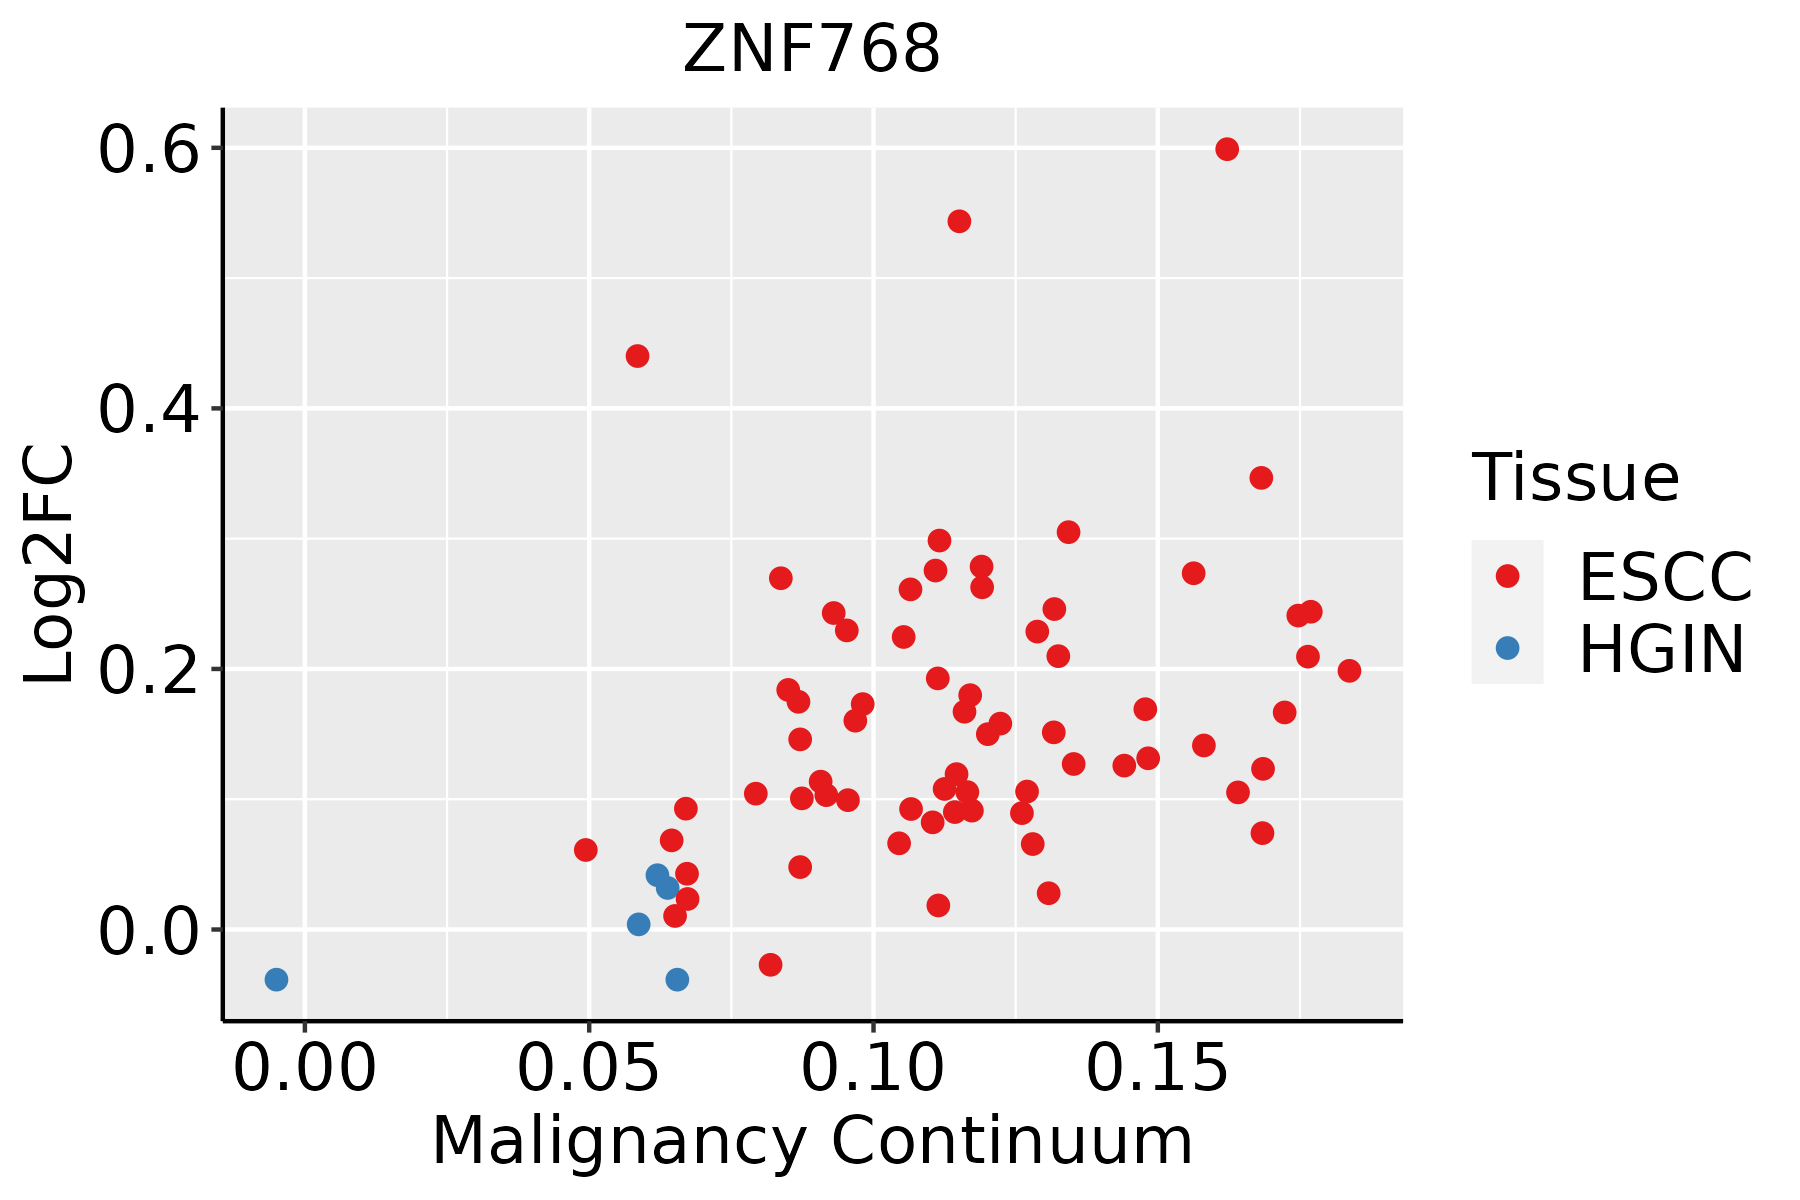 | ESCC: Esophageal squamous cell carcinoma |
| HGIN: High-grade intraepithelial neoplasias | ||
| LGIN: Low-grade intraepithelial neoplasias | ||
| Liver |  | HCC: Hepatocellular carcinoma |
| NAFLD: Non-alcoholic fatty liver disease | ||
| Oral Cavity |  | EOLP: Erosive Oral lichen planus |
| LP: leukoplakia | ||
| NEOLP: Non-erosive oral lichen planus | ||
| OSCC: Oral squamous cell carcinoma |
| ∗log2FC in expression of this searched gene in stem-like cells from each diseased tissue sample relative to stem-like cells in normal samples in each tissue plotted against the malignancy continuum. Samples are colored based on if they are from different disease stage. |
Top |
Malignant transformation related pathway analysis |
| Find out the enriched GO biological processes and KEGG pathways involved in transition from healthy to precancer to cancer |
| Tissue | Disease Stage | Enriched GO biological Processes |
| Colorectum | AD |  |
| Colorectum | SER |  |
| Colorectum | MSS |  |
| Colorectum | MSI-H |  |
| Colorectum | FAP |  |
| ∗Top 15 enriched GO BP terms are showed in the bar plot of each disease state in each tissue. Each row represents a significant GO biological process which is colored according to the -log10(p.adjust). |
| Page: 1 2 3 4 5 6 7 8 9 |
| GO ID | Tissue | Disease Stage | Description | Gene Ratio | Bg Ratio | pvalue | p.adjust | Count |
| Page: 1 |
| Pathway ID | Tissue | Disease Stage | Description | Gene Ratio | Bg Ratio | pvalue | p.adjust | qvalue | Count |
| Page: 1 |
Top |
Cell-cell communication analysis |
| Identification of potential cell-cell interactions between two cell types and their ligand-receptor pairs for different disease states |
| Ligand | Receptor | LRpair | Pathway | Tissue | Disease Stage |
| Page: 1 |
Top |
Single-cell gene regulatory network inference analysis |
| Find out the significant the regulons (TFs) and the target genes of each regulon across cell types for different disease states |
| TF | Cell Type | Tissue | Disease Stage | Target Gene | RSS | Regulon Activity |
| ZNF768 | TREG | Breast | ADJ | MICB,NME4,PPP2R2D, etc. | 2.73e-02 |  |
| ZNF768 | MON | Breast | DCIS | MICB,NME4,PPP2R2D, etc. | 1.22e-02 |  |
| ZNF768 | GDT | Endometrium | ADJ | P2RY11,THOC5,DNAJC30, etc. | 1.44e-01 |  |
| ZNF768 | NEUT | Endometrium | AEH | P2RY11,THOC5,DNAJC30, etc. | 1.76e-01 |  |
| ZNF768 | TH1 | Endometrium | AEH | P2RY11,THOC5,DNAJC30, etc. | 3.29e-02 | |
| ZNF768 | GDT | Endometrium | EEC | P2RY11,THOC5,DNAJC30, etc. | 1.13e-01 |  |
| ∗The dot plots of a searched regulon are shown for all cell subpopulations in each disease state of each tissue based on the regulon specific score inferred using pySCENIC and by calculating the average expression. |
| Page: 1 |
Top |
Somatic mutation of malignant transformation related genes |
| Annotation of somatic variants for genes involved in malignant transformation |
| Hugo Symbol | Variant Class | Variant Classification | dbSNP RS | HGVSc | HGVSp | HGVSp Short | SWISSPROT | BIOTYPE | SIFT | PolyPhen | Tumor Sample Barcode | Tissue | Histology | Sex | Age | Stage | Therapy Types | Drugs | Outcome |
| ZNF768 | SNV | Missense_Mutation | novel | c.277N>A | p.Leu93Ile | p.L93I | Q9H5H4 | protein_coding | deleterious_low_confidence(0.01) | benign(0.003) | TCGA-BH-A1EN-01 | Breast | breast invasive carcinoma | Female | >=65 | I/II | Unknown | Unknown | SD |
| ZNF768 | SNV | Missense_Mutation | c.1572N>C | p.Gln524His | p.Q524H | Q9H5H4 | protein_coding | deleterious_low_confidence(0.03) | probably_damaging(0.973) | TCGA-E9-A22E-01 | Breast | breast invasive carcinoma | Female | <65 | III/IV | Chemotherapy | cyclophosphane | SD | |
| ZNF768 | SNV | Missense_Mutation | novel | c.1295N>A | p.Pro432His | p.P432H | Q9H5H4 | protein_coding | tolerated_low_confidence(0.06) | probably_damaging(0.988) | TCGA-LL-A7T0-01 | Breast | breast invasive carcinoma | Female | >=65 | I/II | Unknown | Unknown | SD |
| ZNF768 | deletion | Frame_Shift_Del | novel | c.1386delC | p.Cys462TrpfsTer99 | p.C462Wfs*99 | Q9H5H4 | protein_coding | TCGA-EW-A2FV-01 | Breast | breast invasive carcinoma | Female | <65 | III/IV | Chemotherapy | docetaxel | SD | ||
| ZNF768 | SNV | Missense_Mutation | novel | c.251C>T | p.Pro84Leu | p.P84L | Q9H5H4 | protein_coding | deleterious_low_confidence(0) | benign(0.231) | TCGA-2W-A8YY-01 | Cervix | cervical & endocervical cancer | Female | <65 | I/II | Chemotherapy | cisplatin | CR |
| ZNF768 | SNV | Missense_Mutation | c.1287N>G | p.Phe429Leu | p.F429L | Q9H5H4 | protein_coding | deleterious_low_confidence(0) | possibly_damaging(0.867) | TCGA-C5-A1BM-01 | Cervix | cervical & endocervical cancer | Female | >=65 | I/II | Unknown | Unknown | SD | |
| ZNF768 | SNV | Missense_Mutation | novel | c.984N>G | p.Asp328Glu | p.D328E | Q9H5H4 | protein_coding | tolerated_low_confidence(0.11) | benign(0.125) | TCGA-DS-A1OB-01 | Cervix | cervical & endocervical cancer | Female | <65 | I/II | Chemotherapy | carboplatin | PD |
| ZNF768 | SNV | Missense_Mutation | novel | c.1319N>G | p.Gln440Arg | p.Q440R | Q9H5H4 | protein_coding | tolerated_low_confidence(0.17) | probably_damaging(0.98) | TCGA-DS-A1OC-01 | Cervix | cervical & endocervical cancer | Female | <65 | I/II | Chemotherapy | gemcitabine | SD |
| ZNF768 | SNV | Missense_Mutation | c.96N>A | p.Met32Ile | p.M32I | Q9H5H4 | protein_coding | tolerated_low_confidence(0.18) | benign(0) | TCGA-EK-A2RJ-01 | Cervix | cervical & endocervical cancer | Female | <65 | I/II | Unknown | Unknown | SD | |
| ZNF768 | SNV | Missense_Mutation | rs775095059 | c.73N>A | p.Glu25Lys | p.E25K | Q9H5H4 | protein_coding | deleterious_low_confidence(0) | benign(0.015) | TCGA-EK-A2RJ-01 | Cervix | cervical & endocervical cancer | Female | <65 | I/II | Unknown | Unknown | SD |
| Page: 1 2 3 4 5 6 7 |
Top |
Related drugs of malignant transformation related genes |
| Identification of chemicals and drugs interact with genes involved in malignant transfromation |
| (DGIdb 4.0) |
| Entrez ID | Symbol | Category | Interaction Types | Drug Claim Name | Drug Name | PMIDs |
| Page: 1 |

Copyright 2023-Present -The University of Texas Health Science Center at Houston |