
|
|||||
|
 | |
| |
| |
| |
| |
| |
|
Gene: ZNF544 |
Gene summary for ZNF544 |
| Gene information | Species | Human | Gene symbol | ZNF544 | Gene ID | 27300 |
| Gene name | zinc finger protein 544 | |
| Gene Alias | ZNF544 | |
| Cytomap | 19q13.43 | |
| Gene Type | protein-coding | GO ID | GO:0006139 | UniProtAcc | Q6NX49 |
Top |
Malignant transformation analysis |
| Identification of the aberrant gene expression in precancerous and cancerous lesions by comparing the gene expression of stem-like cells in diseased tissues with normal stem cells |
| Entrez ID | Symbol | Replicates | Species | Organ | Tissue | Adj P-value | Log2FC | Malignancy |
| 27300 | ZNF544 | P75T-E | Human | Esophagus | ESCC | 1.46e-22 | 4.68e-01 | 0.1125 |
| 27300 | ZNF544 | P76T-E | Human | Esophagus | ESCC | 5.43e-03 | 7.72e-02 | 0.1207 |
| 27300 | ZNF544 | P79T-E | Human | Esophagus | ESCC | 6.66e-10 | 2.15e-01 | 0.1154 |
| 27300 | ZNF544 | P80T-E | Human | Esophagus | ESCC | 5.81e-12 | 2.06e-01 | 0.155 |
| 27300 | ZNF544 | P82T-E | Human | Esophagus | ESCC | 1.72e-10 | 4.35e-01 | 0.1072 |
| 27300 | ZNF544 | P83T-E | Human | Esophagus | ESCC | 1.29e-15 | 3.59e-01 | 0.1738 |
| 27300 | ZNF544 | P89T-E | Human | Esophagus | ESCC | 3.28e-04 | 2.63e-01 | 0.1752 |
| 27300 | ZNF544 | P91T-E | Human | Esophagus | ESCC | 2.06e-06 | 6.18e-01 | 0.1828 |
| 27300 | ZNF544 | P107T-E | Human | Esophagus | ESCC | 1.79e-19 | 3.45e-01 | 0.171 |
| 27300 | ZNF544 | P127T-E | Human | Esophagus | ESCC | 4.21e-05 | 9.09e-02 | 0.0826 |
| 27300 | ZNF544 | P128T-E | Human | Esophagus | ESCC | 4.59e-21 | 5.07e-01 | 0.1241 |
| 27300 | ZNF544 | P130T-E | Human | Esophagus | ESCC | 1.23e-19 | 3.68e-01 | 0.1676 |
| 27300 | ZNF544 | HCC1_Meng | Human | Liver | HCC | 1.16e-43 | 6.64e-03 | 0.0246 |
| 27300 | ZNF544 | HCC2 | Human | Liver | HCC | 1.85e-06 | 2.67e+00 | 0.5341 |
| 27300 | ZNF544 | S014 | Human | Liver | HCC | 9.85e-07 | 1.87e-01 | 0.2254 |
| 27300 | ZNF544 | S015 | Human | Liver | HCC | 8.43e-03 | 2.54e-01 | 0.2375 |
| 27300 | ZNF544 | S028 | Human | Liver | HCC | 1.45e-06 | 3.83e-01 | 0.2503 |
| 27300 | ZNF544 | S029 | Human | Liver | HCC | 1.70e-09 | 5.24e-01 | 0.2581 |
| 27300 | ZNF544 | RNA-P17T-P17T-2 | Human | Lung | IAC | 8.22e-03 | 5.44e-01 | 0.3371 |
| 27300 | ZNF544 | RNA-P17T-P17T-4 | Human | Lung | IAC | 7.71e-03 | 6.51e-01 | 0.343 |
| Page: 1 2 3 4 |
| Tissue | Expression Dynamics | Abbreviation |
| Esophagus |  | ESCC: Esophageal squamous cell carcinoma |
| HGIN: High-grade intraepithelial neoplasias | ||
| LGIN: Low-grade intraepithelial neoplasias | ||
| Liver | 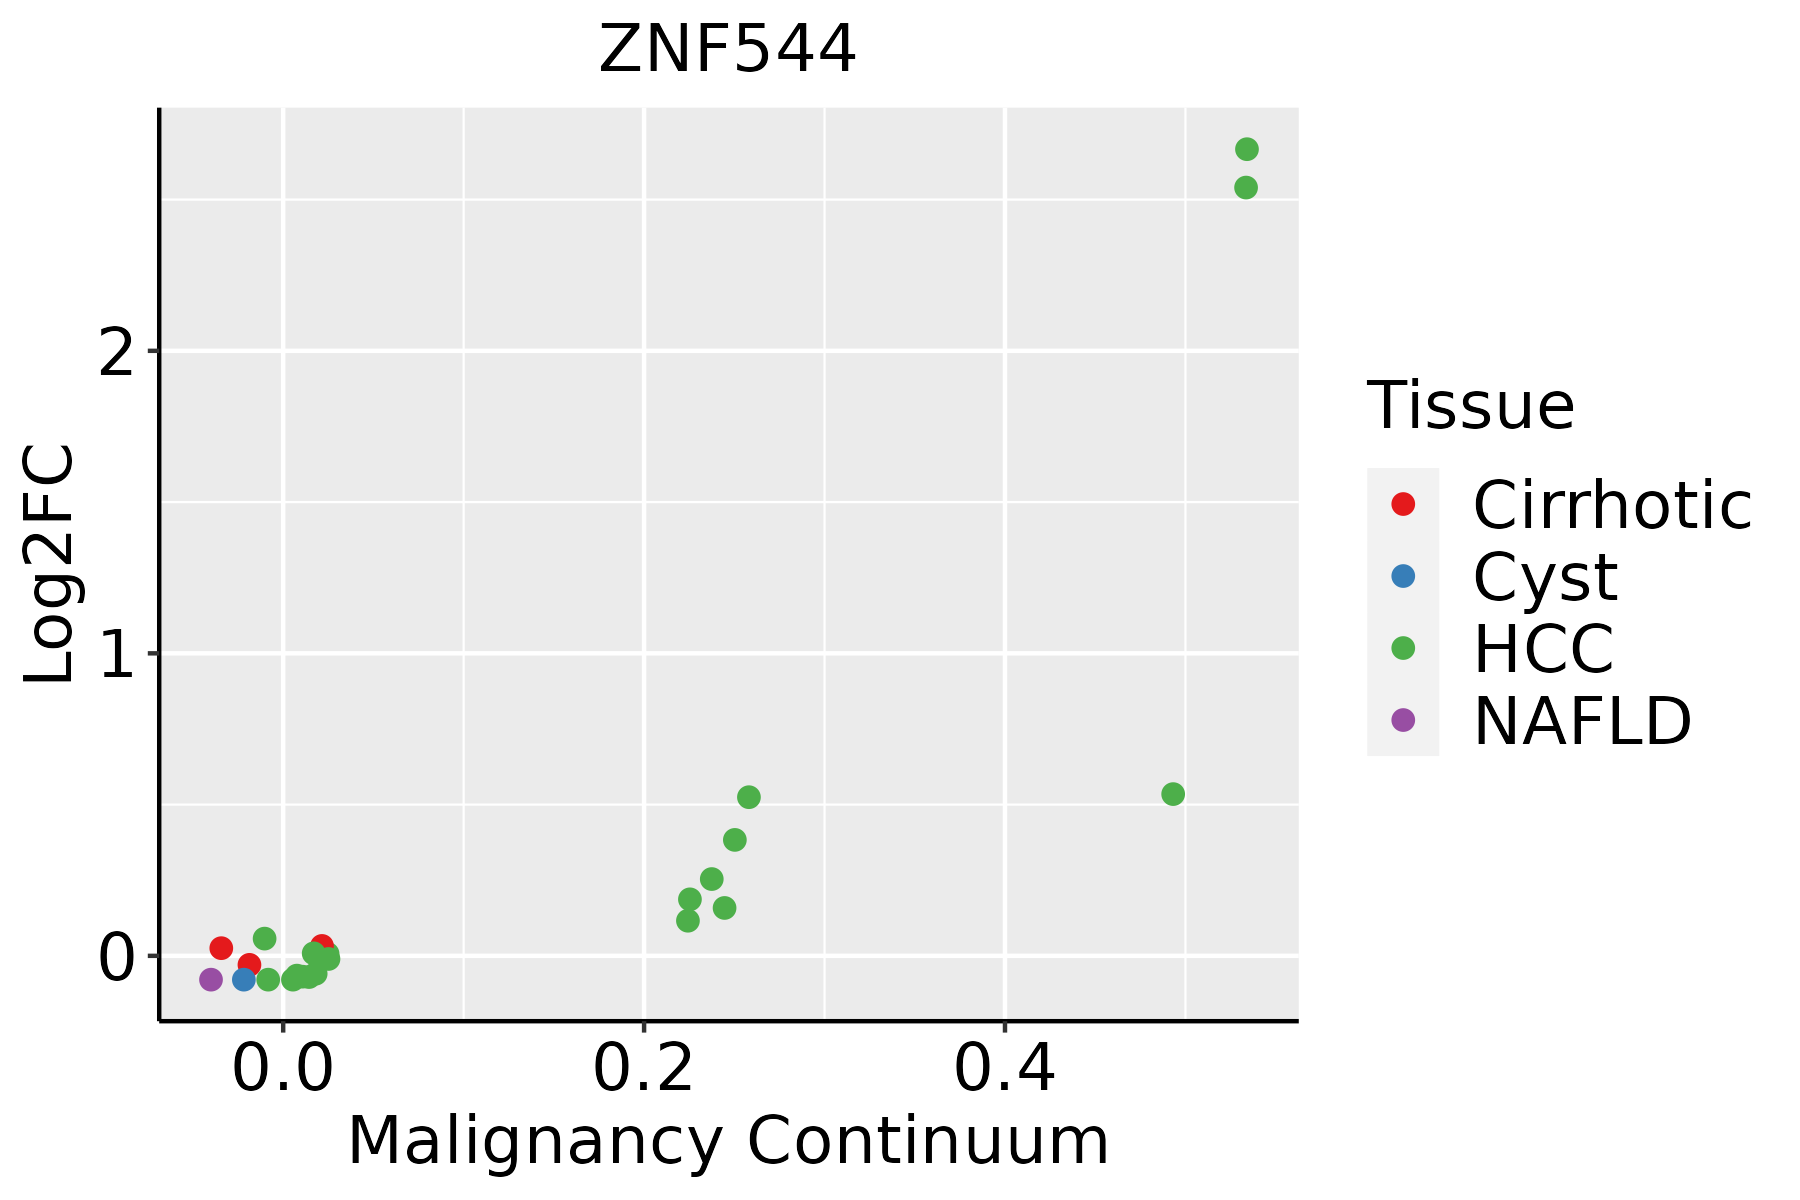 | HCC: Hepatocellular carcinoma |
| NAFLD: Non-alcoholic fatty liver disease | ||
| Lung |  | AAH: Atypical adenomatous hyperplasia |
| AIS: Adenocarcinoma in situ | ||
| IAC: Invasive lung adenocarcinoma | ||
| MIA: Minimally invasive adenocarcinoma | ||
| Oral Cavity | 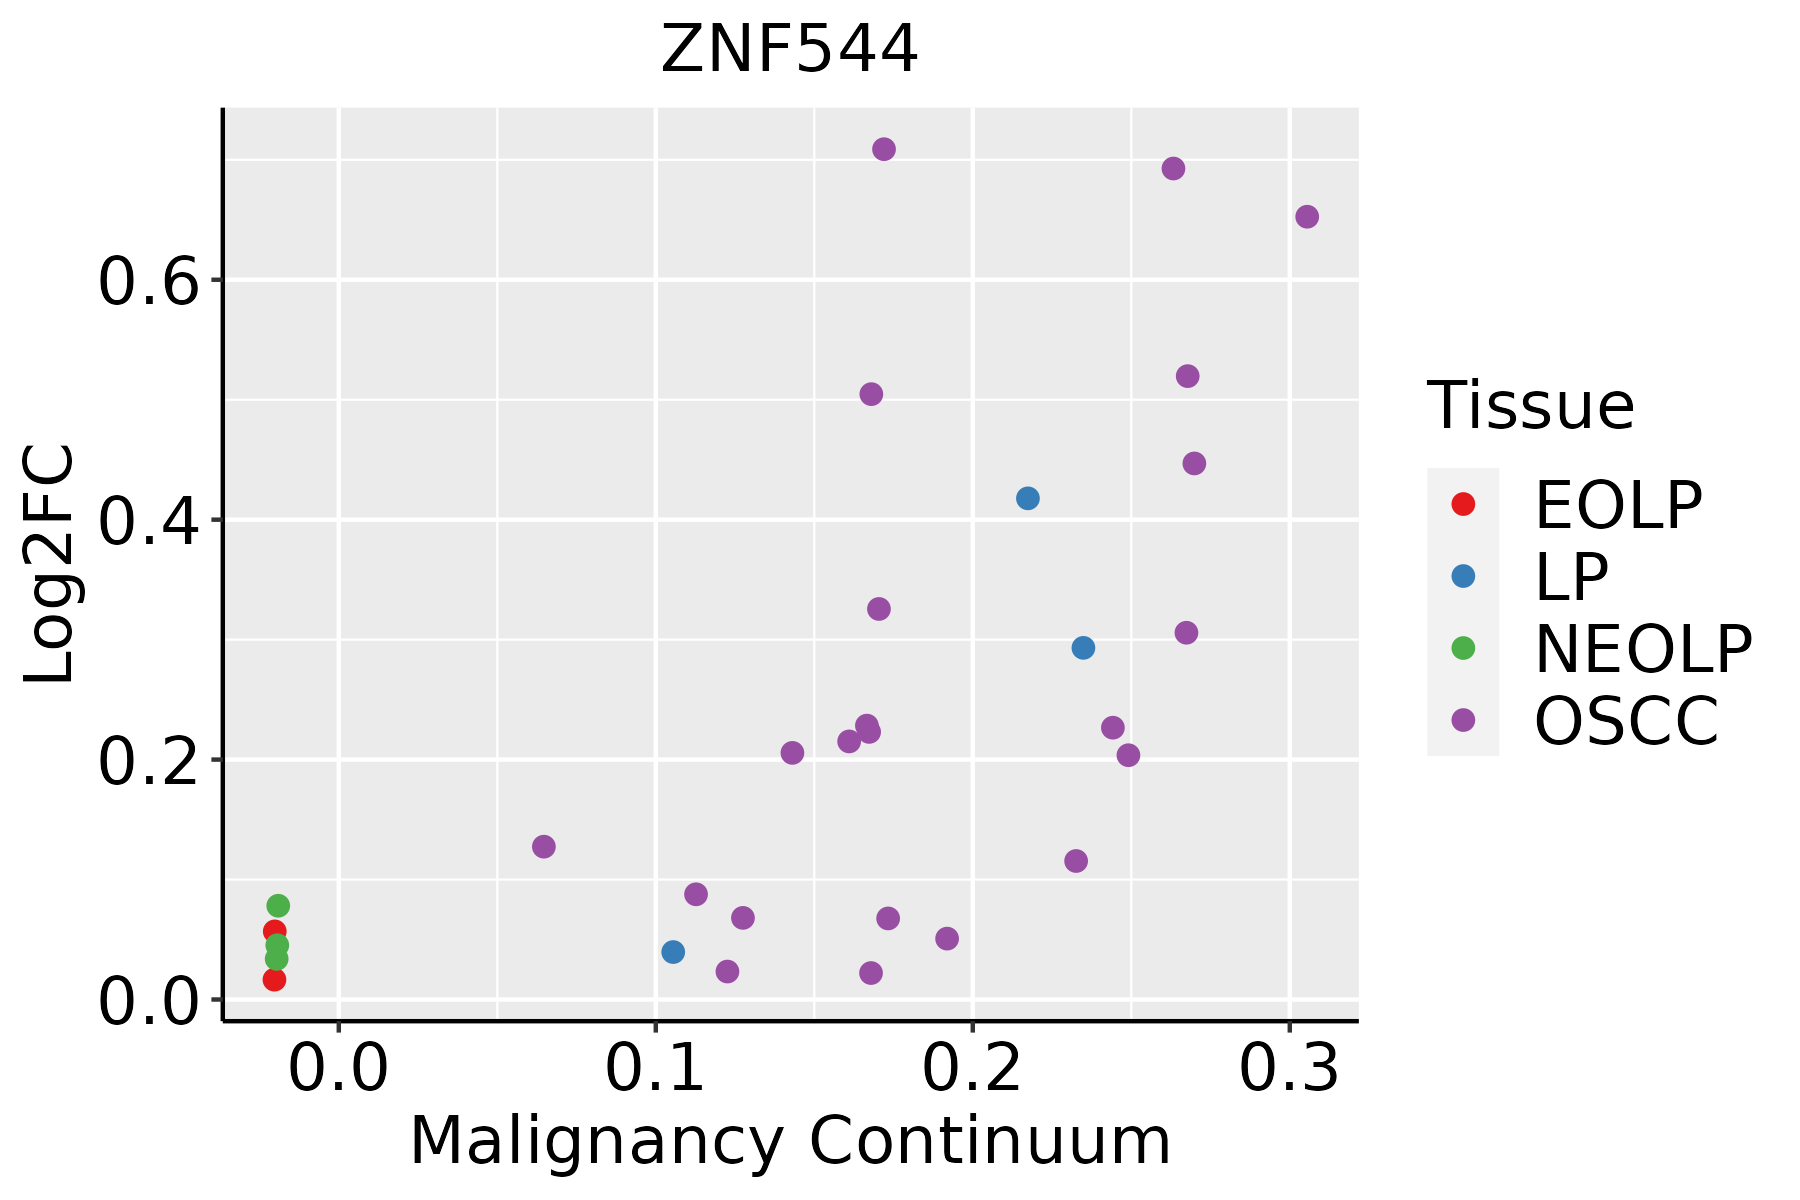 | EOLP: Erosive Oral lichen planus |
| LP: leukoplakia | ||
| NEOLP: Non-erosive oral lichen planus | ||
| OSCC: Oral squamous cell carcinoma |
| ∗log2FC in expression of this searched gene in stem-like cells from each diseased tissue sample relative to stem-like cells in normal samples in each tissue plotted against the malignancy continuum. Samples are colored based on if they are from different disease stage. |
Top |
Malignant transformation related pathway analysis |
| Find out the enriched GO biological processes and KEGG pathways involved in transition from healthy to precancer to cancer |
| Tissue | Disease Stage | Enriched GO biological Processes |
| Colorectum | AD |  |
| Colorectum | SER |  |
| Colorectum | MSS |  |
| Colorectum | MSI-H |  |
| Colorectum | FAP |  |
| ∗Top 15 enriched GO BP terms are showed in the bar plot of each disease state in each tissue. Each row represents a significant GO biological process which is colored according to the -log10(p.adjust). |
| Page: 1 2 3 4 5 6 7 8 9 |
| GO ID | Tissue | Disease Stage | Description | Gene Ratio | Bg Ratio | pvalue | p.adjust | Count |
| Page: 1 |
| Pathway ID | Tissue | Disease Stage | Description | Gene Ratio | Bg Ratio | pvalue | p.adjust | qvalue | Count |
| Page: 1 |
Top |
Cell-cell communication analysis |
| Identification of potential cell-cell interactions between two cell types and their ligand-receptor pairs for different disease states |
| Ligand | Receptor | LRpair | Pathway | Tissue | Disease Stage |
| Page: 1 |
Top |
Single-cell gene regulatory network inference analysis |
| Find out the significant the regulons (TFs) and the target genes of each regulon across cell types for different disease states |
| TF | Cell Type | Tissue | Disease Stage | Target Gene | RSS | Regulon Activity |
| ∗The dot plots of a searched regulon are shown for all cell subpopulations in each disease state of each tissue based on the regulon specific score inferred using pySCENIC and by calculating the average expression. |
| Page: 1 |
Top |
Somatic mutation of malignant transformation related genes |
| Annotation of somatic variants for genes involved in malignant transformation |
| Hugo Symbol | Variant Class | Variant Classification | dbSNP RS | HGVSc | HGVSp | HGVSp Short | SWISSPROT | BIOTYPE | SIFT | PolyPhen | Tumor Sample Barcode | Tissue | Histology | Sex | Age | Stage | Therapy Types | Drugs | Outcome |
| ZNF544 | SNV | Missense_Mutation | c.1318G>C | p.Glu440Gln | p.E440Q | Q6NX49 | protein_coding | tolerated(0.12) | benign(0.091) | TCGA-A1-A0SD-01 | Breast | breast invasive carcinoma | Female | <65 | I/II | Unknown | Unknown | SD | |
| ZNF544 | SNV | Missense_Mutation | c.1447A>G | p.Lys483Glu | p.K483E | Q6NX49 | protein_coding | tolerated(0.19) | benign(0.013) | TCGA-A2-A25B-01 | Breast | breast invasive carcinoma | Female | <65 | I/II | Chemotherapy | taxotere | PD | |
| ZNF544 | SNV | Missense_Mutation | novel | c.922T>A | p.Ser308Thr | p.S308T | Q6NX49 | protein_coding | tolerated(0.55) | benign(0.012) | TCGA-A8-A07I-01 | Breast | breast invasive carcinoma | Female | >=65 | III/IV | Chemotherapy | 5-fluorouracil | CR |
| ZNF544 | SNV | Missense_Mutation | novel | c.922N>A | p.Ser308Thr | p.S308T | Q6NX49 | protein_coding | tolerated(0.55) | benign(0.012) | TCGA-A8-A07Z-01 | Breast | breast invasive carcinoma | Female | >=65 | I/II | Unspecific | Exemestane | SD |
| ZNF544 | SNV | Missense_Mutation | c.2035N>T | p.His679Tyr | p.H679Y | Q6NX49 | protein_coding | tolerated(0.07) | benign(0.067) | TCGA-AC-A23C-01 | Breast | breast invasive carcinoma | Female | <65 | I/II | Chemotherapy | chemo | CR | |
| ZNF544 | SNV | Missense_Mutation | c.901N>A | p.Asp301Asn | p.D301N | Q6NX49 | protein_coding | tolerated(0.27) | benign(0) | TCGA-AC-A23H-01 | Breast | breast invasive carcinoma | Female | >=65 | I/II | Unknown | Unknown | PD | |
| ZNF544 | SNV | Missense_Mutation | novel | c.426C>G | p.Phe142Leu | p.F142L | Q6NX49 | protein_coding | tolerated(0.8) | benign(0.04) | TCGA-AC-A3W7-01 | Breast | breast invasive carcinoma | Female | >=65 | I/II | Hormone Therapy | femara | SD |
| ZNF544 | SNV | Missense_Mutation | novel | c.923C>A | p.Ser308Tyr | p.S308Y | Q6NX49 | protein_coding | tolerated(1) | benign(0.144) | TCGA-AC-A3W7-01 | Breast | breast invasive carcinoma | Female | >=65 | I/II | Hormone Therapy | femara | SD |
| ZNF544 | SNV | Missense_Mutation | c.1358N>C | p.Val453Ala | p.V453A | Q6NX49 | protein_coding | tolerated(1) | benign(0.028) | TCGA-AN-A0FL-01 | Breast | breast invasive carcinoma | Female | <65 | I/II | Unknown | Unknown | SD | |
| ZNF544 | SNV | Missense_Mutation | c.189C>G | p.Ile63Met | p.I63M | Q6NX49 | protein_coding | deleterious(0) | probably_damaging(0.915) | TCGA-C8-A1HJ-01 | Breast | breast invasive carcinoma | Female | <65 | I/II | Unknown | Unknown | SD |
| Page: 1 2 3 4 5 6 7 8 9 10 |
Top |
Related drugs of malignant transformation related genes |
| Identification of chemicals and drugs interact with genes involved in malignant transfromation |
| (DGIdb 4.0) |
| Entrez ID | Symbol | Category | Interaction Types | Drug Claim Name | Drug Name | PMIDs |
| Page: 1 |

Copyright 2023-Present -The University of Texas Health Science Center at Houston |