
|
|||||
|
 | |
| |
| |
| |
| |
| |
|
Gene: ZNF394 |
Gene summary for ZNF394 |
| Gene information | Species | Human | Gene symbol | ZNF394 | Gene ID | 84124 |
| Gene name | zinc finger protein 394 | |
| Gene Alias | ZKSCAN14 | |
| Cytomap | 7q22.1 | |
| Gene Type | protein-coding | GO ID | GO:0006139 | UniProtAcc | Q53GI3 |
Top |
Malignant transformation analysis |
| Identification of the aberrant gene expression in precancerous and cancerous lesions by comparing the gene expression of stem-like cells in diseased tissues with normal stem cells |
| Entrez ID | Symbol | Replicates | Species | Organ | Tissue | Adj P-value | Log2FC | Malignancy |
| 84124 | ZNF394 | P52T-E | Human | Esophagus | ESCC | 1.60e-21 | 4.78e-01 | 0.1555 |
| 84124 | ZNF394 | P54T-E | Human | Esophagus | ESCC | 4.62e-28 | 6.02e-01 | 0.0975 |
| 84124 | ZNF394 | P57T-E | Human | Esophagus | ESCC | 3.17e-12 | 3.01e-01 | 0.0926 |
| 84124 | ZNF394 | P61T-E | Human | Esophagus | ESCC | 3.25e-16 | 3.83e-01 | 0.099 |
| 84124 | ZNF394 | P62T-E | Human | Esophagus | ESCC | 4.29e-34 | 6.16e-01 | 0.1302 |
| 84124 | ZNF394 | P65T-E | Human | Esophagus | ESCC | 5.18e-20 | 3.98e-01 | 0.0978 |
| 84124 | ZNF394 | P74T-E | Human | Esophagus | ESCC | 4.79e-26 | 6.94e-01 | 0.1479 |
| 84124 | ZNF394 | P75T-E | Human | Esophagus | ESCC | 4.15e-36 | 5.87e-01 | 0.1125 |
| 84124 | ZNF394 | P76T-E | Human | Esophagus | ESCC | 1.75e-44 | 6.99e-01 | 0.1207 |
| 84124 | ZNF394 | P79T-E | Human | Esophagus | ESCC | 7.48e-27 | 3.53e-01 | 0.1154 |
| 84124 | ZNF394 | P80T-E | Human | Esophagus | ESCC | 3.67e-64 | 1.64e+00 | 0.155 |
| 84124 | ZNF394 | P82T-E | Human | Esophagus | ESCC | 5.09e-14 | 6.91e-01 | 0.1072 |
| 84124 | ZNF394 | P83T-E | Human | Esophagus | ESCC | 6.99e-43 | 1.04e+00 | 0.1738 |
| 84124 | ZNF394 | P84T-E | Human | Esophagus | ESCC | 2.17e-12 | 5.68e-01 | 0.0933 |
| 84124 | ZNF394 | P89T-E | Human | Esophagus | ESCC | 6.10e-15 | 7.55e-01 | 0.1752 |
| 84124 | ZNF394 | P91T-E | Human | Esophagus | ESCC | 4.39e-04 | 5.97e-01 | 0.1828 |
| 84124 | ZNF394 | P107T-E | Human | Esophagus | ESCC | 2.64e-40 | 8.40e-01 | 0.171 |
| 84124 | ZNF394 | P126T-E | Human | Esophagus | ESCC | 1.28e-02 | 5.39e-01 | 0.1125 |
| 84124 | ZNF394 | P127T-E | Human | Esophagus | ESCC | 2.85e-38 | 6.75e-01 | 0.0826 |
| 84124 | ZNF394 | P128T-E | Human | Esophagus | ESCC | 3.45e-26 | 9.43e-01 | 0.1241 |
| Page: 1 2 3 4 5 6 |
| Tissue | Expression Dynamics | Abbreviation |
| Esophagus | 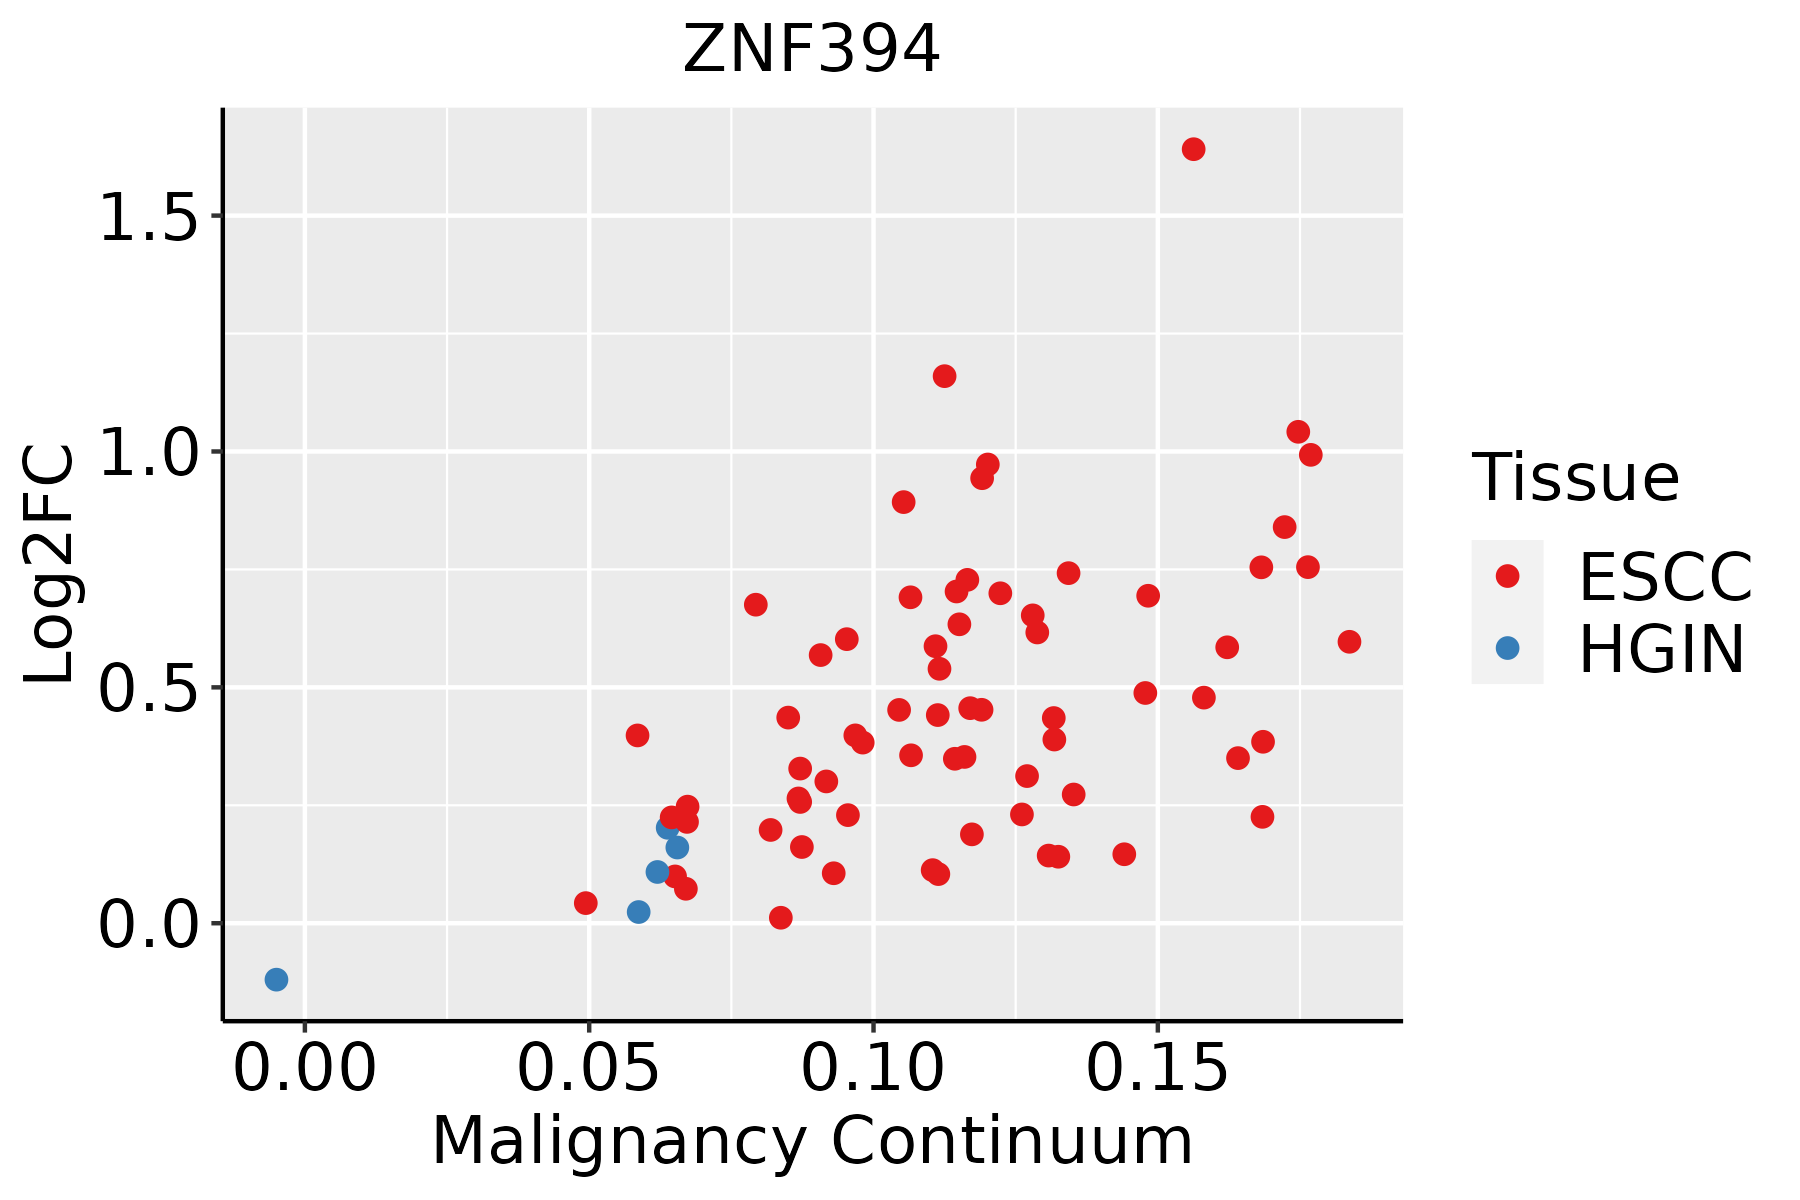 | ESCC: Esophageal squamous cell carcinoma |
| HGIN: High-grade intraepithelial neoplasias | ||
| LGIN: Low-grade intraepithelial neoplasias | ||
| Liver |  | HCC: Hepatocellular carcinoma |
| NAFLD: Non-alcoholic fatty liver disease | ||
| Oral Cavity | 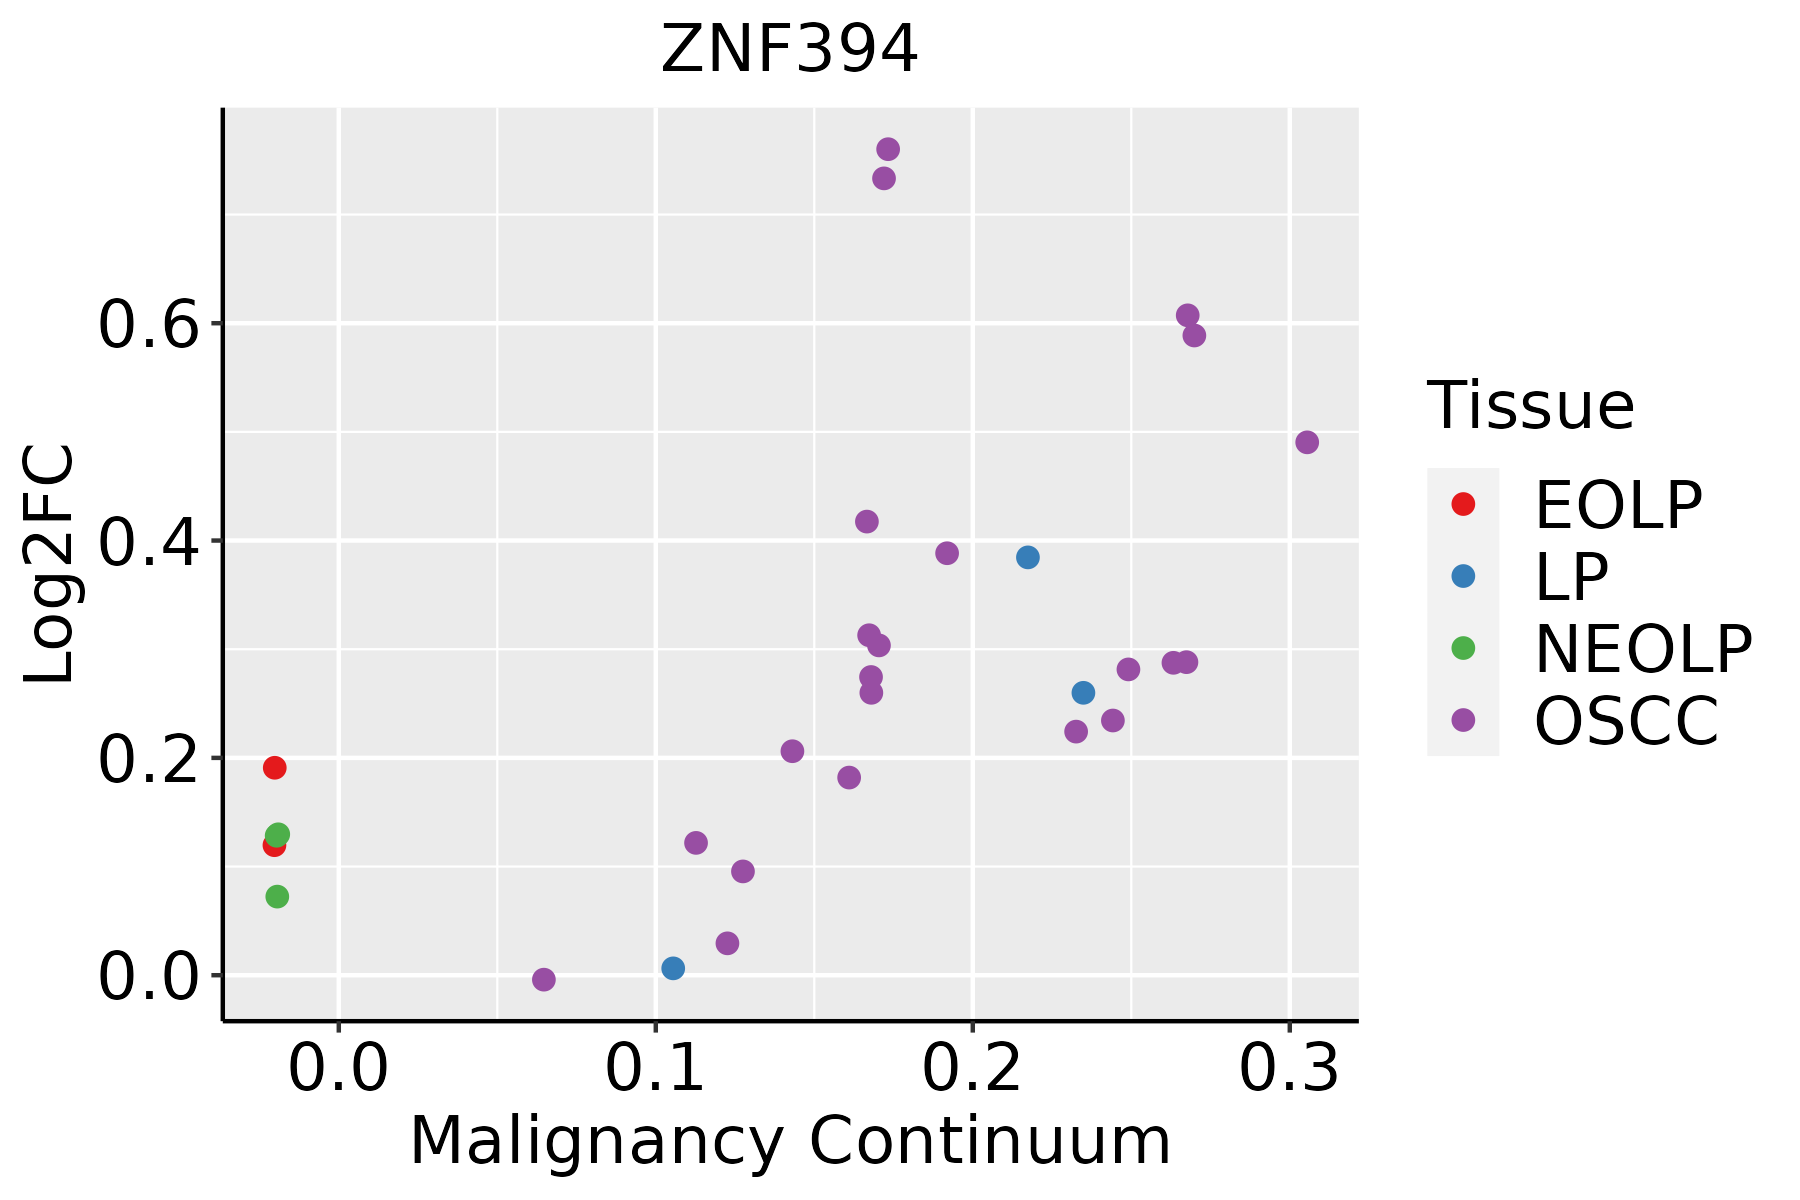 | EOLP: Erosive Oral lichen planus |
| LP: leukoplakia | ||
| NEOLP: Non-erosive oral lichen planus | ||
| OSCC: Oral squamous cell carcinoma | ||
| Thyroid | 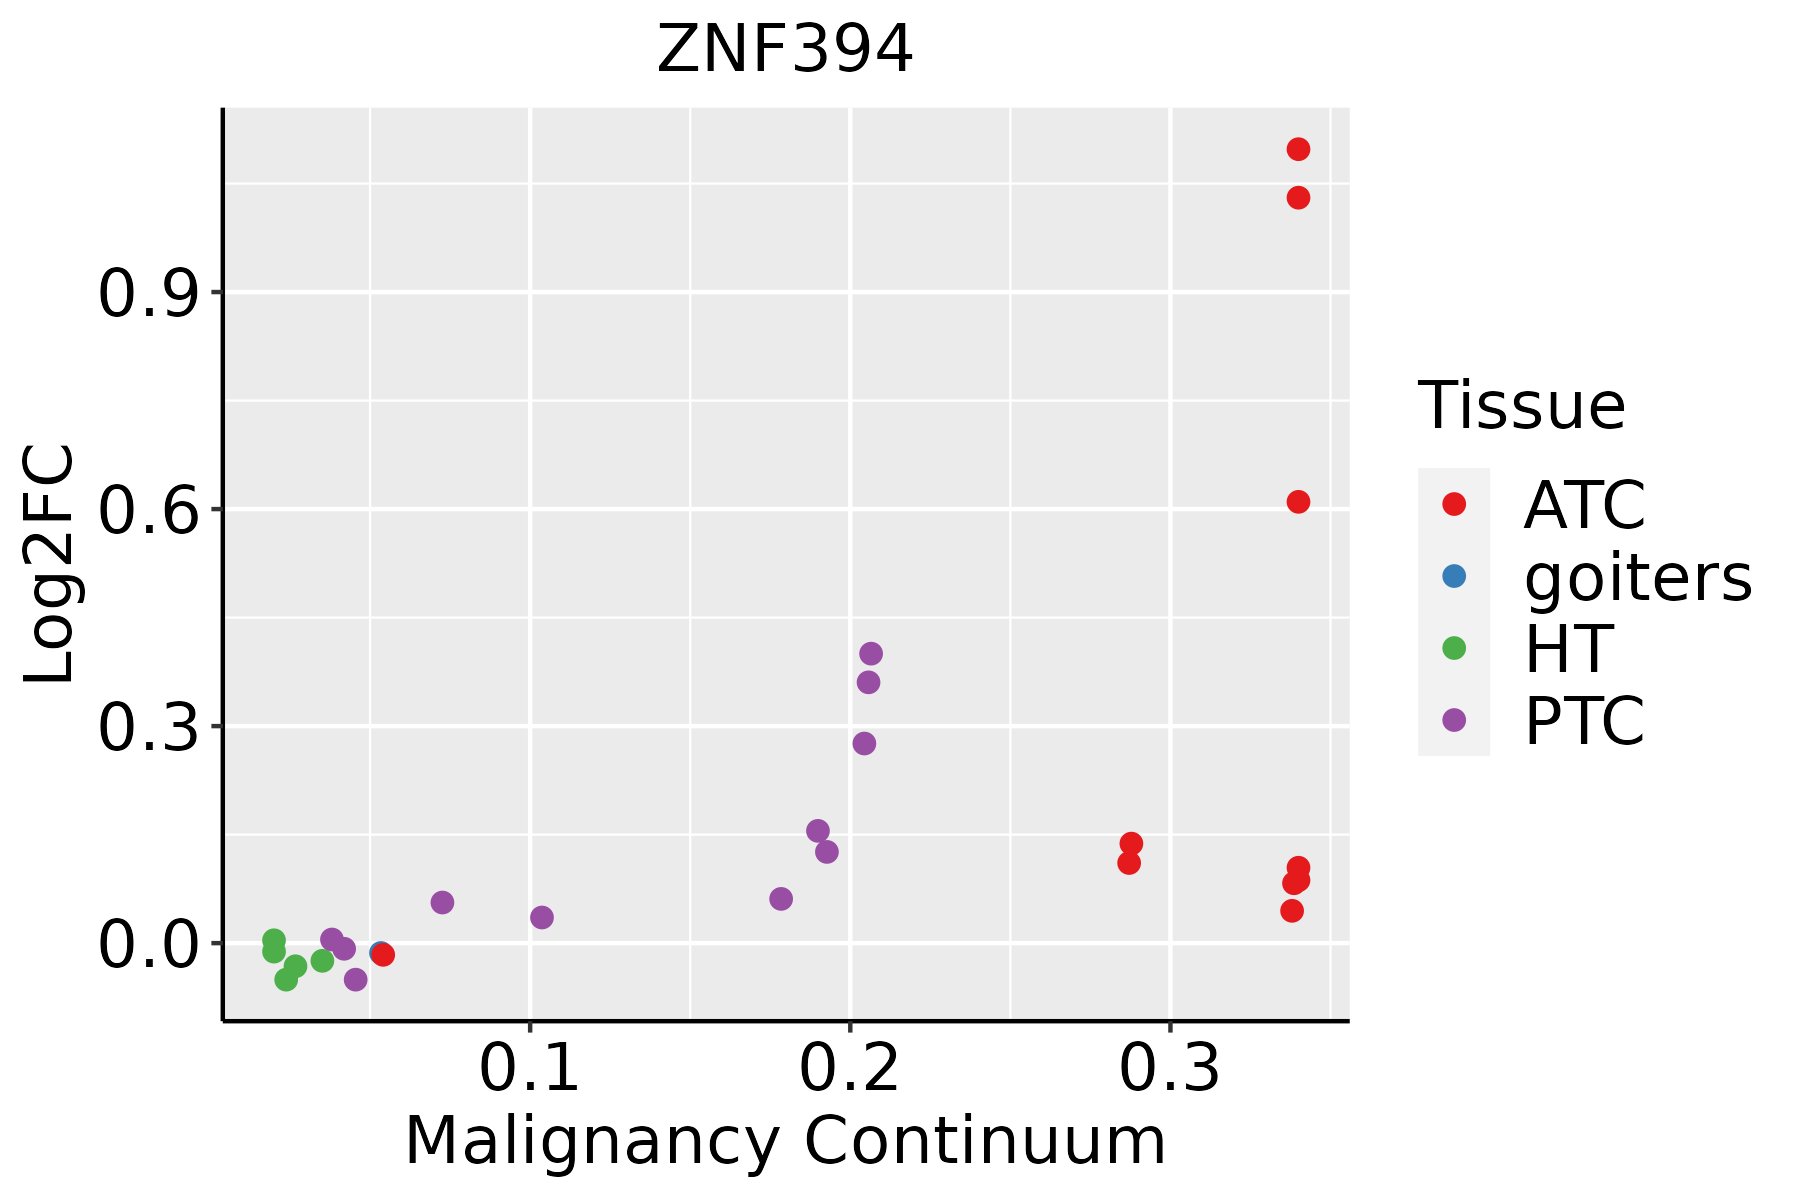 | ATC: Anaplastic thyroid cancer |
| HT: Hashimoto's thyroiditis | ||
| PTC: Papillary thyroid cancer |
| ∗log2FC in expression of this searched gene in stem-like cells from each diseased tissue sample relative to stem-like cells in normal samples in each tissue plotted against the malignancy continuum. Samples are colored based on if they are from different disease stage. |
Top |
Malignant transformation related pathway analysis |
| Find out the enriched GO biological processes and KEGG pathways involved in transition from healthy to precancer to cancer |
| Tissue | Disease Stage | Enriched GO biological Processes |
| Colorectum | AD |  |
| Colorectum | SER |  |
| Colorectum | MSS |  |
| Colorectum | MSI-H |  |
| Colorectum | FAP |  |
| ∗Top 15 enriched GO BP terms are showed in the bar plot of each disease state in each tissue. Each row represents a significant GO biological process which is colored according to the -log10(p.adjust). |
| Page: 1 2 3 4 5 6 7 8 9 |
| GO ID | Tissue | Disease Stage | Description | Gene Ratio | Bg Ratio | pvalue | p.adjust | Count |
| Page: 1 |
| Pathway ID | Tissue | Disease Stage | Description | Gene Ratio | Bg Ratio | pvalue | p.adjust | qvalue | Count |
| Page: 1 |
Top |
Cell-cell communication analysis |
| Identification of potential cell-cell interactions between two cell types and their ligand-receptor pairs for different disease states |
| Ligand | Receptor | LRpair | Pathway | Tissue | Disease Stage |
| Page: 1 |
Top |
Single-cell gene regulatory network inference analysis |
| Find out the significant the regulons (TFs) and the target genes of each regulon across cell types for different disease states |
| TF | Cell Type | Tissue | Disease Stage | Target Gene | RSS | Regulon Activity |
| ZNF394 | CT | Colorectum | ADJ | KLHL13,FAM155A,IDH3B, etc. | 4.74e-02 |  |
| ZNF394 | SSC | Colorectum | ADJ | KLHL13,FAM155A,IDH3B, etc. | 8.61e-03 | |
| ZNF394 | PERI | Oral cavity | LP | NAA35,PHACTR1,ADAMTS3, etc. | 1.26e-01 |  |
| ZNF394 | PERI | Oral cavity | OSCC | NAA35,PHACTR1,ADAMTS3, etc. | 1.18e-01 |  |
| ZNF394 | LYMEND | Skin | cSCC | NAP1L5,NAT14,PLPBP, etc. | 2.03e-01 |  |
| ZNF394 | PTC | Thyroid | Healthy | LIPA,MTERF4,RCHY1, etc. | 1.73e-02 |  |
| ∗The dot plots of a searched regulon are shown for all cell subpopulations in each disease state of each tissue based on the regulon specific score inferred using pySCENIC and by calculating the average expression. |
| Page: 1 |
Top |
Somatic mutation of malignant transformation related genes |
| Annotation of somatic variants for genes involved in malignant transformation |
| Hugo Symbol | Variant Class | Variant Classification | dbSNP RS | HGVSc | HGVSp | HGVSp Short | SWISSPROT | BIOTYPE | SIFT | PolyPhen | Tumor Sample Barcode | Tissue | Histology | Sex | Age | Stage | Therapy Types | Drugs | Outcome |
| ZNF394 | SNV | Missense_Mutation | c.38N>G | p.Asp13Gly | p.D13G | Q53GI3 | protein_coding | tolerated_low_confidence(0.18) | benign(0.001) | TCGA-A2-A0T0-01 | Breast | breast invasive carcinoma | Female | <65 | I/II | Chemotherapy | taxotere | SD | |
| ZNF394 | SNV | Missense_Mutation | novel | c.728N>G | p.Val243Gly | p.V243G | Q53GI3 | protein_coding | tolerated(0.11) | benign(0) | TCGA-A8-A0A6-01 | Breast | breast invasive carcinoma | Female | <65 | III/IV | Chemotherapy | epirubicin | CR |
| ZNF394 | SNV | Missense_Mutation | novel | c.428N>G | p.Gln143Arg | p.Q143R | Q53GI3 | protein_coding | tolerated(0.18) | benign(0.015) | TCGA-AC-A3EH-01 | Breast | breast invasive carcinoma | Female | >=65 | III/IV | Unknown | Unknown | SD |
| ZNF394 | SNV | Missense_Mutation | novel | c.821G>T | p.Gly274Val | p.G274V | Q53GI3 | protein_coding | tolerated(0.55) | benign(0.005) | TCGA-AC-A5EH-01 | Breast | breast invasive carcinoma | Female | >=65 | I/II | Unknown | Unknown | SD |
| ZNF394 | SNV | Missense_Mutation | novel | c.519C>A | p.Asp173Glu | p.D173E | Q53GI3 | protein_coding | tolerated(0.52) | benign(0.127) | TCGA-AC-A6IX-01 | Breast | breast invasive carcinoma | Female | <65 | III/IV | Unknown | Unknown | SD |
| ZNF394 | SNV | Missense_Mutation | c.206N>C | p.Gln69Pro | p.Q69P | Q53GI3 | protein_coding | deleterious(0.01) | possibly_damaging(0.825) | TCGA-BH-A18G-01 | Breast | breast invasive carcinoma | Female | >=65 | I/II | Unknown | Unknown | SD | |
| ZNF394 | SNV | Missense_Mutation | rs769653041 | c.1514G>A | p.Arg505His | p.R505H | Q53GI3 | protein_coding | deleterious(0.04) | benign(0.007) | TCGA-BH-A18J-01 | Breast | breast invasive carcinoma | Female | <65 | III/IV | Unknown | Unknown | PD |
| ZNF394 | SNV | Missense_Mutation | c.190N>G | p.Arg64Gly | p.R64G | Q53GI3 | protein_coding | deleterious(0) | probably_damaging(0.982) | TCGA-C8-A26Y-01 | Breast | breast invasive carcinoma | Female | >=65 | I/II | Unknown | Unknown | SD | |
| ZNF394 | insertion | Nonsense_Mutation | novel | c.739_740insTTCAAACAACGCTCTGACCTCTTTAGACA | p.Ser247PhefsTer6 | p.S247Ffs*6 | Q53GI3 | protein_coding | TCGA-A8-A08H-01 | Breast | breast invasive carcinoma | Female | >=65 | I/II | Unknown | Unknown | SD | ||
| ZNF394 | insertion | Nonsense_Mutation | novel | c.1108_1109insCAAAGAATTCATCAAAATAAAGT | p.Arg370ProfsTer7 | p.R370Pfs*7 | Q53GI3 | protein_coding | TCGA-AO-A0J9-01 | Breast | breast invasive carcinoma | Female | <65 | III/IV | Chemotherapy | cyclophosphamide | PD |
| Page: 1 2 3 4 5 6 7 |
Top |
Related drugs of malignant transformation related genes |
| Identification of chemicals and drugs interact with genes involved in malignant transfromation |
| (DGIdb 4.0) |
| Entrez ID | Symbol | Category | Interaction Types | Drug Claim Name | Drug Name | PMIDs |
| Page: 1 |

Copyright 2023-Present -The University of Texas Health Science Center at Houston |