
|
|||||
|
 | |
| |
| |
| |
| |
| |
|
Gene: ZNF280D |
Gene summary for ZNF280D |
| Gene information | Species | Human | Gene symbol | ZNF280D | Gene ID | 54816 |
| Gene name | zinc finger protein 280D | |
| Gene Alias | SUHW4 | |
| Cytomap | 15q21.3 | |
| Gene Type | protein-coding | GO ID | GO:0006139 | UniProtAcc | Q6N043 |
Top |
Malignant transformation analysis |
| Identification of the aberrant gene expression in precancerous and cancerous lesions by comparing the gene expression of stem-like cells in diseased tissues with normal stem cells |
| Entrez ID | Symbol | Replicates | Species | Organ | Tissue | Adj P-value | Log2FC | Malignancy |
| 54816 | ZNF280D | P42T-E | Human | Esophagus | ESCC | 1.10e-25 | 5.67e-01 | 0.1175 |
| 54816 | ZNF280D | P44T-E | Human | Esophagus | ESCC | 3.53e-15 | 3.06e-01 | 0.1096 |
| 54816 | ZNF280D | P47T-E | Human | Esophagus | ESCC | 9.74e-15 | 3.24e-01 | 0.1067 |
| 54816 | ZNF280D | P48T-E | Human | Esophagus | ESCC | 8.35e-17 | 3.71e-01 | 0.0959 |
| 54816 | ZNF280D | P49T-E | Human | Esophagus | ESCC | 1.65e-12 | 9.48e-01 | 0.1768 |
| 54816 | ZNF280D | P52T-E | Human | Esophagus | ESCC | 3.25e-23 | 4.59e-01 | 0.1555 |
| 54816 | ZNF280D | P54T-E | Human | Esophagus | ESCC | 3.81e-21 | 3.82e-01 | 0.0975 |
| 54816 | ZNF280D | P56T-E | Human | Esophagus | ESCC | 3.15e-14 | 1.19e+00 | 0.1613 |
| 54816 | ZNF280D | P57T-E | Human | Esophagus | ESCC | 7.15e-22 | 4.52e-01 | 0.0926 |
| 54816 | ZNF280D | P61T-E | Human | Esophagus | ESCC | 5.36e-39 | 6.62e-01 | 0.099 |
| 54816 | ZNF280D | P62T-E | Human | Esophagus | ESCC | 8.69e-35 | 4.76e-01 | 0.1302 |
| 54816 | ZNF280D | P65T-E | Human | Esophagus | ESCC | 2.05e-25 | 4.31e-01 | 0.0978 |
| 54816 | ZNF280D | P74T-E | Human | Esophagus | ESCC | 2.33e-16 | 4.24e-01 | 0.1479 |
| 54816 | ZNF280D | P75T-E | Human | Esophagus | ESCC | 2.03e-22 | 4.96e-01 | 0.1125 |
| 54816 | ZNF280D | P76T-E | Human | Esophagus | ESCC | 9.90e-30 | 5.26e-01 | 0.1207 |
| 54816 | ZNF280D | P79T-E | Human | Esophagus | ESCC | 1.71e-27 | 4.10e-01 | 0.1154 |
| 54816 | ZNF280D | P80T-E | Human | Esophagus | ESCC | 8.68e-27 | 6.37e-01 | 0.155 |
| 54816 | ZNF280D | P82T-E | Human | Esophagus | ESCC | 1.02e-19 | 6.26e-01 | 0.1072 |
| 54816 | ZNF280D | P83T-E | Human | Esophagus | ESCC | 1.14e-25 | 6.15e-01 | 0.1738 |
| 54816 | ZNF280D | P84T-E | Human | Esophagus | ESCC | 1.64e-08 | 4.22e-01 | 0.0933 |
| Page: 1 2 3 4 5 6 |
| Tissue | Expression Dynamics | Abbreviation |
| Esophagus |  | ESCC: Esophageal squamous cell carcinoma |
| HGIN: High-grade intraepithelial neoplasias | ||
| LGIN: Low-grade intraepithelial neoplasias | ||
| Liver | 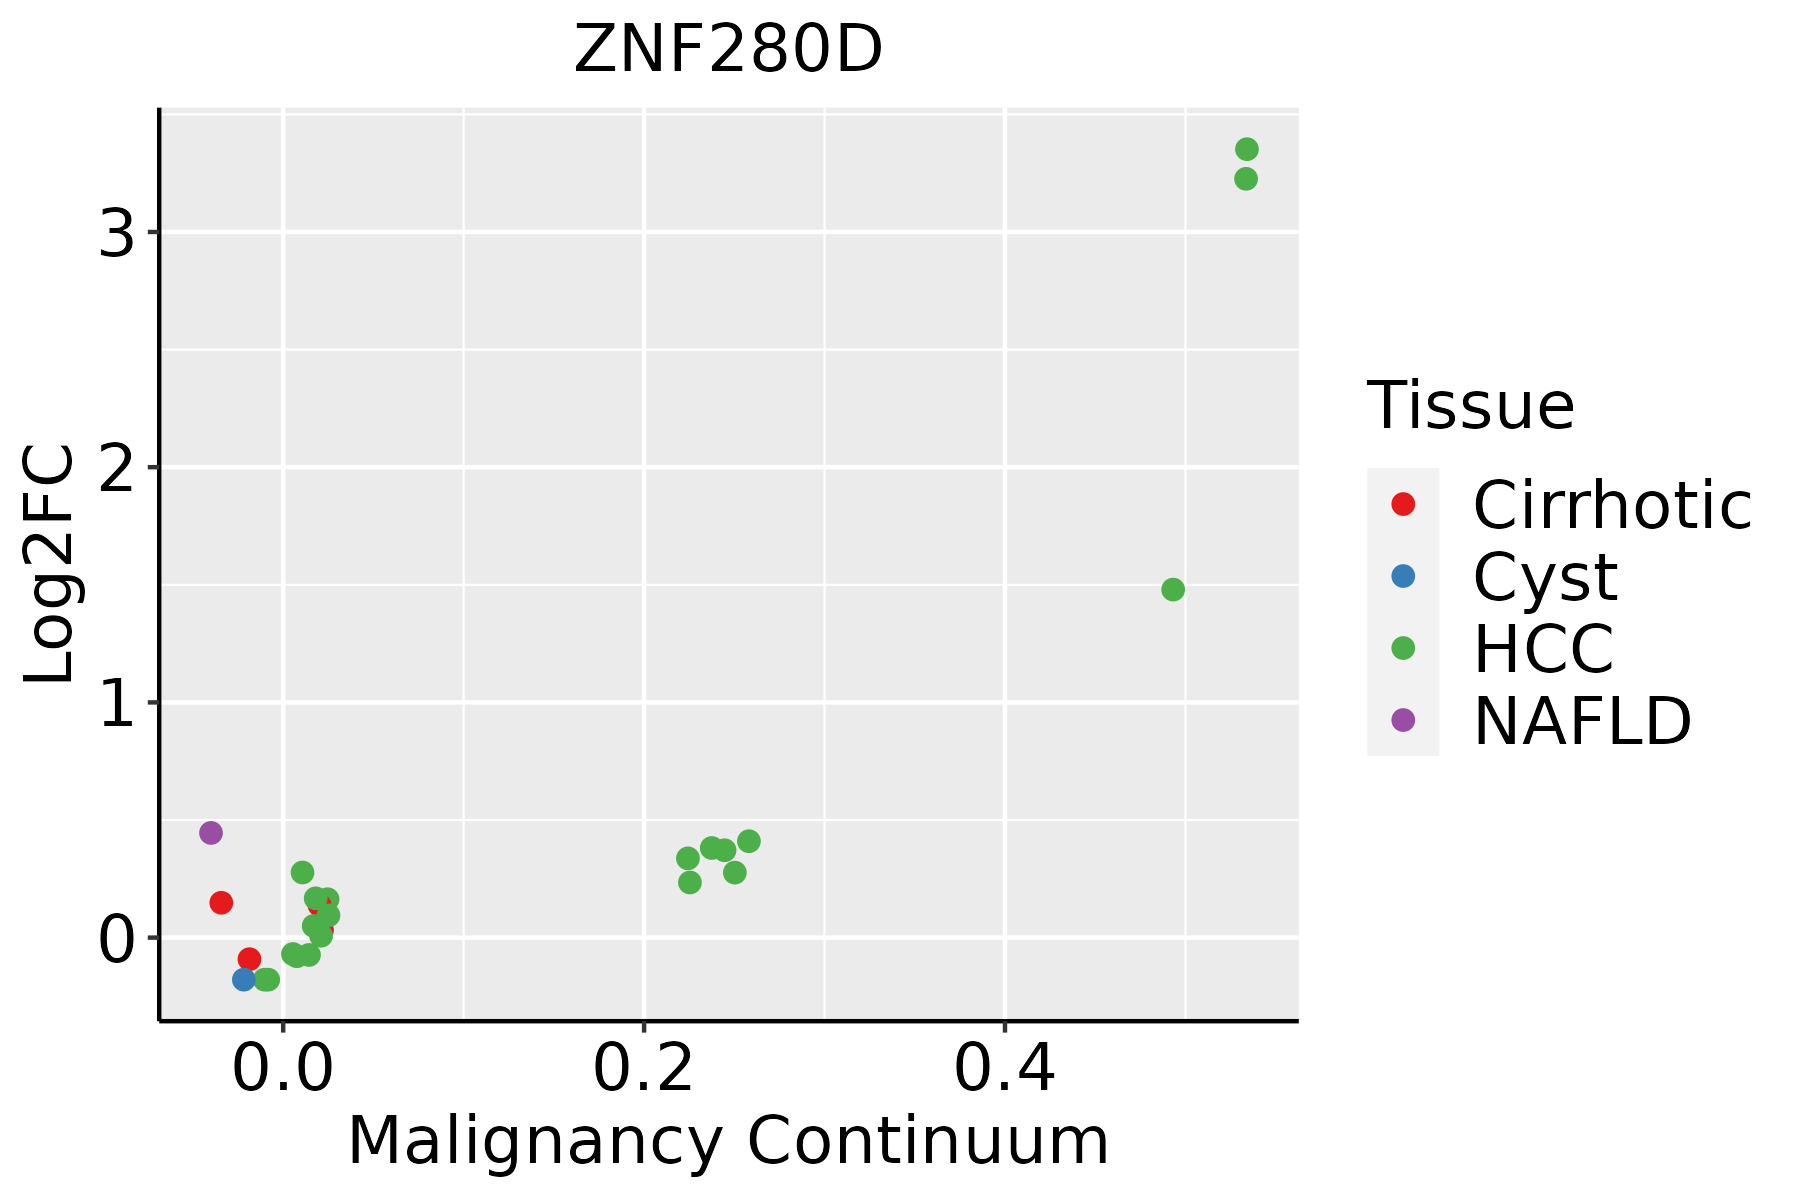 | HCC: Hepatocellular carcinoma |
| NAFLD: Non-alcoholic fatty liver disease | ||
| Oral Cavity |  | EOLP: Erosive Oral lichen planus |
| LP: leukoplakia | ||
| NEOLP: Non-erosive oral lichen planus | ||
| OSCC: Oral squamous cell carcinoma | ||
| Prostate |  | BPH: Benign Prostatic Hyperplasia |
| Thyroid | 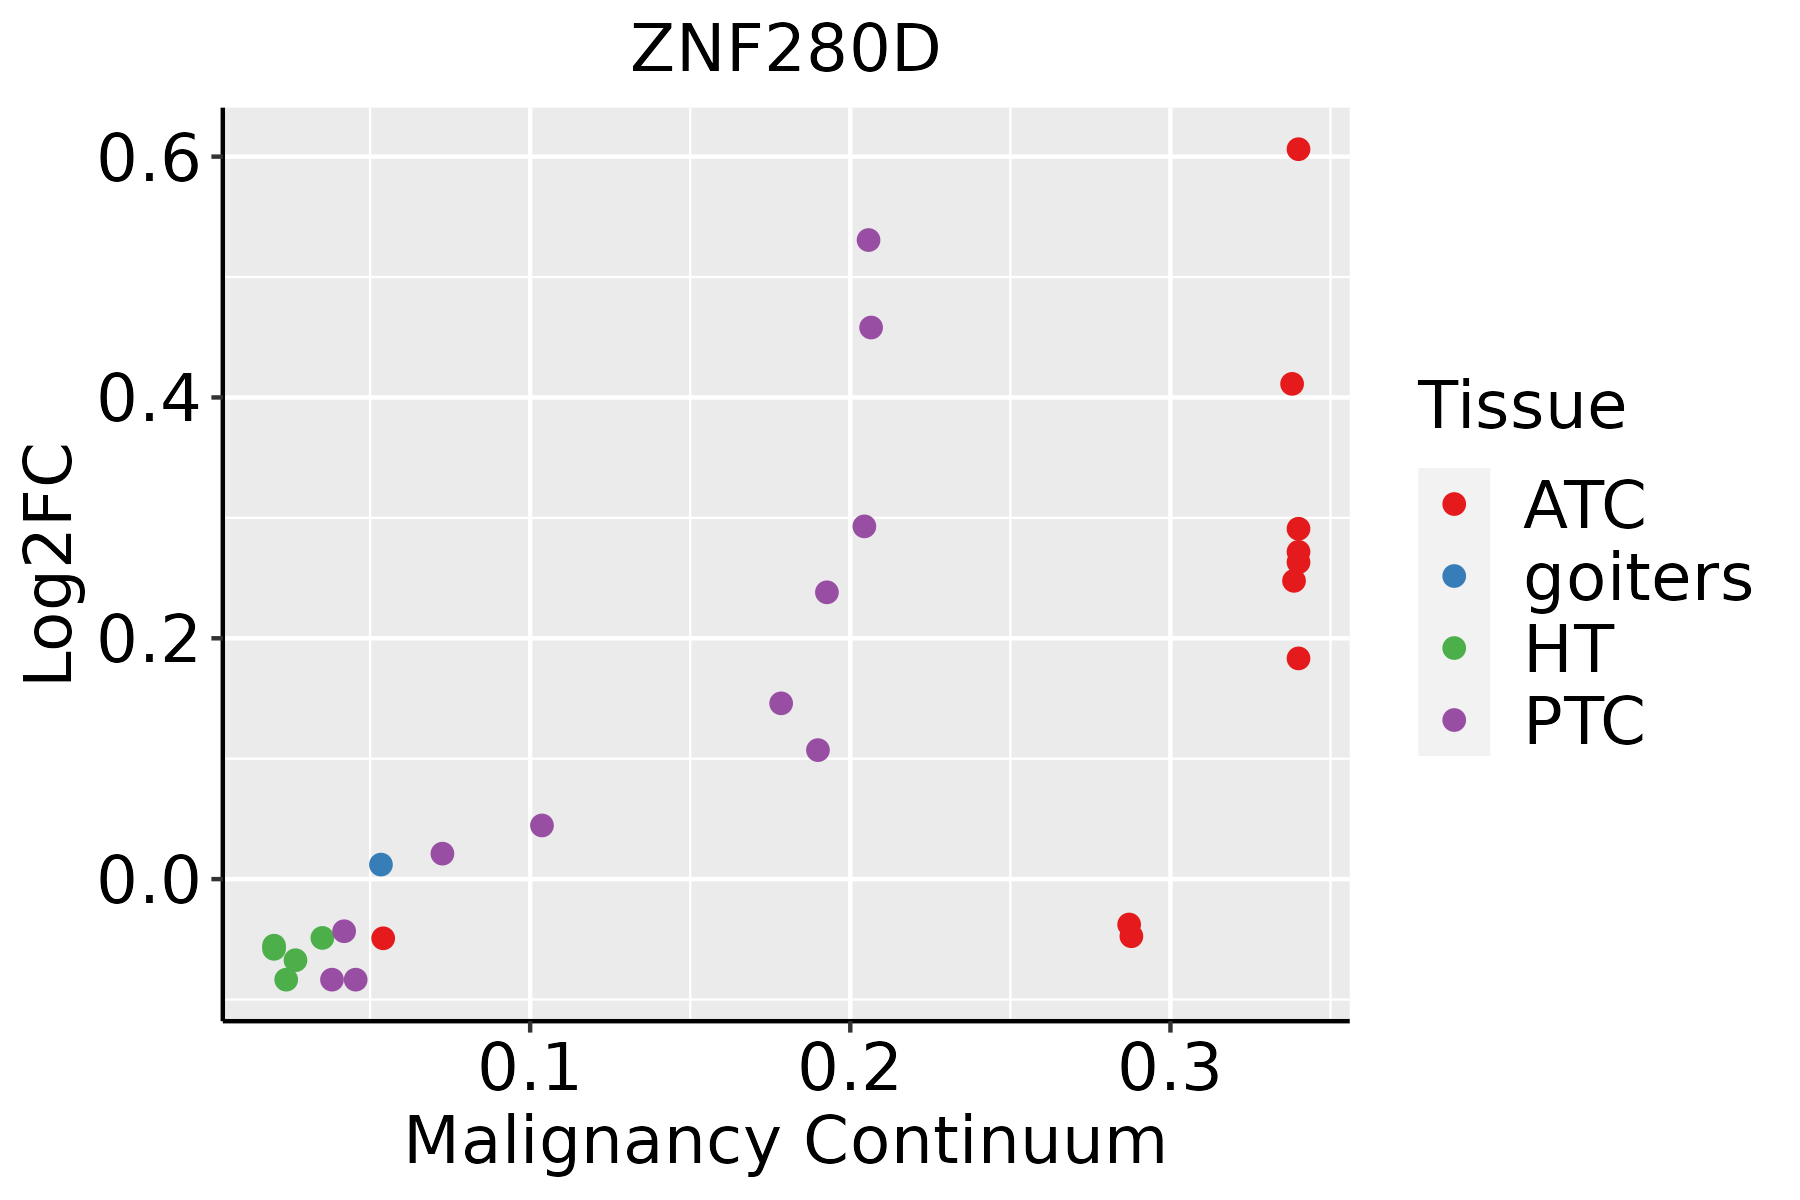 | ATC: Anaplastic thyroid cancer |
| HT: Hashimoto's thyroiditis | ||
| PTC: Papillary thyroid cancer |
| ∗log2FC in expression of this searched gene in stem-like cells from each diseased tissue sample relative to stem-like cells in normal samples in each tissue plotted against the malignancy continuum. Samples are colored based on if they are from different disease stage. |
Top |
Malignant transformation related pathway analysis |
| Find out the enriched GO biological processes and KEGG pathways involved in transition from healthy to precancer to cancer |
| Tissue | Disease Stage | Enriched GO biological Processes |
| Colorectum | AD |  |
| Colorectum | SER |  |
| Colorectum | MSS |  |
| Colorectum | MSI-H |  |
| Colorectum | FAP |  |
| ∗Top 15 enriched GO BP terms are showed in the bar plot of each disease state in each tissue. Each row represents a significant GO biological process which is colored according to the -log10(p.adjust). |
| Page: 1 2 3 4 5 6 7 8 9 |
| GO ID | Tissue | Disease Stage | Description | Gene Ratio | Bg Ratio | pvalue | p.adjust | Count |
| Page: 1 |
| Pathway ID | Tissue | Disease Stage | Description | Gene Ratio | Bg Ratio | pvalue | p.adjust | qvalue | Count |
| Page: 1 |
Top |
Cell-cell communication analysis |
| Identification of potential cell-cell interactions between two cell types and their ligand-receptor pairs for different disease states |
| Ligand | Receptor | LRpair | Pathway | Tissue | Disease Stage |
| Page: 1 |
Top |
Single-cell gene regulatory network inference analysis |
| Find out the significant the regulons (TFs) and the target genes of each regulon across cell types for different disease states |
| TF | Cell Type | Tissue | Disease Stage | Target Gene | RSS | Regulon Activity |
| ∗The dot plots of a searched regulon are shown for all cell subpopulations in each disease state of each tissue based on the regulon specific score inferred using pySCENIC and by calculating the average expression. |
| Page: 1 |
Top |
Somatic mutation of malignant transformation related genes |
| Annotation of somatic variants for genes involved in malignant transformation |
| Hugo Symbol | Variant Class | Variant Classification | dbSNP RS | HGVSc | HGVSp | HGVSp Short | SWISSPROT | BIOTYPE | SIFT | PolyPhen | Tumor Sample Barcode | Tissue | Histology | Sex | Age | Stage | Therapy Types | Drugs | Outcome |
| ZNF280D | SNV | Missense_Mutation | c.2923G>A | p.Glu975Lys | p.E975K | Q6N043 | protein_coding | tolerated_low_confidence(0.08) | benign(0.015) | TCGA-AC-A23H-01 | Breast | breast invasive carcinoma | Female | >=65 | I/II | Unknown | Unknown | PD | |
| ZNF280D | SNV | Missense_Mutation | novel | c.647N>A | p.Ser216Tyr | p.S216Y | Q6N043 | protein_coding | tolerated(0.05) | possibly_damaging(0.646) | TCGA-AC-A3W6-01 | Breast | breast invasive carcinoma | Female | >=65 | III/IV | Unknown | Unknown | SD |
| ZNF280D | SNV | Missense_Mutation | rs866653627 | c.2773G>A | p.Glu925Lys | p.E925K | Q6N043 | protein_coding | deleterious(0) | probably_damaging(0.943) | TCGA-AN-A046-01 | Breast | breast invasive carcinoma | Female | >=65 | I/II | Unknown | Unknown | SD |
| ZNF280D | SNV | Missense_Mutation | novel | c.1730N>T | p.Thr577Ile | p.T577I | Q6N043 | protein_coding | tolerated(0.05) | benign(0.046) | TCGA-B6-A3ZX-01 | Breast | breast invasive carcinoma | Female | <65 | III/IV | Chemotherapy | cyclophosphamide | PD |
| ZNF280D | insertion | Frame_Shift_Ins | novel | c.1718_1719insAATTTTGAAAAAAGCACATA | p.Ser573ArgfsTer49 | p.S573Rfs*49 | Q6N043 | protein_coding | TCGA-AO-A128-01 | Breast | breast invasive carcinoma | Female | <65 | I/II | Chemotherapy | doxorubicin | SD | ||
| ZNF280D | SNV | Missense_Mutation | novel | c.158N>T | p.Ser53Leu | p.S53L | Q6N043 | protein_coding | deleterious(0.02) | benign(0.244) | TCGA-JW-A5VL-01 | Cervix | cervical & endocervical cancer | Female | <65 | I/II | Unknown | Unknown | SD |
| ZNF280D | SNV | Missense_Mutation | novel | c.2726N>G | p.Asp909Gly | p.D909G | Q6N043 | protein_coding | deleterious(0.05) | probably_damaging(0.946) | TCGA-ZJ-AAX4-01 | Cervix | cervical & endocervical cancer | Female | >=65 | I/II | Unknown | Unknown | SD |
| ZNF280D | insertion | Frame_Shift_Ins | rs747375742 | c.2376_2377insCTTT | p.Gly793LeufsTer9 | p.G793Lfs*9 | Q6N043 | protein_coding | TCGA-DS-A1OC-01 | Cervix | cervical & endocervical cancer | Female | <65 | I/II | Chemotherapy | gemcitabine | SD | ||
| ZNF280D | SNV | Missense_Mutation | novel | c.2680G>T | p.Asp894Tyr | p.D894Y | Q6N043 | protein_coding | deleterious(0) | possibly_damaging(0.459) | TCGA-5M-AAT5-01 | Colorectum | colon adenocarcinoma | Unknown | Unknown | I/II | Unknown | Unknown | Unknown |
| ZNF280D | SNV | Missense_Mutation | c.1924A>G | p.Thr642Ala | p.T642A | Q6N043 | protein_coding | tolerated(0.52) | benign(0.009) | TCGA-AA-3977-01 | Colorectum | colon adenocarcinoma | Male | >=65 | I/II | Unknown | Unknown | SD |
| Page: 1 2 3 4 5 6 7 8 9 10 |
Top |
Related drugs of malignant transformation related genes |
| Identification of chemicals and drugs interact with genes involved in malignant transfromation |
| (DGIdb 4.0) |
| Entrez ID | Symbol | Category | Interaction Types | Drug Claim Name | Drug Name | PMIDs |
| Page: 1 |

Copyright 2023-Present -The University of Texas Health Science Center at Houston |