
|
|||||
|
 | |
| |
| |
| |
| |
| |
|
Gene: ZHX1 |
Gene summary for ZHX1 |
| Gene information | Species | Human | Gene symbol | ZHX1 | Gene ID | 11244 |
| Gene name | zinc fingers and homeoboxes 1 | |
| Gene Alias | ZHX1 | |
| Cytomap | 8q24.13 | |
| Gene Type | protein-coding | GO ID | GO:0000122 | UniProtAcc | A0A024R9F1 |
Top |
Malignant transformation analysis |
| Identification of the aberrant gene expression in precancerous and cancerous lesions by comparing the gene expression of stem-like cells in diseased tissues with normal stem cells |
| Entrez ID | Symbol | Replicates | Species | Organ | Tissue | Adj P-value | Log2FC | Malignancy |
| 11244 | ZHX1 | P62T-E | Human | Esophagus | ESCC | 1.27e-51 | 8.98e-01 | 0.1302 |
| 11244 | ZHX1 | P65T-E | Human | Esophagus | ESCC | 8.77e-15 | 1.38e-01 | 0.0978 |
| 11244 | ZHX1 | P74T-E | Human | Esophagus | ESCC | 5.44e-42 | 1.15e+00 | 0.1479 |
| 11244 | ZHX1 | P75T-E | Human | Esophagus | ESCC | 1.92e-24 | 5.44e-01 | 0.1125 |
| 11244 | ZHX1 | P76T-E | Human | Esophagus | ESCC | 9.32e-13 | 2.64e-01 | 0.1207 |
| 11244 | ZHX1 | P79T-E | Human | Esophagus | ESCC | 6.14e-14 | 2.96e-01 | 0.1154 |
| 11244 | ZHX1 | P80T-E | Human | Esophagus | ESCC | 5.82e-32 | 1.15e+00 | 0.155 |
| 11244 | ZHX1 | P82T-E | Human | Esophagus | ESCC | 4.16e-11 | 6.02e-01 | 0.1072 |
| 11244 | ZHX1 | P83T-E | Human | Esophagus | ESCC | 1.17e-49 | 1.32e+00 | 0.1738 |
| 11244 | ZHX1 | P84T-E | Human | Esophagus | ESCC | 8.27e-03 | 2.37e-01 | 0.0933 |
| 11244 | ZHX1 | P89T-E | Human | Esophagus | ESCC | 4.93e-16 | 1.31e+00 | 0.1752 |
| 11244 | ZHX1 | P91T-E | Human | Esophagus | ESCC | 7.32e-12 | 1.27e+00 | 0.1828 |
| 11244 | ZHX1 | P107T-E | Human | Esophagus | ESCC | 8.07e-16 | 4.32e-01 | 0.171 |
| 11244 | ZHX1 | P126T-E | Human | Esophagus | ESCC | 8.80e-04 | 7.44e-01 | 0.1125 |
| 11244 | ZHX1 | P127T-E | Human | Esophagus | ESCC | 7.96e-12 | 2.60e-01 | 0.0826 |
| 11244 | ZHX1 | P128T-E | Human | Esophagus | ESCC | 5.89e-27 | 8.31e-01 | 0.1241 |
| 11244 | ZHX1 | P130T-E | Human | Esophagus | ESCC | 2.01e-17 | 3.95e-01 | 0.1676 |
| 11244 | ZHX1 | HCC1_Meng | Human | Liver | HCC | 1.43e-79 | 3.64e-01 | 0.0246 |
| 11244 | ZHX1 | HCC2_Meng | Human | Liver | HCC | 1.31e-26 | 1.07e-01 | 0.0107 |
| 11244 | ZHX1 | cirrhotic2 | Human | Liver | Cirrhotic | 3.42e-07 | 7.07e-02 | 0.0201 |
| Page: 1 2 3 4 5 6 |
| Tissue | Expression Dynamics | Abbreviation |
| Esophagus | 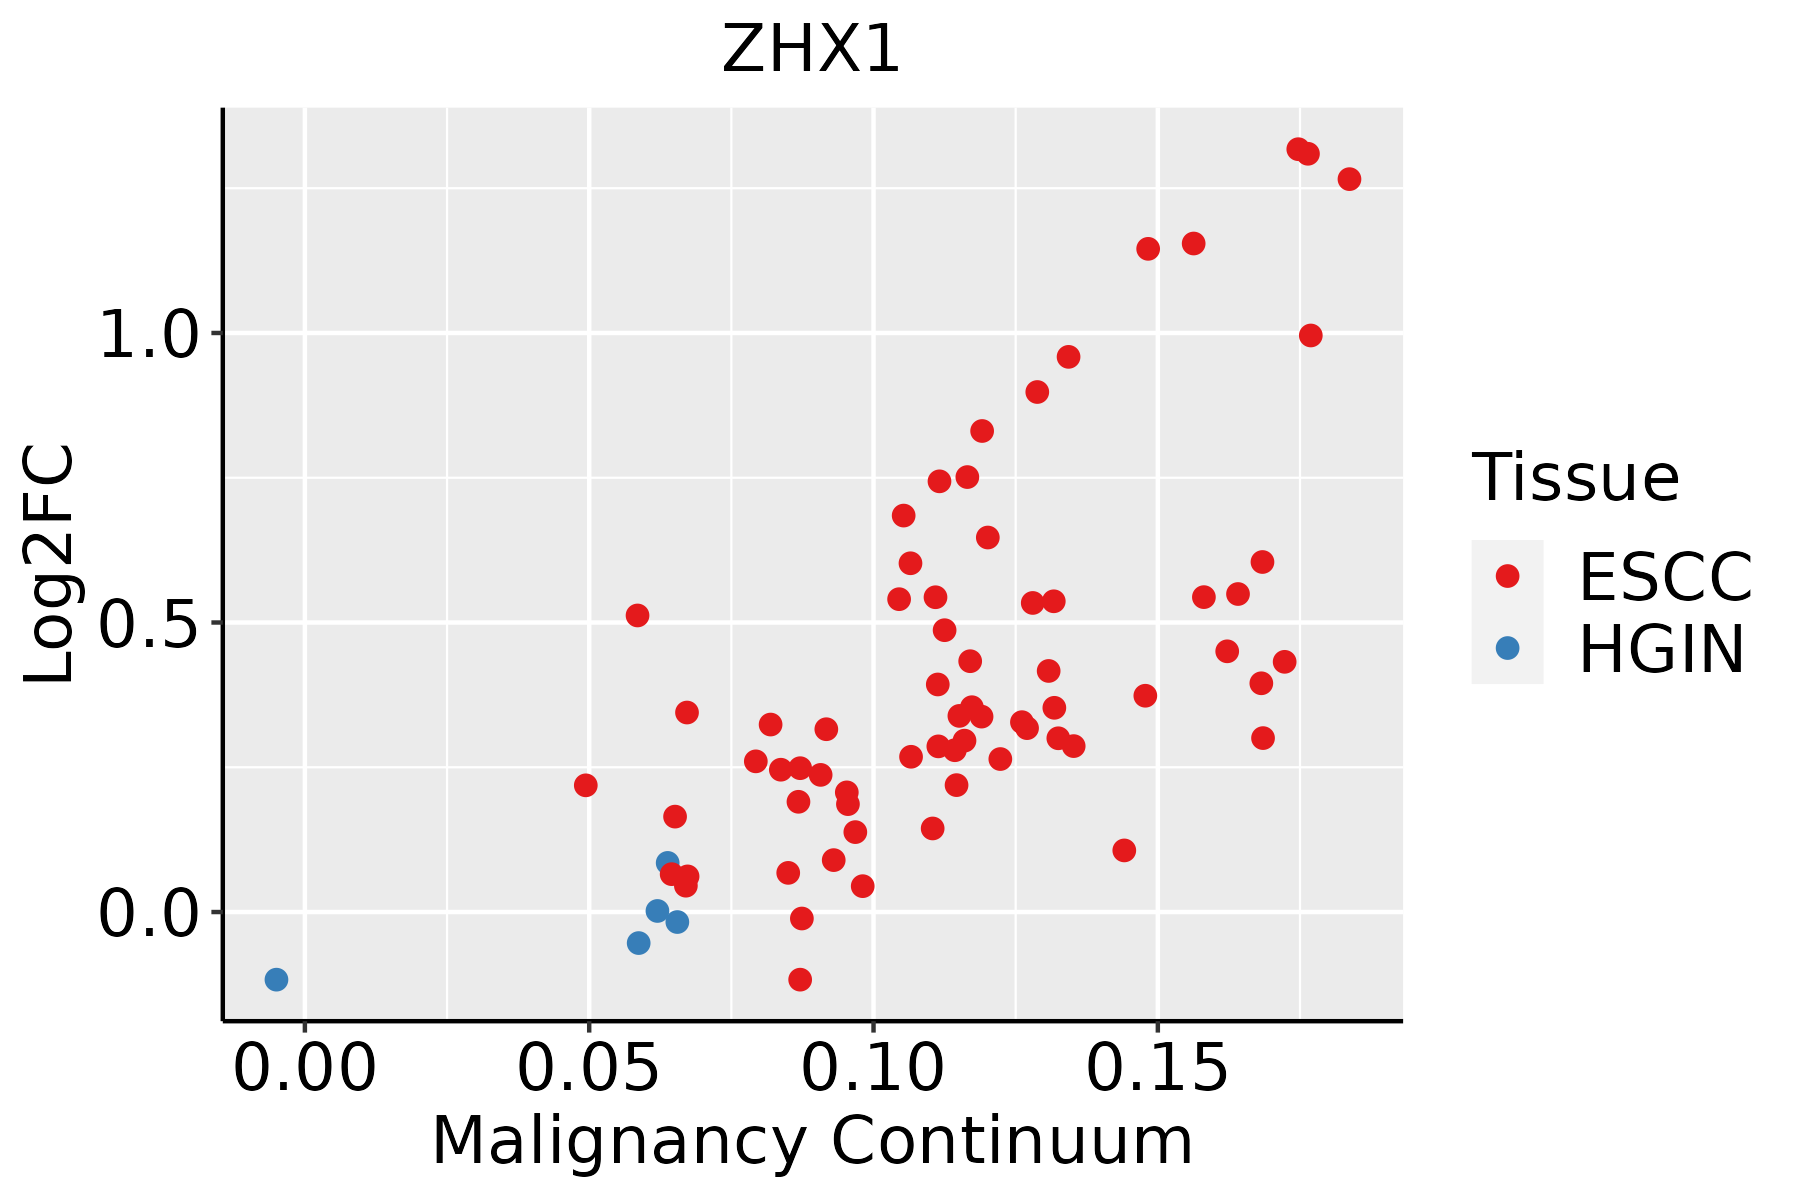 | ESCC: Esophageal squamous cell carcinoma |
| HGIN: High-grade intraepithelial neoplasias | ||
| LGIN: Low-grade intraepithelial neoplasias | ||
| Liver | 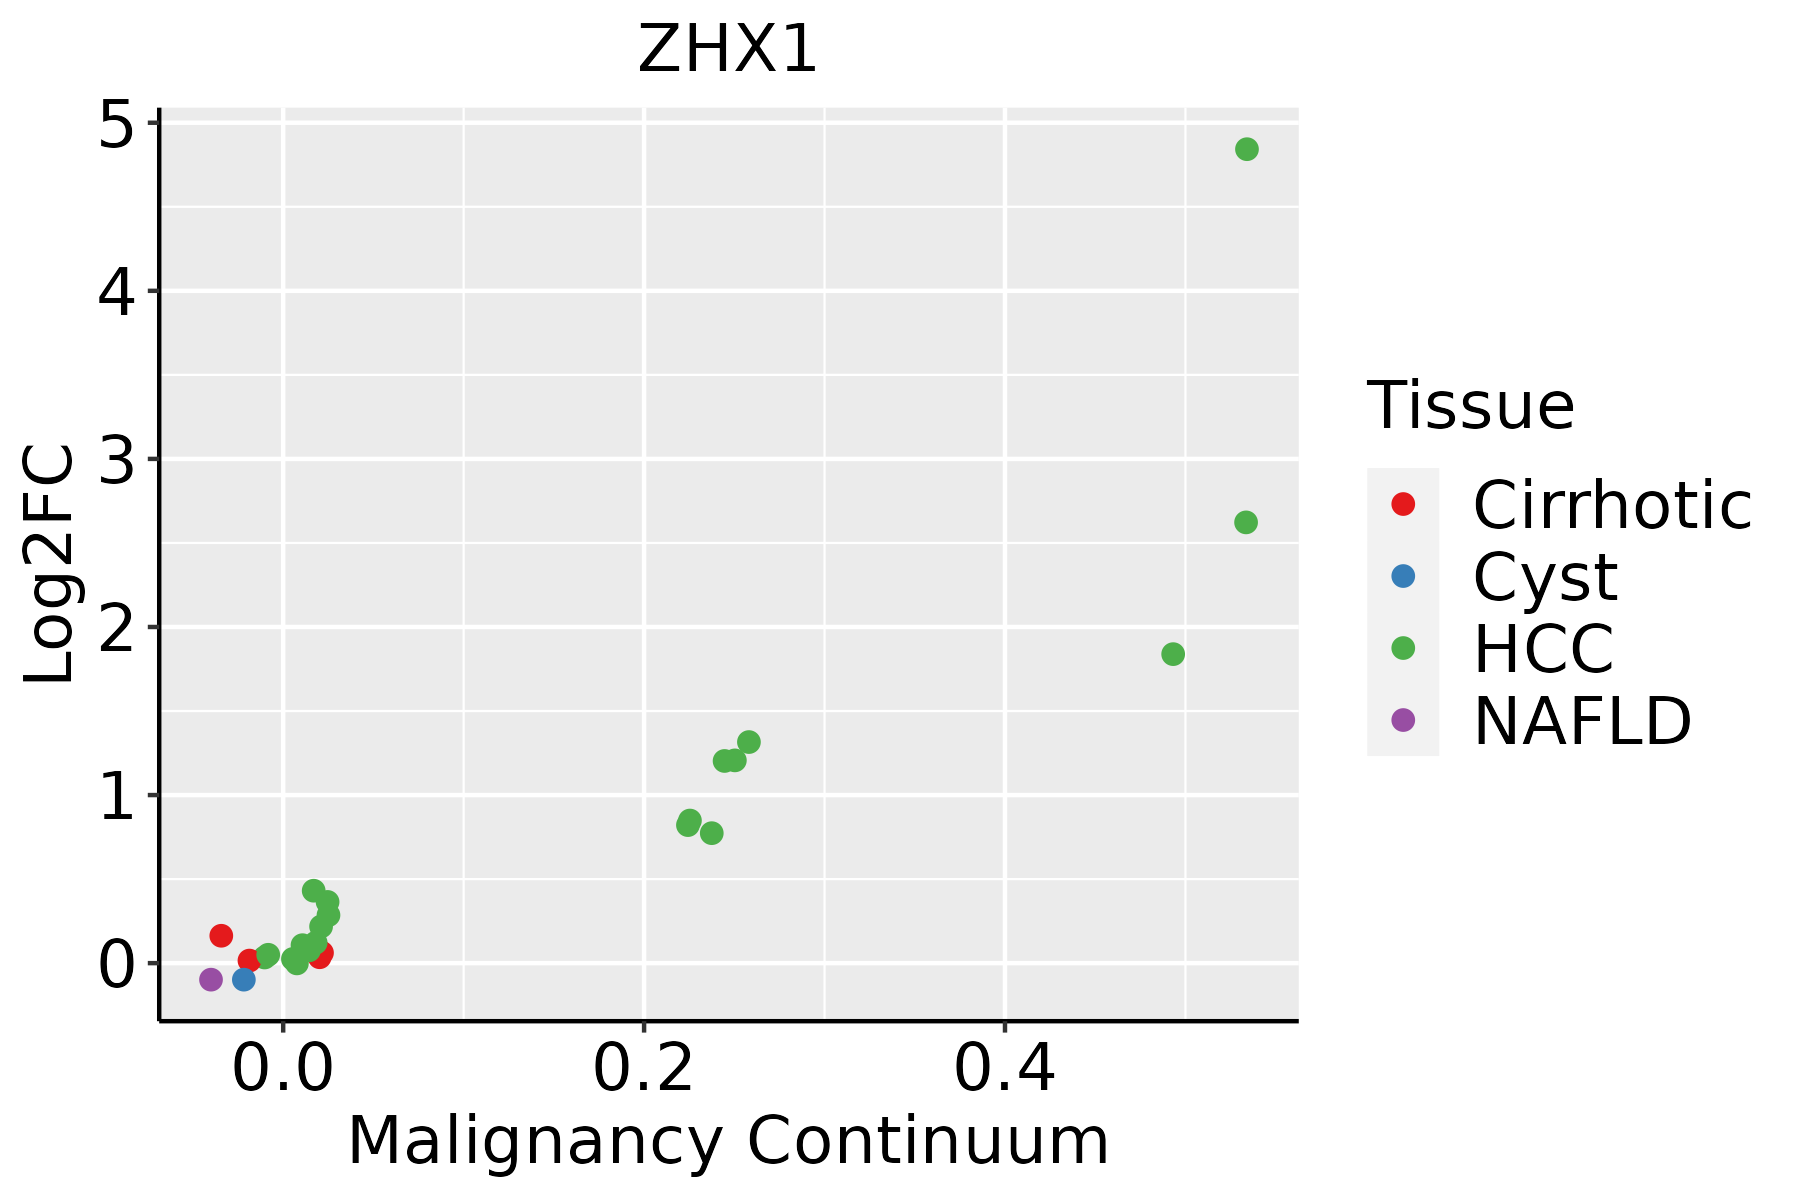 | HCC: Hepatocellular carcinoma |
| NAFLD: Non-alcoholic fatty liver disease | ||
| Oral Cavity | 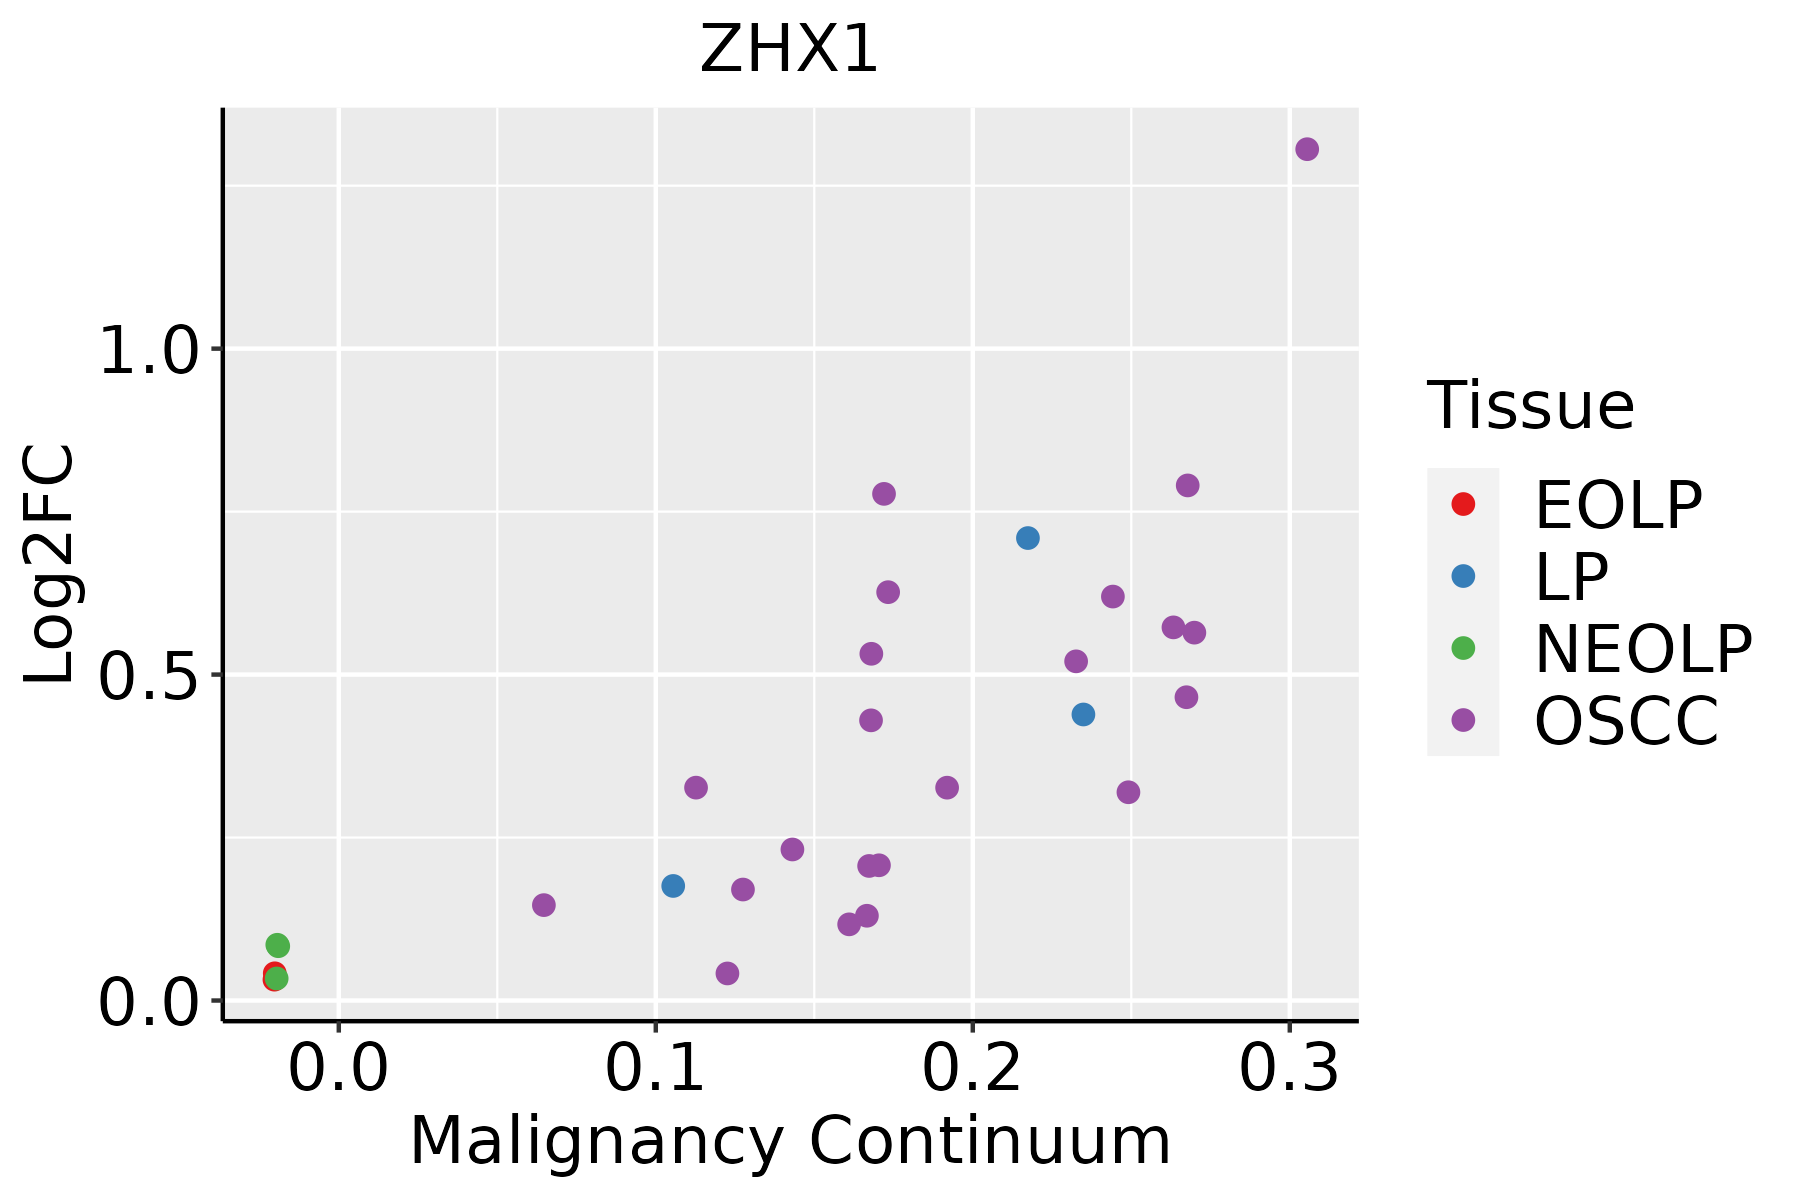 | EOLP: Erosive Oral lichen planus |
| LP: leukoplakia | ||
| NEOLP: Non-erosive oral lichen planus | ||
| OSCC: Oral squamous cell carcinoma | ||
| Skin | 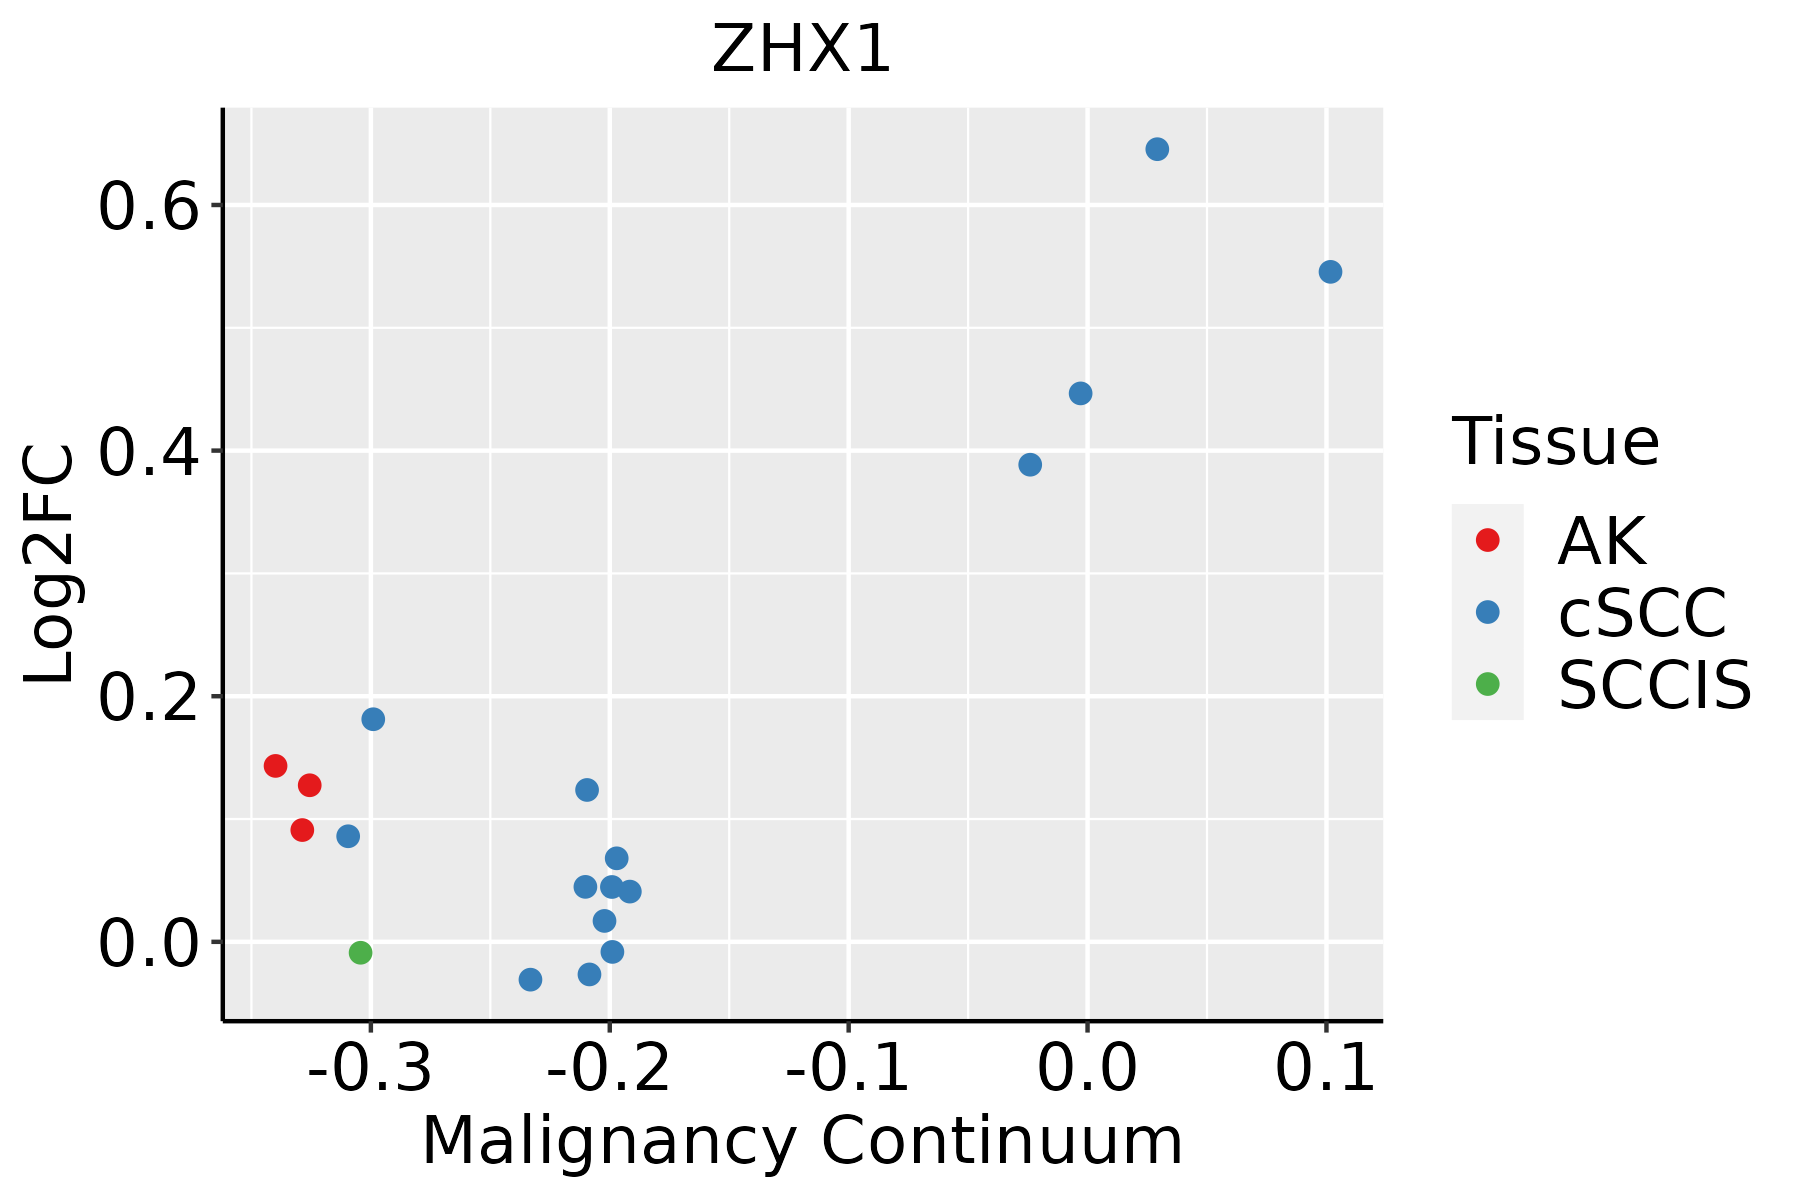 | AK: Actinic keratosis |
| cSCC: Cutaneous squamous cell carcinoma | ||
| SCCIS:squamous cell carcinoma in situ | ||
| Thyroid | 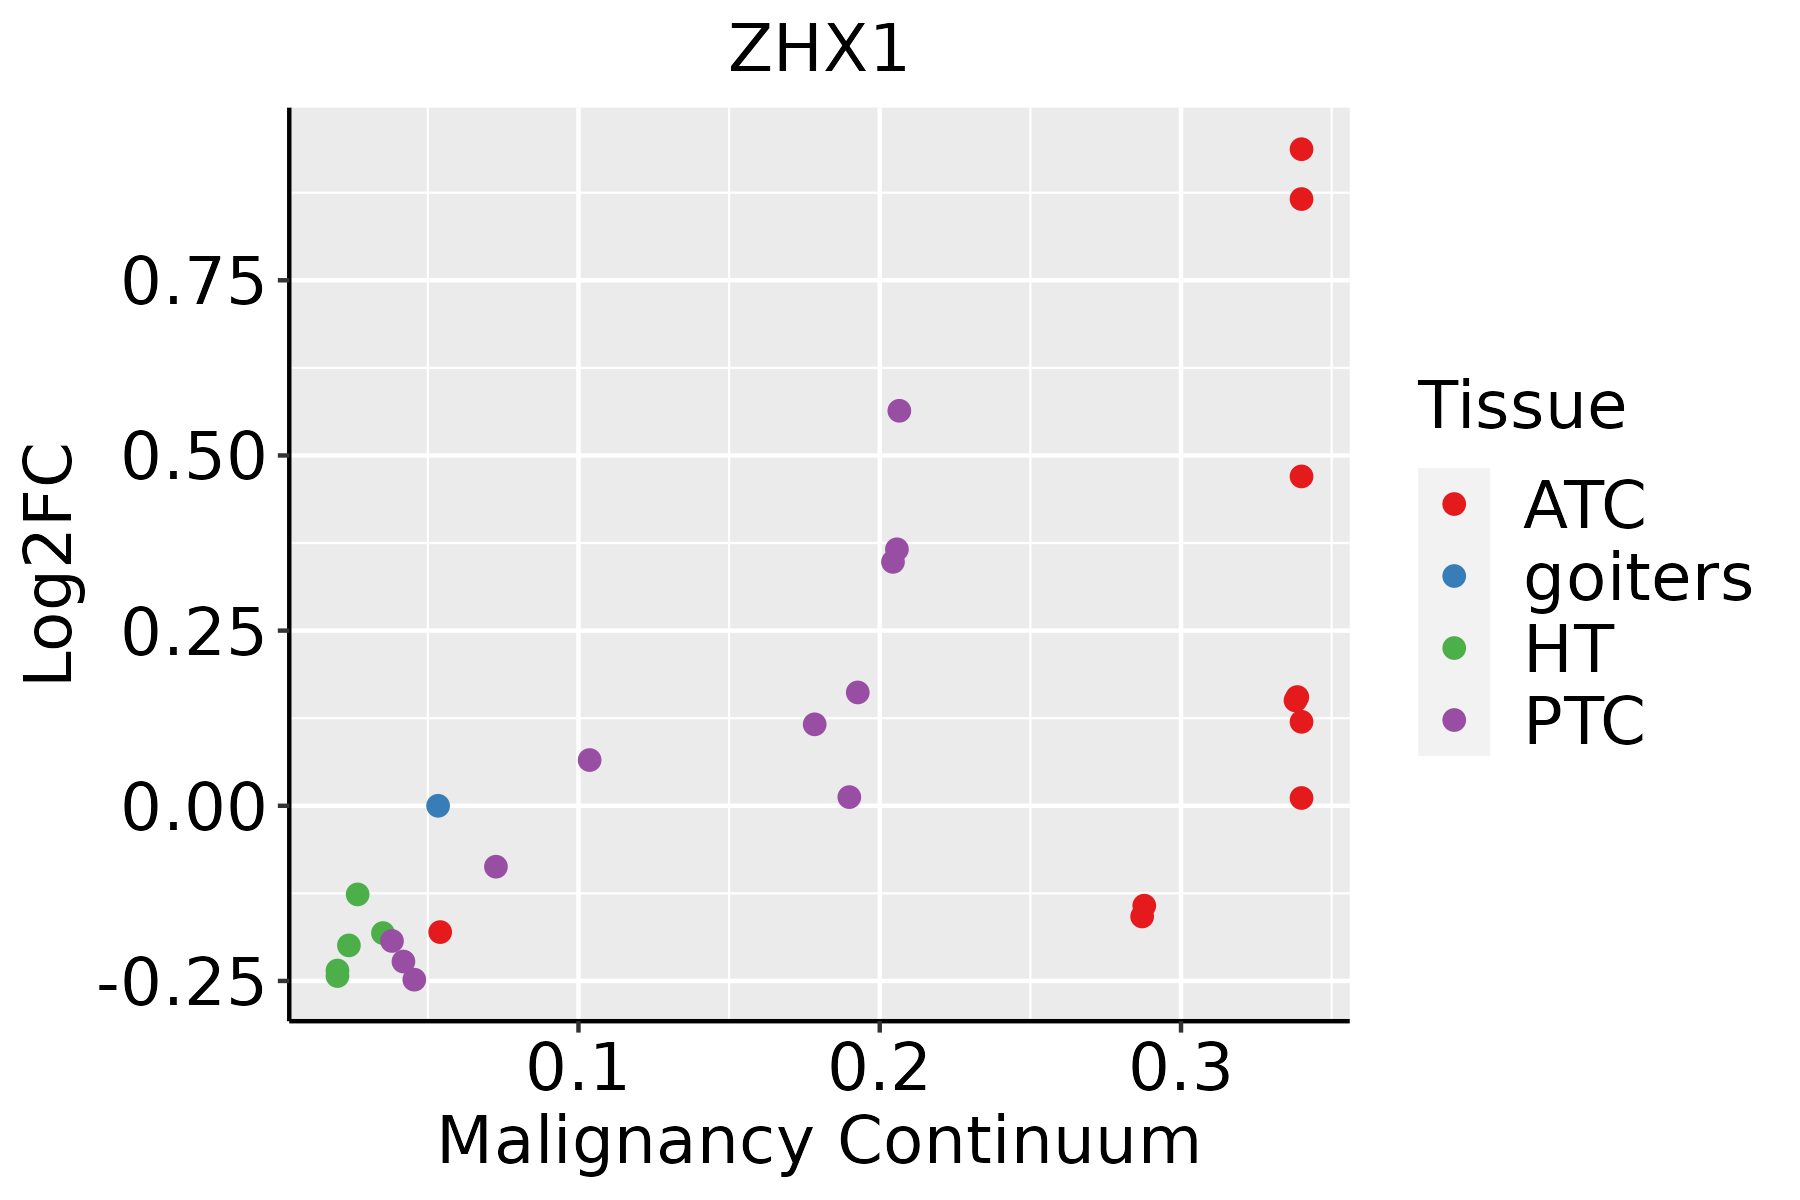 | ATC: Anaplastic thyroid cancer |
| HT: Hashimoto's thyroiditis | ||
| PTC: Papillary thyroid cancer |
| ∗log2FC in expression of this searched gene in stem-like cells from each diseased tissue sample relative to stem-like cells in normal samples in each tissue plotted against the malignancy continuum. Samples are colored based on if they are from different disease stage. |
Top |
Malignant transformation related pathway analysis |
| Find out the enriched GO biological processes and KEGG pathways involved in transition from healthy to precancer to cancer |
| Tissue | Disease Stage | Enriched GO biological Processes |
| Colorectum | AD |  |
| Colorectum | SER |  |
| Colorectum | MSS |  |
| Colorectum | MSI-H |  |
| Colorectum | FAP |  |
| ∗Top 15 enriched GO BP terms are showed in the bar plot of each disease state in each tissue. Each row represents a significant GO biological process which is colored according to the -log10(p.adjust). |
| Page: 1 2 3 4 5 6 7 8 9 |
| GO ID | Tissue | Disease Stage | Description | Gene Ratio | Bg Ratio | pvalue | p.adjust | Count |
| Page: 1 |
| Pathway ID | Tissue | Disease Stage | Description | Gene Ratio | Bg Ratio | pvalue | p.adjust | qvalue | Count |
| Page: 1 |
Top |
Cell-cell communication analysis |
| Identification of potential cell-cell interactions between two cell types and their ligand-receptor pairs for different disease states |
| Ligand | Receptor | LRpair | Pathway | Tissue | Disease Stage |
| Page: 1 |
Top |
Single-cell gene regulatory network inference analysis |
| Find out the significant the regulons (TFs) and the target genes of each regulon across cell types for different disease states |
| TF | Cell Type | Tissue | Disease Stage | Target Gene | RSS | Regulon Activity |
| ∗The dot plots of a searched regulon are shown for all cell subpopulations in each disease state of each tissue based on the regulon specific score inferred using pySCENIC and by calculating the average expression. |
| Page: 1 |
Top |
Somatic mutation of malignant transformation related genes |
| Annotation of somatic variants for genes involved in malignant transformation |
| Hugo Symbol | Variant Class | Variant Classification | dbSNP RS | HGVSc | HGVSp | HGVSp Short | SWISSPROT | BIOTYPE | SIFT | PolyPhen | Tumor Sample Barcode | Tissue | Histology | Sex | Age | Stage | Therapy Types | Drugs | Outcome |
| ZHX1 | SNV | Missense_Mutation | c.1402N>T | p.Arg468Trp | p.R468W | Q9UKY1 | protein_coding | deleterious(0) | probably_damaging(0.97) | TCGA-A8-A07B-01 | Breast | breast invasive carcinoma | Female | >=65 | I/II | Unknown | Unknown | SD | |
| ZHX1 | SNV | Missense_Mutation | c.1342N>T | p.Pro448Ser | p.P448S | Q9UKY1 | protein_coding | tolerated(0.06) | benign(0.015) | TCGA-D8-A142-01 | Breast | breast invasive carcinoma | Female | >=65 | I/II | Chemotherapy | cyclophosphamid | SD | |
| ZHX1 | SNV | Missense_Mutation | c.512T>C | p.Val171Ala | p.V171A | Q9UKY1 | protein_coding | tolerated(0.85) | benign(0) | TCGA-EW-A1IZ-01 | Breast | breast invasive carcinoma | Female | <65 | III/IV | Chemotherapy | taxotere | SD | |
| ZHX1 | insertion | Frame_Shift_Ins | novel | c.882_883insGTTCATCAAC | p.Asn295ValfsTer10 | p.N295Vfs*10 | Q9UKY1 | protein_coding | TCGA-AN-A0FW-01 | Breast | breast invasive carcinoma | Female | >=65 | III/IV | Unknown | Unknown | SD | ||
| ZHX1 | insertion | Frame_Shift_Ins | novel | c.2333_2334insAA | p.Phe778LeufsTer14 | p.F778Lfs*14 | Q9UKY1 | protein_coding | TCGA-AR-A0TU-01 | Breast | breast invasive carcinoma | Female | <65 | I/II | Unspecific | Doxorubicin | SD | ||
| ZHX1 | insertion | Nonsense_Mutation | novel | c.2332_2333insAATAATTAAGACATTAAACTCTACATAATAA | p.Phe778Ter | p.F778* | Q9UKY1 | protein_coding | TCGA-AR-A0TU-01 | Breast | breast invasive carcinoma | Female | <65 | I/II | Unspecific | Doxorubicin | SD | ||
| ZHX1 | insertion | In_Frame_Ins | novel | c.2541_2543dupGGA | p.Glu847dup | p.E847dup | Q9UKY1 | protein_coding | TCGA-GM-A2DA-01 | Breast | breast invasive carcinoma | Female | <65 | I/II | Chemotherapy | fluorouracil | PD | ||
| ZHX1 | SNV | Missense_Mutation | novel | c.1159N>G | p.Thr387Ala | p.T387A | Q9UKY1 | protein_coding | deleterious(0) | possibly_damaging(0.458) | TCGA-2W-A8YY-01 | Cervix | cervical & endocervical cancer | Female | <65 | I/II | Chemotherapy | cisplatin | CR |
| ZHX1 | SNV | Missense_Mutation | rs754988142 | c.145N>A | p.Asp49Asn | p.D49N | Q9UKY1 | protein_coding | deleterious(0.03) | benign(0.022) | TCGA-C5-A3HE-01 | Cervix | cervical & endocervical cancer | Female | <65 | I/II | Unknown | Unknown | PD |
| ZHX1 | SNV | Missense_Mutation | c.549N>G | p.Ile183Met | p.I183M | Q9UKY1 | protein_coding | tolerated(0.05) | probably_damaging(0.997) | TCGA-DR-A0ZM-01 | Cervix | cervical & endocervical cancer | Female | <65 | III/IV | Unspecific | Cisplatin | SD |
| Page: 1 2 3 4 5 6 7 8 9 10 |
Top |
Related drugs of malignant transformation related genes |
| Identification of chemicals and drugs interact with genes involved in malignant transfromation |
| (DGIdb 4.0) |
| Entrez ID | Symbol | Category | Interaction Types | Drug Claim Name | Drug Name | PMIDs |
| Page: 1 |

Copyright 2023-Present -The University of Texas Health Science Center at Houston |