
|
|||||
|
 | |
| |
| |
| |
| |
| |
|
Gene: ZBTB43 |
Gene summary for ZBTB43 |
| Gene information | Species | Human | Gene symbol | ZBTB43 | Gene ID | 23099 |
| Gene name | zinc finger and BTB domain containing 43 | |
| Gene Alias | ZBTB22B | |
| Cytomap | 9q33.3 | |
| Gene Type | protein-coding | GO ID | GO:0006139 | UniProtAcc | O43298 |
Top |
Malignant transformation analysis |
| Identification of the aberrant gene expression in precancerous and cancerous lesions by comparing the gene expression of stem-like cells in diseased tissues with normal stem cells |
| Entrez ID | Symbol | Replicates | Species | Organ | Tissue | Adj P-value | Log2FC | Malignancy |
| 23099 | ZBTB43 | P61T-E | Human | Esophagus | ESCC | 2.58e-07 | 1.27e-01 | 0.099 |
| 23099 | ZBTB43 | P62T-E | Human | Esophagus | ESCC | 1.53e-39 | 8.84e-01 | 0.1302 |
| 23099 | ZBTB43 | P65T-E | Human | Esophagus | ESCC | 4.30e-12 | 1.30e-01 | 0.0978 |
| 23099 | ZBTB43 | P74T-E | Human | Esophagus | ESCC | 1.90e-17 | 7.01e-01 | 0.1479 |
| 23099 | ZBTB43 | P75T-E | Human | Esophagus | ESCC | 5.09e-54 | 1.20e+00 | 0.1125 |
| 23099 | ZBTB43 | P76T-E | Human | Esophagus | ESCC | 2.38e-10 | 2.07e-01 | 0.1207 |
| 23099 | ZBTB43 | P79T-E | Human | Esophagus | ESCC | 7.30e-11 | 2.14e-01 | 0.1154 |
| 23099 | ZBTB43 | P80T-E | Human | Esophagus | ESCC | 3.19e-39 | 1.31e+00 | 0.155 |
| 23099 | ZBTB43 | P82T-E | Human | Esophagus | ESCC | 1.78e-08 | 4.37e-01 | 0.1072 |
| 23099 | ZBTB43 | P83T-E | Human | Esophagus | ESCC | 3.77e-11 | 5.98e-01 | 0.1738 |
| 23099 | ZBTB43 | P84T-E | Human | Esophagus | ESCC | 3.83e-07 | 5.51e-01 | 0.0933 |
| 23099 | ZBTB43 | P89T-E | Human | Esophagus | ESCC | 9.08e-04 | 8.89e-01 | 0.1752 |
| 23099 | ZBTB43 | P91T-E | Human | Esophagus | ESCC | 1.35e-06 | 1.00e+00 | 0.1828 |
| 23099 | ZBTB43 | P104T-E | Human | Esophagus | ESCC | 1.06e-07 | 9.78e-01 | 0.0931 |
| 23099 | ZBTB43 | P107T-E | Human | Esophagus | ESCC | 1.32e-31 | 1.03e+00 | 0.171 |
| 23099 | ZBTB43 | P126T-E | Human | Esophagus | ESCC | 8.40e-07 | 1.42e+00 | 0.1125 |
| 23099 | ZBTB43 | P127T-E | Human | Esophagus | ESCC | 1.77e-27 | 6.47e-01 | 0.0826 |
| 23099 | ZBTB43 | P128T-E | Human | Esophagus | ESCC | 6.51e-13 | 6.38e-01 | 0.1241 |
| 23099 | ZBTB43 | P130T-E | Human | Esophagus | ESCC | 7.69e-15 | 4.79e-01 | 0.1676 |
| 23099 | ZBTB43 | HCC1_Meng | Human | Liver | HCC | 8.84e-15 | -9.49e-02 | 0.0246 |
| Page: 1 2 3 4 5 6 |
| Tissue | Expression Dynamics | Abbreviation |
| Esophagus |  | ESCC: Esophageal squamous cell carcinoma |
| HGIN: High-grade intraepithelial neoplasias | ||
| LGIN: Low-grade intraepithelial neoplasias | ||
| Liver |  | HCC: Hepatocellular carcinoma |
| NAFLD: Non-alcoholic fatty liver disease | ||
| Lung | 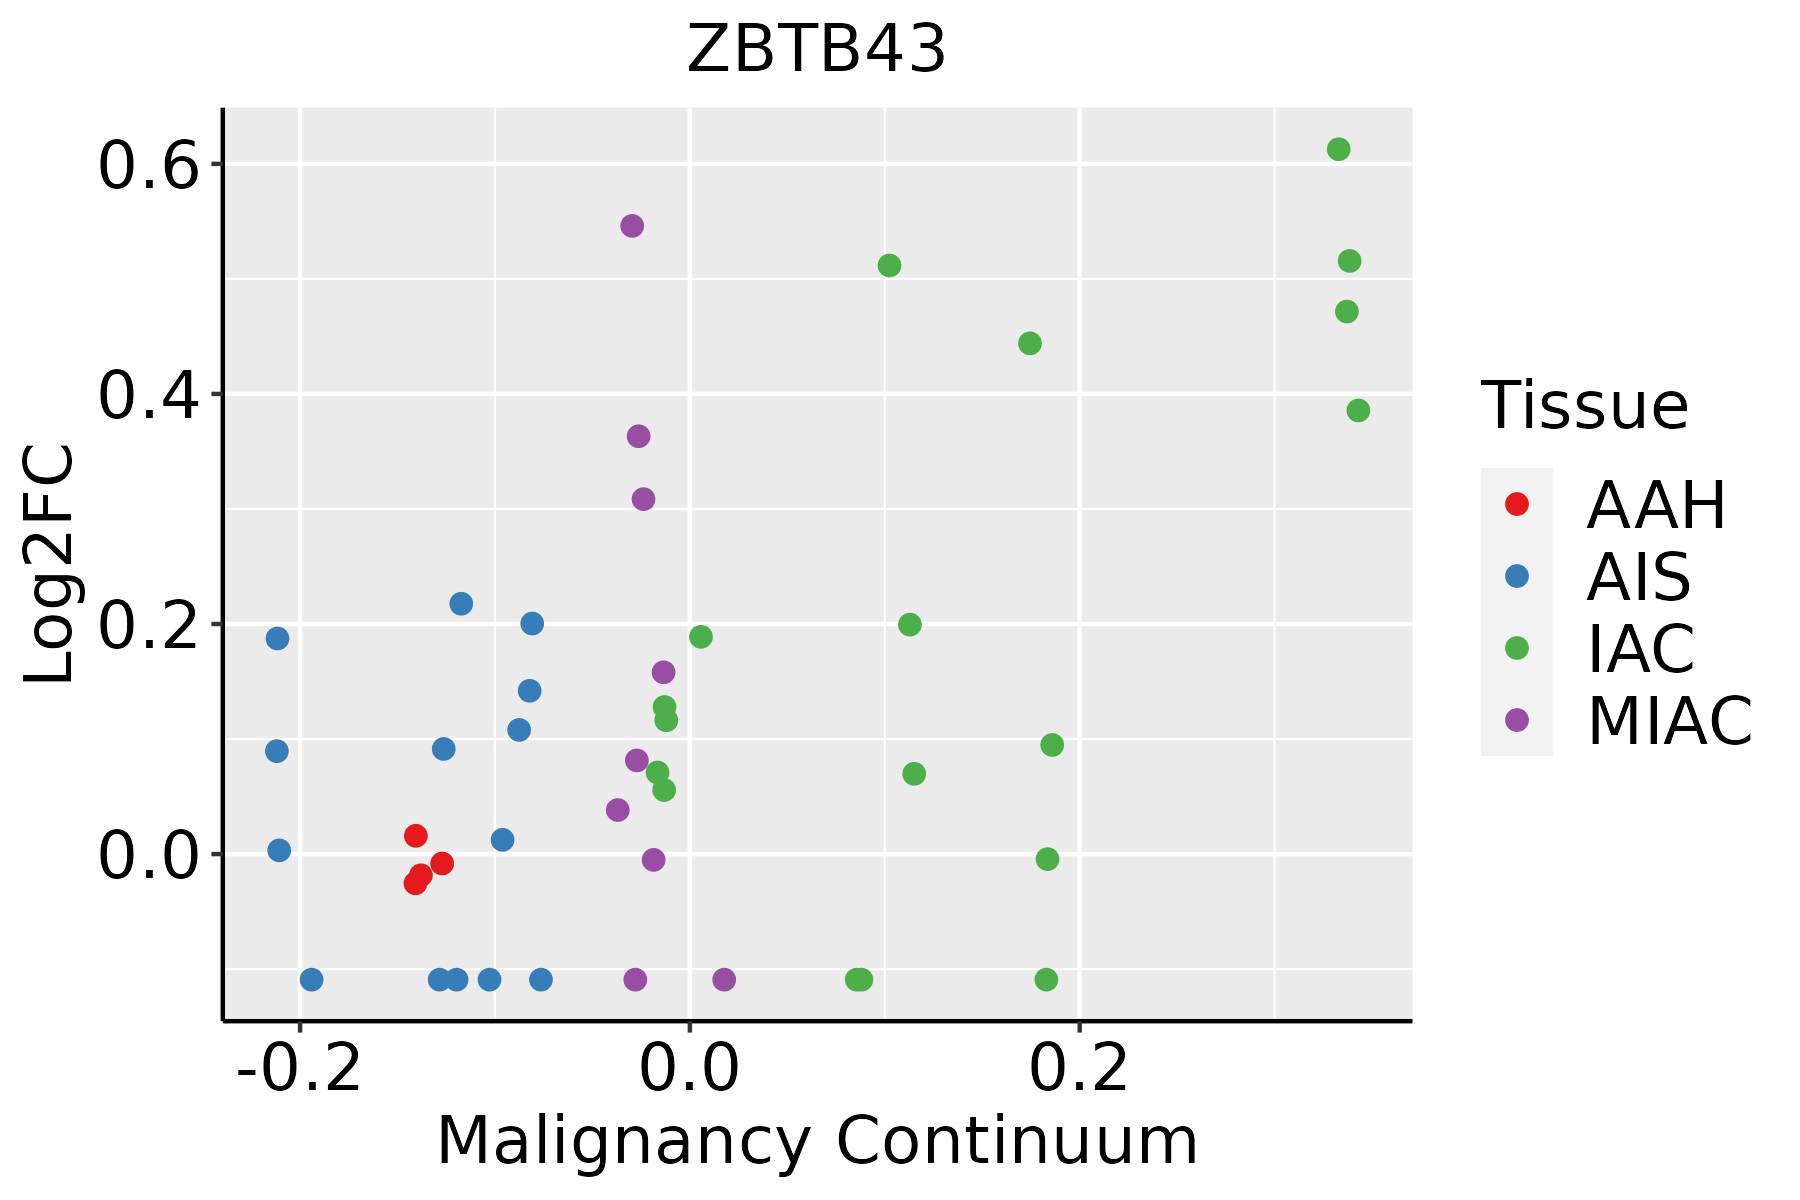 | AAH: Atypical adenomatous hyperplasia |
| AIS: Adenocarcinoma in situ | ||
| IAC: Invasive lung adenocarcinoma | ||
| MIA: Minimally invasive adenocarcinoma | ||
| Oral Cavity | 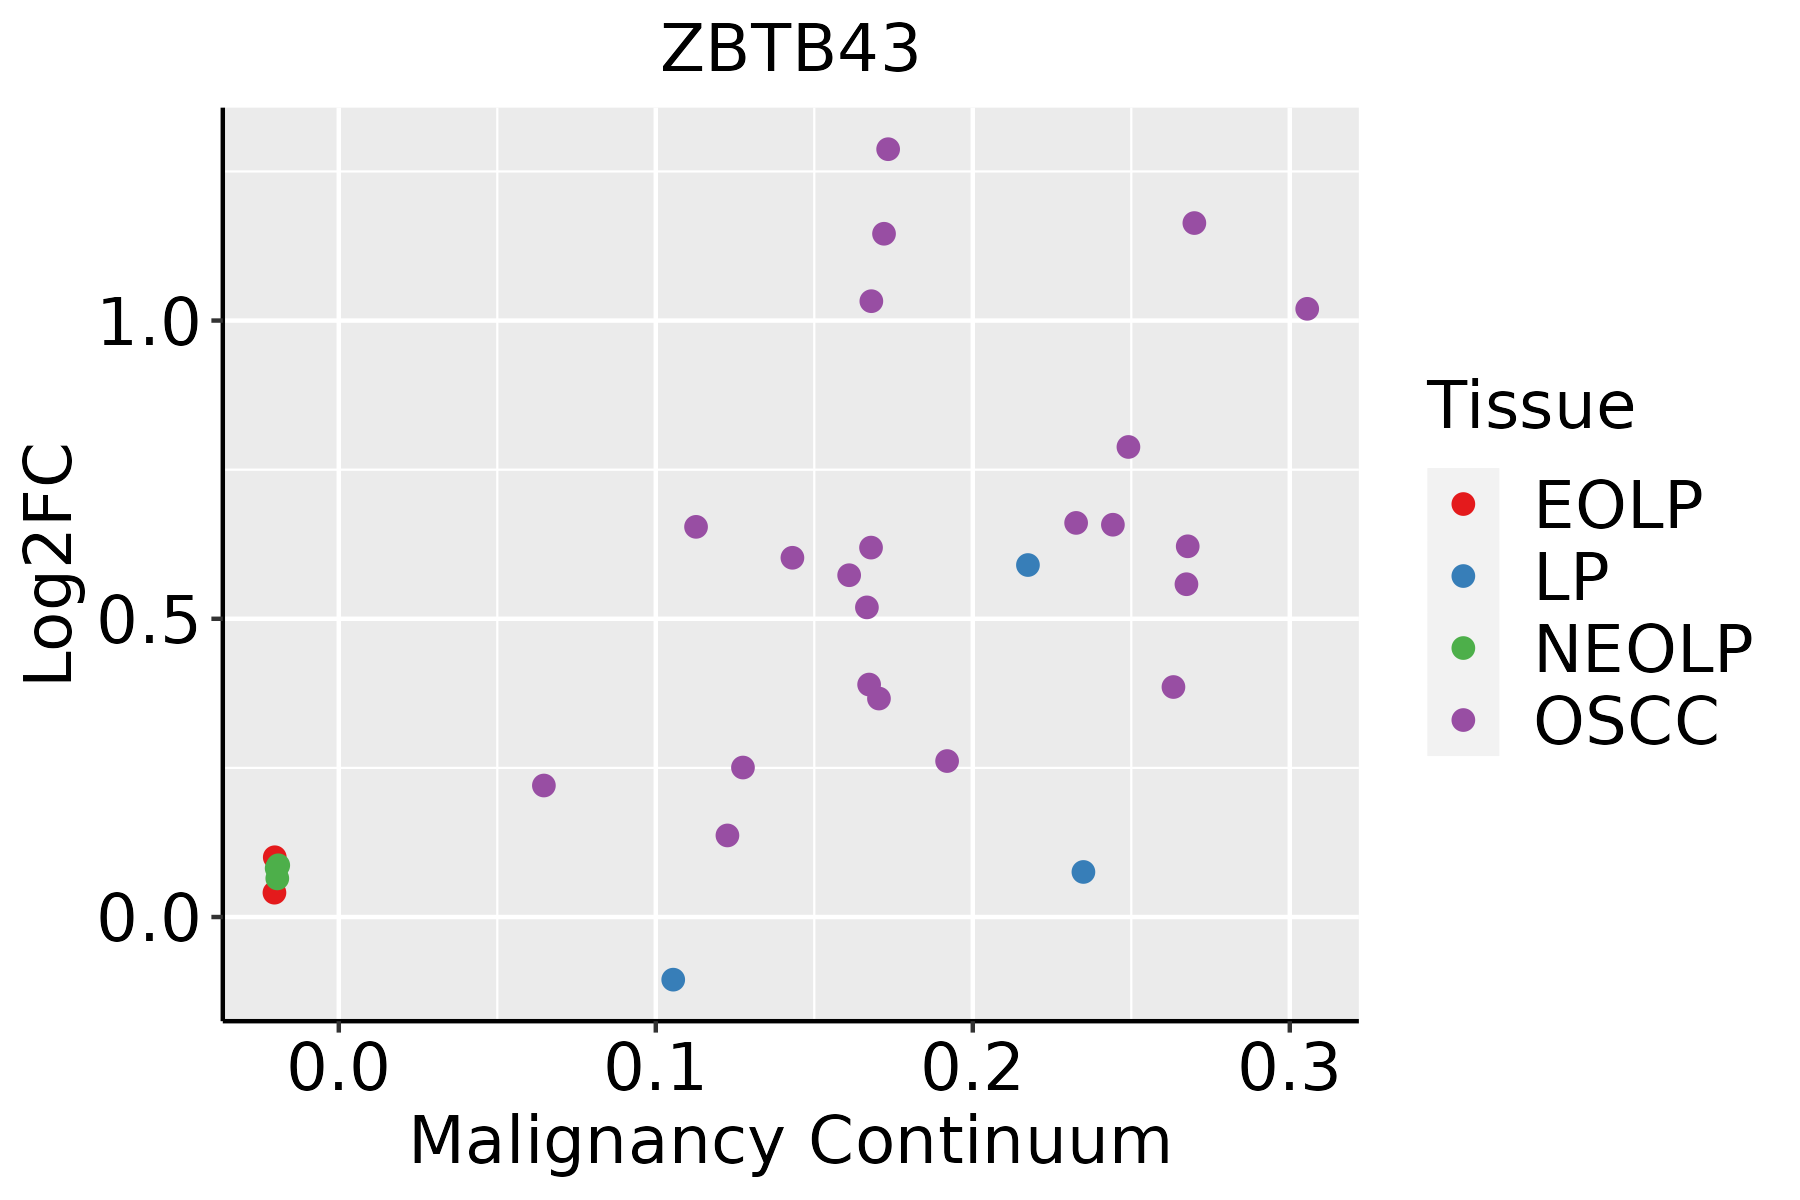 | EOLP: Erosive Oral lichen planus |
| LP: leukoplakia | ||
| NEOLP: Non-erosive oral lichen planus | ||
| OSCC: Oral squamous cell carcinoma | ||
| Skin |  | AK: Actinic keratosis |
| cSCC: Cutaneous squamous cell carcinoma | ||
| SCCIS:squamous cell carcinoma in situ | ||
| Thyroid |  | ATC: Anaplastic thyroid cancer |
| HT: Hashimoto's thyroiditis | ||
| PTC: Papillary thyroid cancer |
| ∗log2FC in expression of this searched gene in stem-like cells from each diseased tissue sample relative to stem-like cells in normal samples in each tissue plotted against the malignancy continuum. Samples are colored based on if they are from different disease stage. |
Top |
Malignant transformation related pathway analysis |
| Find out the enriched GO biological processes and KEGG pathways involved in transition from healthy to precancer to cancer |
| Tissue | Disease Stage | Enriched GO biological Processes |
| Colorectum | AD |  |
| Colorectum | SER |  |
| Colorectum | MSS |  |
| Colorectum | MSI-H |  |
| Colorectum | FAP |  |
| ∗Top 15 enriched GO BP terms are showed in the bar plot of each disease state in each tissue. Each row represents a significant GO biological process which is colored according to the -log10(p.adjust). |
| Page: 1 2 3 4 5 6 7 8 9 |
| GO ID | Tissue | Disease Stage | Description | Gene Ratio | Bg Ratio | pvalue | p.adjust | Count |
| Page: 1 |
| Pathway ID | Tissue | Disease Stage | Description | Gene Ratio | Bg Ratio | pvalue | p.adjust | qvalue | Count |
| Page: 1 |
Top |
Cell-cell communication analysis |
| Identification of potential cell-cell interactions between two cell types and their ligand-receptor pairs for different disease states |
| Ligand | Receptor | LRpair | Pathway | Tissue | Disease Stage |
| Page: 1 |
Top |
Single-cell gene regulatory network inference analysis |
| Find out the significant the regulons (TFs) and the target genes of each regulon across cell types for different disease states |
| TF | Cell Type | Tissue | Disease Stage | Target Gene | RSS | Regulon Activity |
| ZBTB43 | M1MAC | Endometrium | ADJ | LDAH,HSPA1A,EIF3J-DT, etc. | 7.44e-02 |  |
| ZBTB43 | CD4TN | Endometrium | ADJ | LDAH,HSPA1A,EIF3J-DT, etc. | 0.00e+00 | |
| ZBTB43 | CD8TEREX | Endometrium | ADJ | LDAH,HSPA1A,EIF3J-DT, etc. | 8.69e-03 | |
| ZBTB43 | INMON | Endometrium | AEH | LDAH,HSPA1A,EIF3J-DT, etc. | 5.14e-02 |  |
| ZBTB43 | M1MAC | Endometrium | AEH | LDAH,HSPA1A,EIF3J-DT, etc. | 5.39e-02 | |
| ZBTB43 | NKT | Endometrium | EEC | LDAH,HSPA1A,EIF3J-DT, etc. | 0.00e+00 |  |
| ZBTB43 | PLA | Endometrium | Healthy | LDAH,HSPA1A,EIF3J-DT, etc. | 0.00e+00 |  |
| ZBTB43 | CD8TEXINT | Endometrium | Healthy | LDAH,HSPA1A,EIF3J-DT, etc. | 0.00e+00 | |
| ∗The dot plots of a searched regulon are shown for all cell subpopulations in each disease state of each tissue based on the regulon specific score inferred using pySCENIC and by calculating the average expression. |
| Page: 1 |
Top |
Somatic mutation of malignant transformation related genes |
| Annotation of somatic variants for genes involved in malignant transformation |
| Hugo Symbol | Variant Class | Variant Classification | dbSNP RS | HGVSc | HGVSp | HGVSp Short | SWISSPROT | BIOTYPE | SIFT | PolyPhen | Tumor Sample Barcode | Tissue | Histology | Sex | Age | Stage | Therapy Types | Drugs | Outcome |
| ZBTB43 | SNV | Missense_Mutation | c.244N>C | p.Glu82Gln | p.E82Q | O43298 | protein_coding | deleterious(0.01) | probably_damaging(0.998) | TCGA-AC-A23H-01 | Breast | breast invasive carcinoma | Female | >=65 | I/II | Unknown | Unknown | PD | |
| ZBTB43 | SNV | Missense_Mutation | c.635G>A | p.Ser212Asn | p.S212N | O43298 | protein_coding | tolerated(0.24) | possibly_damaging(0.827) | TCGA-AN-A0AK-01 | Breast | breast invasive carcinoma | Female | >=65 | I/II | Unknown | Unknown | SD | |
| ZBTB43 | SNV | Missense_Mutation | novel | c.1160G>C | p.Arg387Thr | p.R387T | O43298 | protein_coding | deleterious(0.01) | probably_damaging(0.998) | TCGA-AR-A2LE-01 | Breast | breast invasive carcinoma | Female | >=65 | I/II | Hormone Therapy | tamoxiphen | PD |
| ZBTB43 | SNV | Missense_Mutation | c.151N>G | p.Leu51Val | p.L51V | O43298 | protein_coding | deleterious(0) | probably_damaging(0.995) | TCGA-BH-A0H5-01 | Breast | breast invasive carcinoma | Female | <65 | I/II | Chemotherapy | cytoxan | CR | |
| ZBTB43 | SNV | Missense_Mutation | rs768016149 | c.148N>A | p.Val50Ile | p.V50I | O43298 | protein_coding | tolerated(0.07) | probably_damaging(0.988) | TCGA-2W-A8YY-01 | Cervix | cervical & endocervical cancer | Female | <65 | I/II | Chemotherapy | cisplatin | CR |
| ZBTB43 | SNV | Missense_Mutation | novel | c.1173G>C | p.Met391Ile | p.M391I | O43298 | protein_coding | tolerated(0.06) | benign(0.006) | TCGA-ZJ-AAXU-01 | Cervix | cervical & endocervical cancer | Female | <65 | I/II | Unknown | Unknown | SD |
| ZBTB43 | SNV | Missense_Mutation | c.1246N>A | p.Val416Met | p.V416M | O43298 | protein_coding | deleterious(0.03) | possibly_damaging(0.827) | TCGA-A6-2682-01 | Colorectum | colon adenocarcinoma | Male | >=65 | III/IV | Chemotherapy | 5 | PD | |
| ZBTB43 | SNV | Missense_Mutation | c.473N>A | p.Gly158Asp | p.G158D | O43298 | protein_coding | tolerated(0.1) | benign(0.264) | TCGA-AA-3712-01 | Colorectum | colon adenocarcinoma | Male | >=65 | III/IV | Unknown | Unknown | SD | |
| ZBTB43 | SNV | Missense_Mutation | c.1249G>A | p.Gly417Ser | p.G417S | O43298 | protein_coding | tolerated(0.37) | possibly_damaging(0.778) | TCGA-D5-6927-01 | Colorectum | colon adenocarcinoma | Male | <65 | I/II | Unknown | Unknown | SD | |
| ZBTB43 | SNV | Missense_Mutation | novel | c.1098N>A | p.Phe366Leu | p.F366L | O43298 | protein_coding | tolerated(0.29) | benign(0.206) | TCGA-AG-A002-01 | Colorectum | rectum adenocarcinoma | Male | <65 | I/II | Unknown | Unknown | SD |
| Page: 1 2 3 4 5 |
Top |
Related drugs of malignant transformation related genes |
| Identification of chemicals and drugs interact with genes involved in malignant transfromation |
| (DGIdb 4.0) |
| Entrez ID | Symbol | Category | Interaction Types | Drug Claim Name | Drug Name | PMIDs |
| Page: 1 |

Copyright 2023-Present -The University of Texas Health Science Center at Houston |