
|
|||||
|
 | |
| |
| |
| |
| |
| |
|
Gene: ZBTB10 |
Gene summary for ZBTB10 |
| Gene information | Species | Human | Gene symbol | ZBTB10 | Gene ID | 65986 |
| Gene name | zinc finger and BTB domain containing 10 | |
| Gene Alias | RINZF | |
| Cytomap | 8q21.13 | |
| Gene Type | protein-coding | GO ID | GO:0006139 | UniProtAcc | Q96DT7 |
Top |
Malignant transformation analysis |
| Identification of the aberrant gene expression in precancerous and cancerous lesions by comparing the gene expression of stem-like cells in diseased tissues with normal stem cells |
| Entrez ID | Symbol | Replicates | Species | Organ | Tissue | Adj P-value | Log2FC | Malignancy |
| 65986 | ZBTB10 | P80T-E | Human | Esophagus | ESCC | 2.60e-04 | 1.96e-01 | 0.155 |
| 65986 | ZBTB10 | P83T-E | Human | Esophagus | ESCC | 3.53e-04 | 1.26e-01 | 0.1738 |
| 65986 | ZBTB10 | P84T-E | Human | Esophagus | ESCC | 6.58e-06 | 3.00e-01 | 0.0933 |
| 65986 | ZBTB10 | P107T-E | Human | Esophagus | ESCC | 6.19e-04 | 8.70e-02 | 0.171 |
| 65986 | ZBTB10 | P128T-E | Human | Esophagus | ESCC | 4.51e-19 | 7.65e-01 | 0.1241 |
| 65986 | ZBTB10 | P130T-E | Human | Esophagus | ESCC | 1.04e-15 | 4.27e-01 | 0.1676 |
| 65986 | ZBTB10 | HCC1_Meng | Human | Liver | HCC | 2.27e-74 | 1.43e-01 | 0.0246 |
| 65986 | ZBTB10 | HCC2_Meng | Human | Liver | HCC | 1.38e-19 | 4.05e-02 | 0.0107 |
| 65986 | ZBTB10 | HCC1 | Human | Liver | HCC | 2.29e-03 | 4.15e+00 | 0.5336 |
| 65986 | ZBTB10 | HCC2 | Human | Liver | HCC | 5.32e-14 | 4.13e+00 | 0.5341 |
| 65986 | ZBTB10 | Pt13.b | Human | Liver | HCC | 2.37e-19 | 3.36e-01 | 0.0251 |
| 65986 | ZBTB10 | S014 | Human | Liver | HCC | 1.02e-17 | 7.88e-01 | 0.2254 |
| 65986 | ZBTB10 | S015 | Human | Liver | HCC | 9.37e-16 | 1.00e+00 | 0.2375 |
| 65986 | ZBTB10 | S016 | Human | Liver | HCC | 2.66e-17 | 6.94e-01 | 0.2243 |
| 65986 | ZBTB10 | S027 | Human | Liver | HCC | 2.31e-06 | 8.22e-01 | 0.2446 |
| 65986 | ZBTB10 | S028 | Human | Liver | HCC | 8.41e-24 | 1.12e+00 | 0.2503 |
| 65986 | ZBTB10 | S029 | Human | Liver | HCC | 3.48e-15 | 8.17e-01 | 0.2581 |
| 65986 | ZBTB10 | RNA-P17T-P17T-2 | Human | Lung | IAC | 1.11e-06 | 6.90e-01 | 0.3371 |
| 65986 | ZBTB10 | RNA-P17T-P17T-4 | Human | Lung | IAC | 6.18e-04 | 5.21e-01 | 0.343 |
| 65986 | ZBTB10 | RNA-P17T-P17T-8 | Human | Lung | IAC | 2.80e-04 | 6.03e-01 | 0.3329 |
| Page: 1 2 3 4 5 |
| Tissue | Expression Dynamics | Abbreviation |
| Esophagus |  | ESCC: Esophageal squamous cell carcinoma |
| HGIN: High-grade intraepithelial neoplasias | ||
| LGIN: Low-grade intraepithelial neoplasias | ||
| Liver | 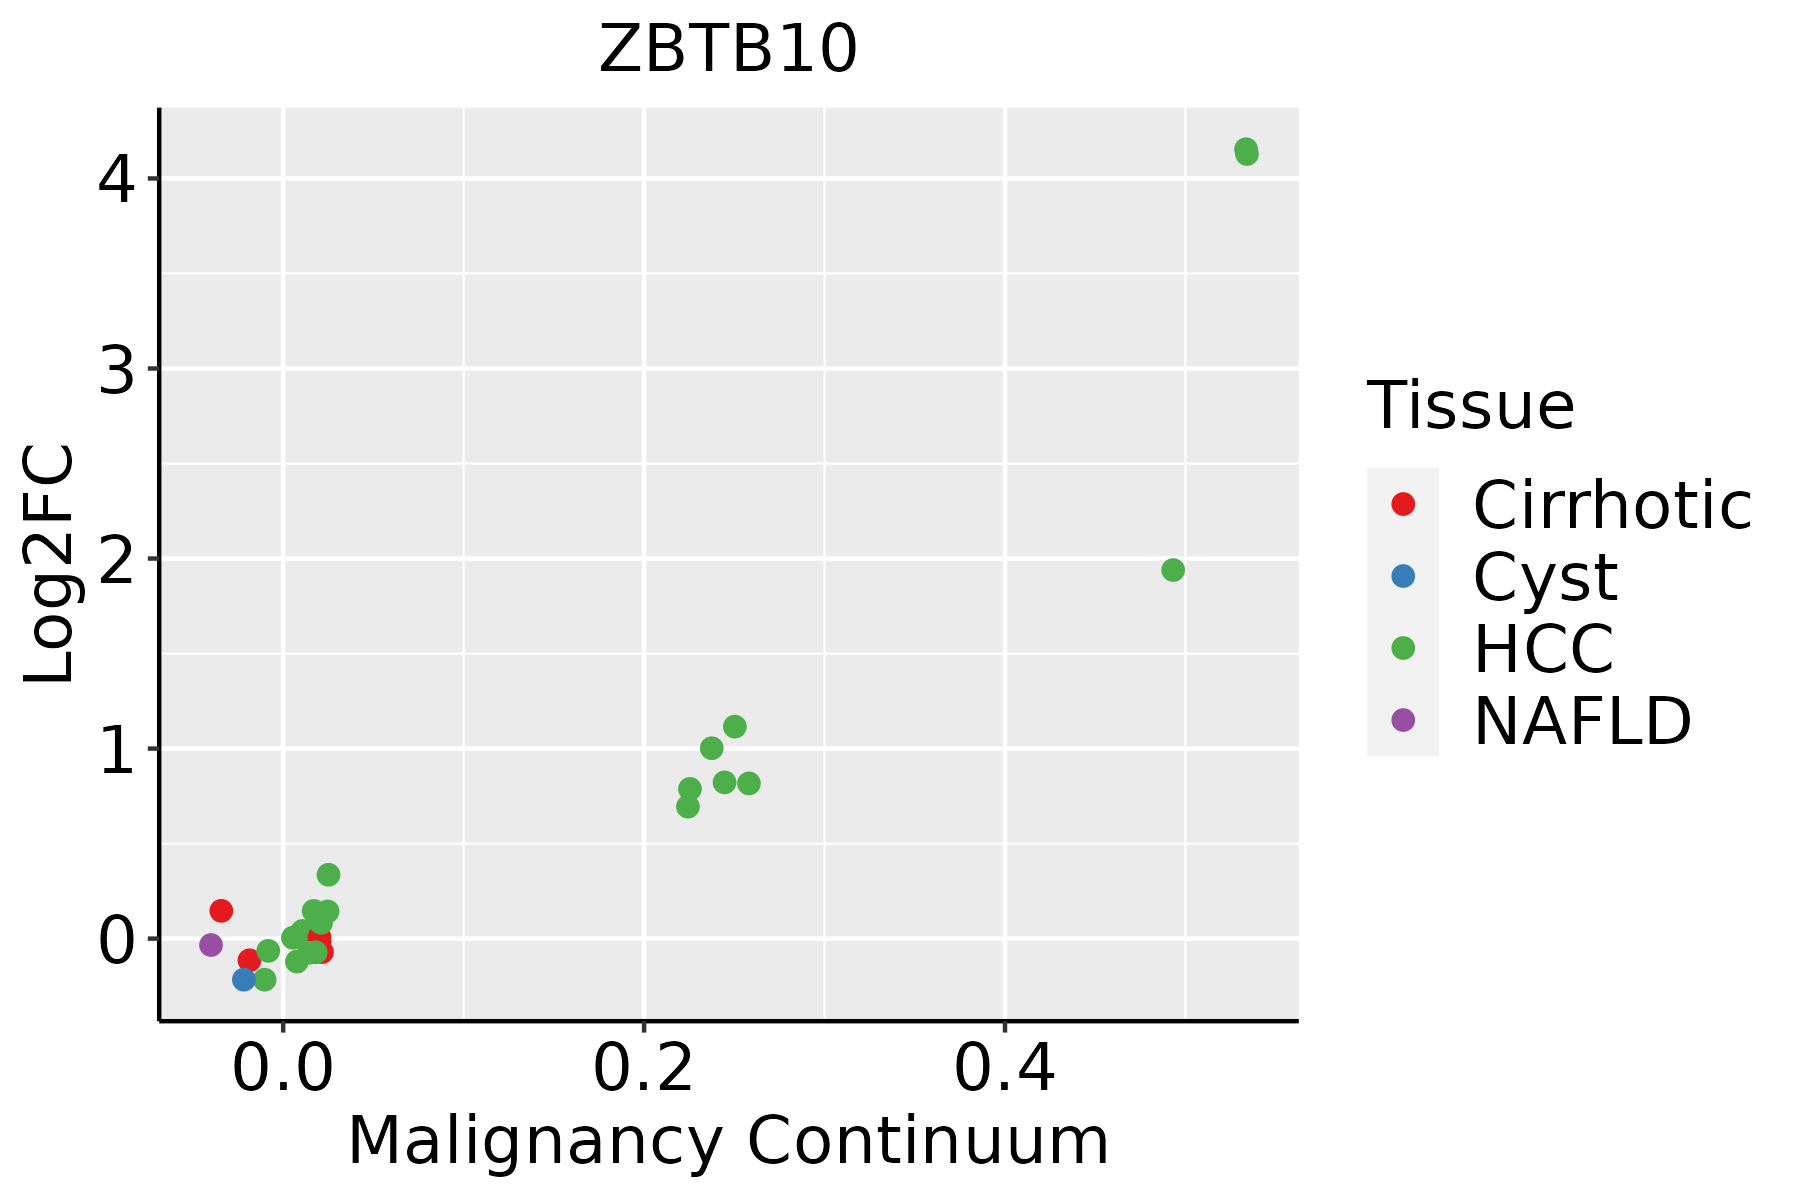 | HCC: Hepatocellular carcinoma |
| NAFLD: Non-alcoholic fatty liver disease | ||
| Lung | 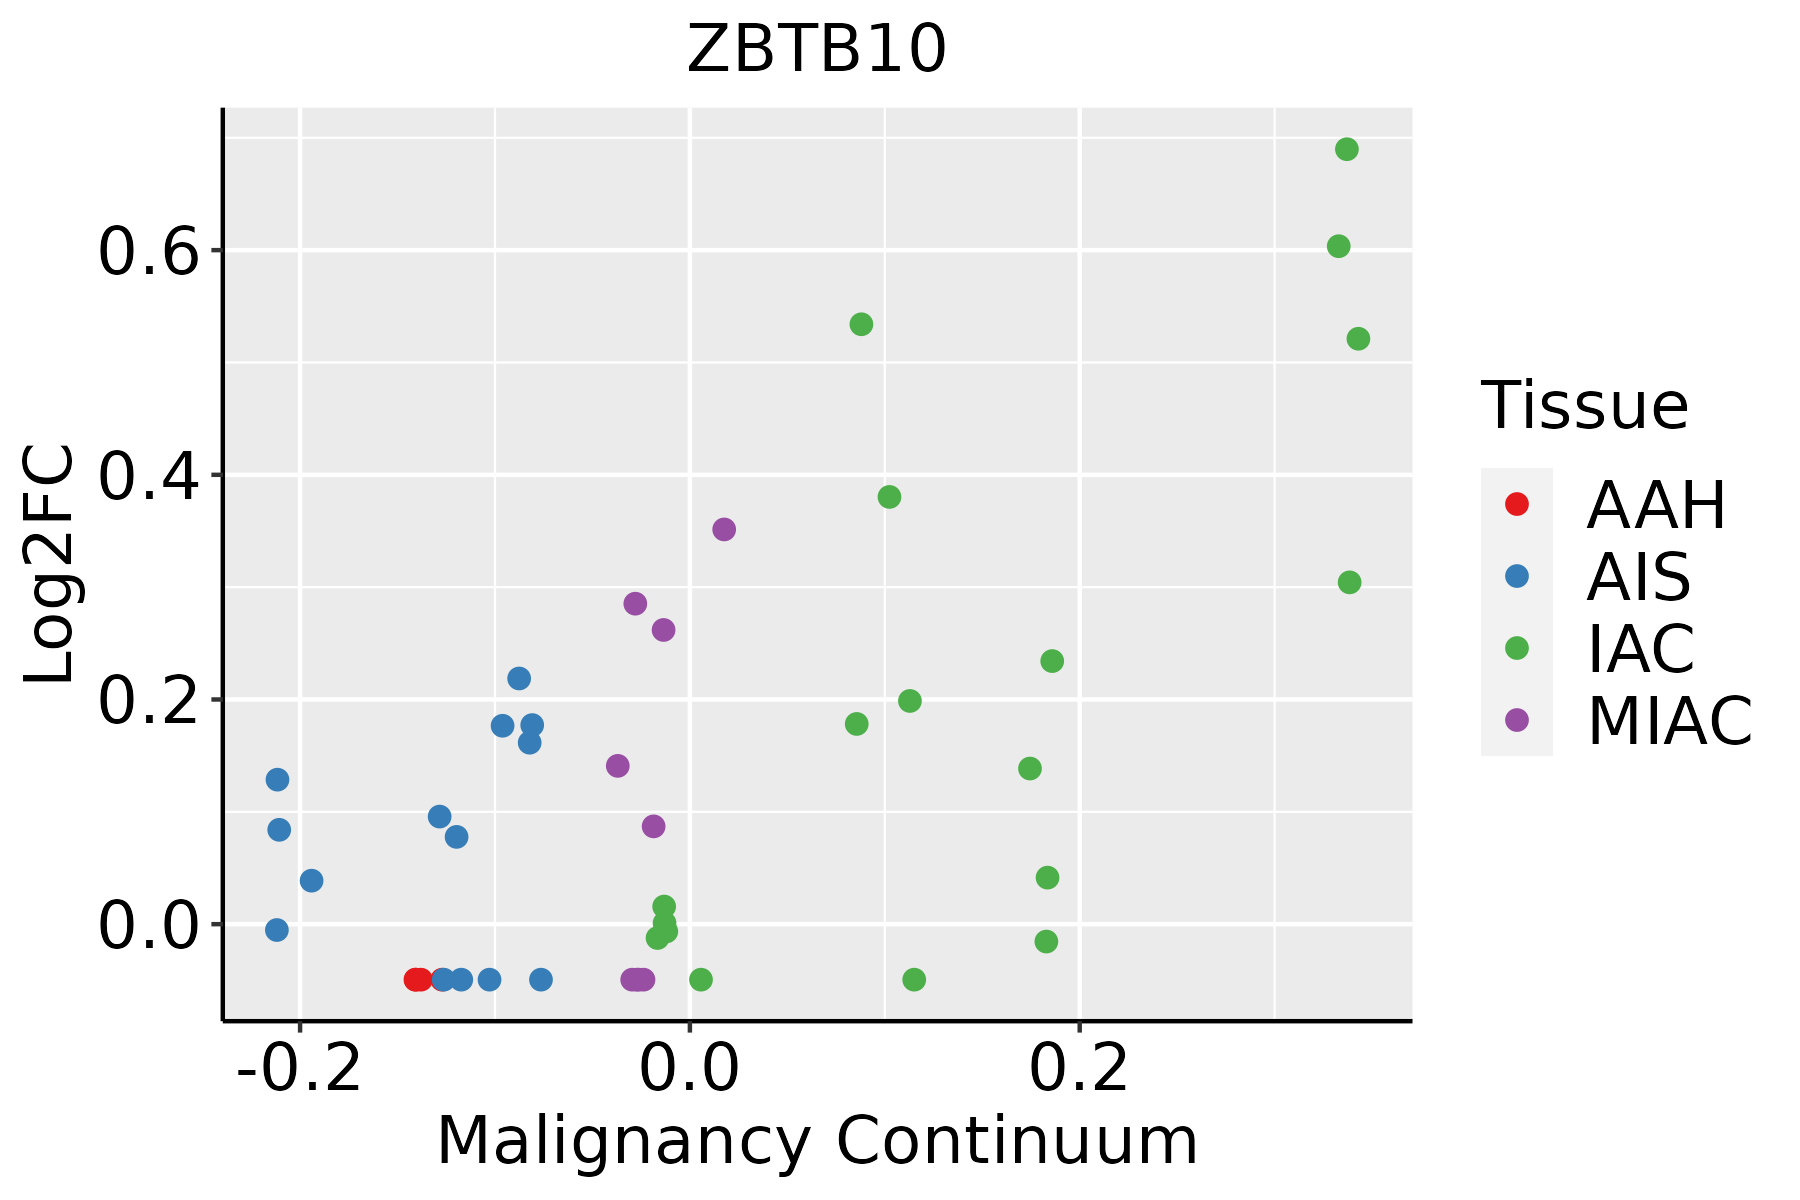 | AAH: Atypical adenomatous hyperplasia |
| AIS: Adenocarcinoma in situ | ||
| IAC: Invasive lung adenocarcinoma | ||
| MIA: Minimally invasive adenocarcinoma | ||
| Prostate | 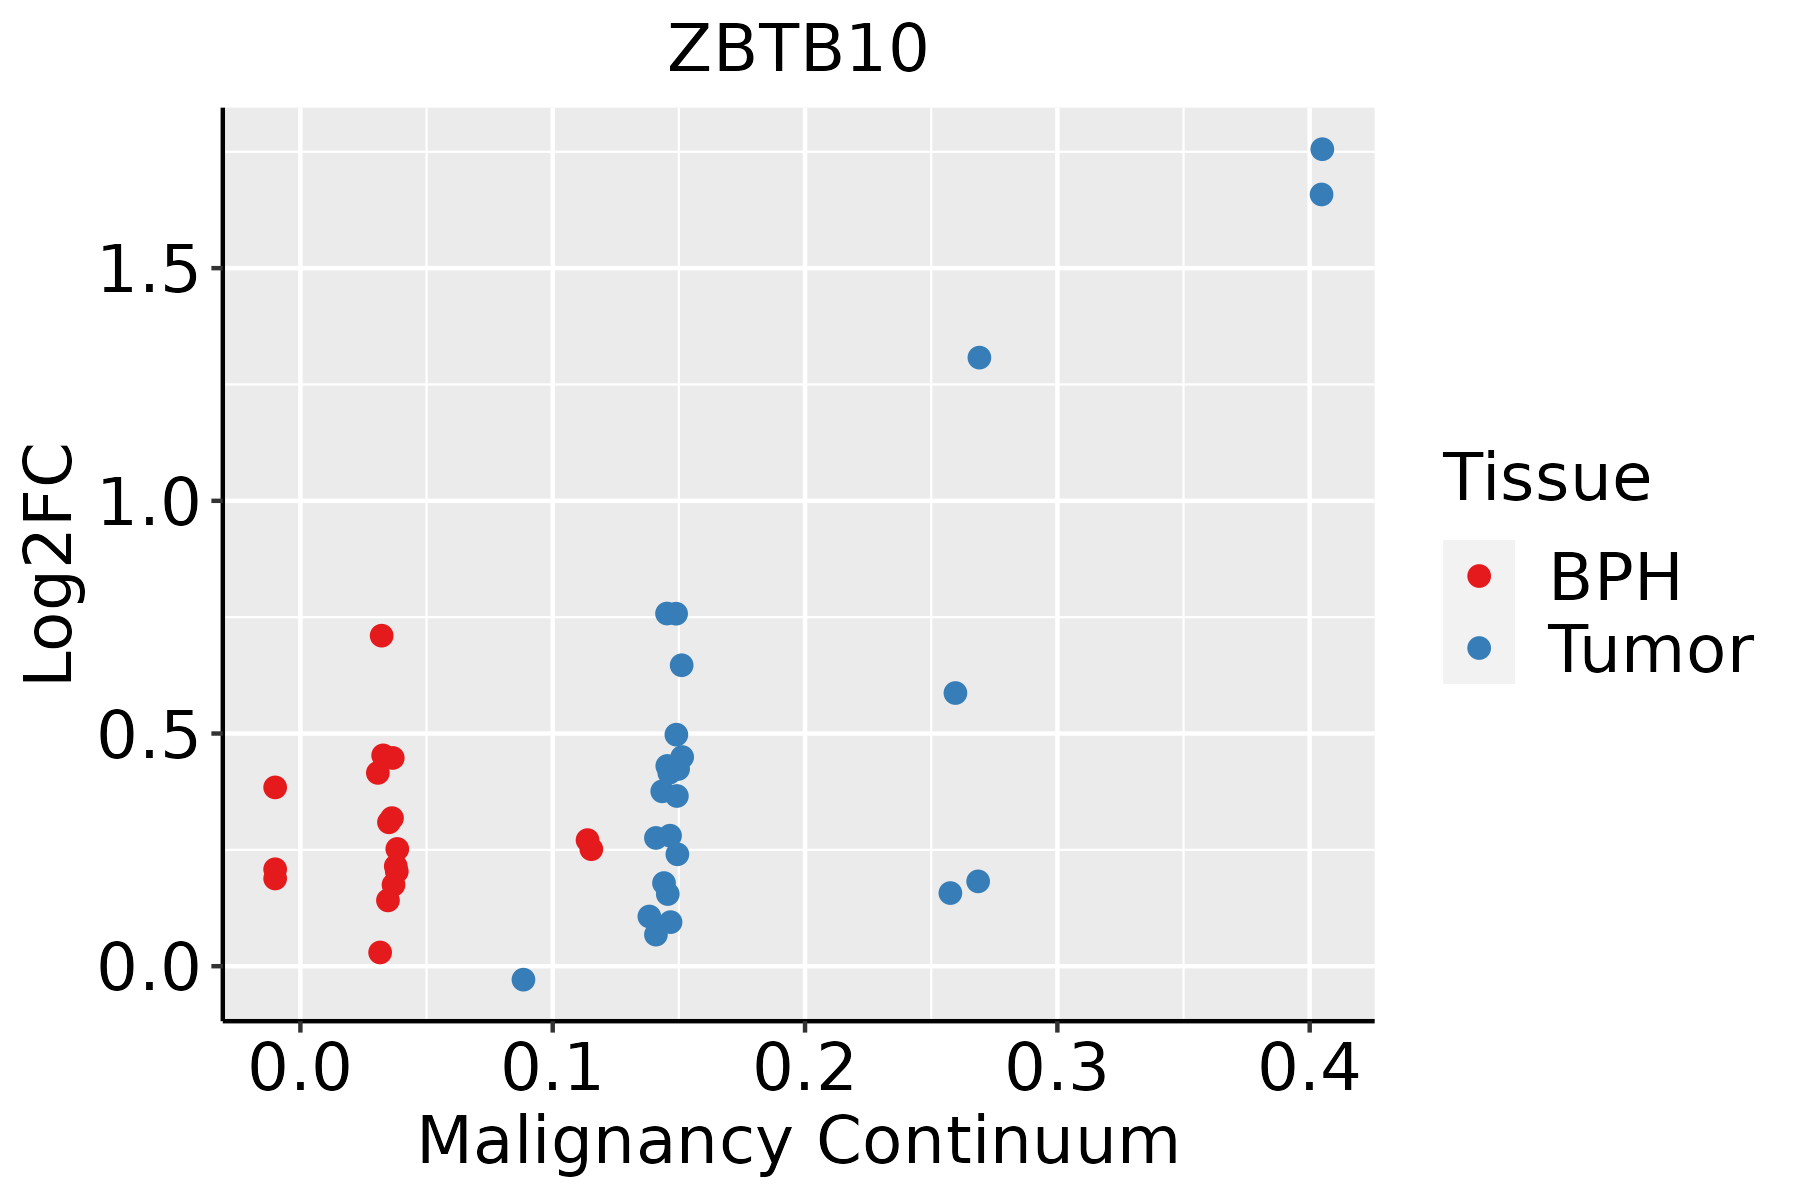 | BPH: Benign Prostatic Hyperplasia |
| Thyroid |  | ATC: Anaplastic thyroid cancer |
| HT: Hashimoto's thyroiditis | ||
| PTC: Papillary thyroid cancer |
| ∗log2FC in expression of this searched gene in stem-like cells from each diseased tissue sample relative to stem-like cells in normal samples in each tissue plotted against the malignancy continuum. Samples are colored based on if they are from different disease stage. |
Top |
Malignant transformation related pathway analysis |
| Find out the enriched GO biological processes and KEGG pathways involved in transition from healthy to precancer to cancer |
| Tissue | Disease Stage | Enriched GO biological Processes |
| Colorectum | AD |  |
| Colorectum | SER |  |
| Colorectum | MSS |  |
| Colorectum | MSI-H |  |
| Colorectum | FAP |  |
| ∗Top 15 enriched GO BP terms are showed in the bar plot of each disease state in each tissue. Each row represents a significant GO biological process which is colored according to the -log10(p.adjust). |
| Page: 1 2 3 4 5 6 7 8 9 |
| GO ID | Tissue | Disease Stage | Description | Gene Ratio | Bg Ratio | pvalue | p.adjust | Count |
| Page: 1 |
| Pathway ID | Tissue | Disease Stage | Description | Gene Ratio | Bg Ratio | pvalue | p.adjust | qvalue | Count |
| Page: 1 |
Top |
Cell-cell communication analysis |
| Identification of potential cell-cell interactions between two cell types and their ligand-receptor pairs for different disease states |
| Ligand | Receptor | LRpair | Pathway | Tissue | Disease Stage |
| Page: 1 |
Top |
Single-cell gene regulatory network inference analysis |
| Find out the significant the regulons (TFs) and the target genes of each regulon across cell types for different disease states |
| TF | Cell Type | Tissue | Disease Stage | Target Gene | RSS | Regulon Activity |
| ∗The dot plots of a searched regulon are shown for all cell subpopulations in each disease state of each tissue based on the regulon specific score inferred using pySCENIC and by calculating the average expression. |
| Page: 1 |
Top |
Somatic mutation of malignant transformation related genes |
| Annotation of somatic variants for genes involved in malignant transformation |
| Hugo Symbol | Variant Class | Variant Classification | dbSNP RS | HGVSc | HGVSp | HGVSp Short | SWISSPROT | BIOTYPE | SIFT | PolyPhen | Tumor Sample Barcode | Tissue | Histology | Sex | Age | Stage | Therapy Types | Drugs | Outcome |
| ZBTB10 | SNV | Missense_Mutation | novel | c.1237N>A | p.Ala413Thr | p.A413T | Q96DT7 | protein_coding | tolerated(0.43) | possibly_damaging(0.649) | TCGA-5L-AAT1-01 | Breast | breast invasive carcinoma | Female | <65 | III/IV | Hormone Therapy | letrozol | SD |
| ZBTB10 | SNV | Missense_Mutation | novel | c.2259N>G | p.Asp753Glu | p.D753E | Q96DT7 | protein_coding | tolerated(0.51) | benign(0.044) | TCGA-A7-A26I-01 | Breast | breast invasive carcinoma | Female | >=65 | I/II | Chemotherapy | cytoxan | SD |
| ZBTB10 | SNV | Missense_Mutation | novel | c.2261N>A | p.Ile754Asn | p.I754N | Q96DT7 | protein_coding | deleterious(0) | probably_damaging(0.998) | TCGA-A7-A26I-01 | Breast | breast invasive carcinoma | Female | >=65 | I/II | Chemotherapy | cytoxan | SD |
| ZBTB10 | SNV | Missense_Mutation | c.739C>G | p.Gln247Glu | p.Q247E | Q96DT7 | protein_coding | deleterious_low_confidence(0.03) | benign(0.003) | TCGA-A8-A07R-01 | Breast | breast invasive carcinoma | Female | >=65 | III/IV | Ancillary | zoledronic | SD | |
| ZBTB10 | SNV | Missense_Mutation | novel | c.1403N>C | p.Lys468Thr | p.K468T | Q96DT7 | protein_coding | deleterious(0.01) | probably_damaging(0.994) | TCGA-AN-A046-01 | Breast | breast invasive carcinoma | Female | >=65 | I/II | Unknown | Unknown | SD |
| ZBTB10 | SNV | Missense_Mutation | rs747092211 | c.1160G>A | p.Arg387His | p.R387H | Q96DT7 | protein_coding | deleterious(0.02) | probably_damaging(0.998) | TCGA-AN-A0AK-01 | Breast | breast invasive carcinoma | Female | >=65 | I/II | Unknown | Unknown | SD |
| ZBTB10 | SNV | Missense_Mutation | c.862N>T | p.Pro288Ser | p.P288S | Q96DT7 | protein_coding | tolerated_low_confidence(0.13) | benign(0.018) | TCGA-BH-A0HK-01 | Breast | breast invasive carcinoma | Female | >=65 | I/II | Hormone Therapy | arimidex | SD | |
| ZBTB10 | SNV | Missense_Mutation | c.1765N>G | p.Pro589Ala | p.P589A | Q96DT7 | protein_coding | deleterious(0.05) | benign(0.294) | TCGA-BH-A0HP-01 | Breast | breast invasive carcinoma | Female | >=65 | III/IV | Chemotherapy | doxorubicin | SD | |
| ZBTB10 | SNV | Missense_Mutation | c.437N>T | p.Ser146Leu | p.S146L | Q96DT7 | protein_coding | tolerated_low_confidence(0.11) | benign(0.005) | TCGA-BH-A18I-01 | Breast | breast invasive carcinoma | Female | <65 | I/II | Chemotherapy | taxotere | CR | |
| ZBTB10 | SNV | Missense_Mutation | novel | c.2066N>T | p.Pro689Leu | p.P689L | Q96DT7 | protein_coding | tolerated(0.24) | benign(0.058) | TCGA-E2-A574-01 | Breast | breast invasive carcinoma | Female | <65 | I/II | Chemotherapy | adriamycin | SD |
| Page: 1 2 3 4 5 6 7 8 |
Top |
Related drugs of malignant transformation related genes |
| Identification of chemicals and drugs interact with genes involved in malignant transfromation |
| (DGIdb 4.0) |
| Entrez ID | Symbol | Category | Interaction Types | Drug Claim Name | Drug Name | PMIDs |
| Page: 1 |

Copyright 2023-Present -The University of Texas Health Science Center at Houston |