Schematic overview of the cellular and molecular mechanisms involved in the cancer progression, including the proposed cellular and molecular mechanisms in cancer cells trajectory. AT1: alveolar type 1 cells; AT2: alveolar type 2 cells; AAH: atypical adenomatous hyperplasia; AIS: adenocarcinoma in situ; MIA: minimally invasive adenocarcinoma; IA: invasive adenocarcinoma; EMT: epithelial-mesenchymal transition

Home

Download

Statistics

Help

Contact

Center for Computational Systems Medicine
leaf

Gene summary

leaf

Malignant transformation analysis

leaf

Malignant transformation related pathway analysis

leaf

Cell-cell communication analysis

leaf

Single-cell gene regulatory network inference analysis

leaf

Somatic mutation of malignant transformation related genes

leaf

Related drugs of malignant transformation related genes

Gene: YLPM1

Gene summary for YLPM1

check button Gene summary.

Gene informationSpeciesHuman
Gene symbol

YLPM1

Gene ID

56252

Gene nameYLP motif containing 1
Gene AliasC14orf170
Cytomap14q24.3
Gene Typeprotein-coding
GO ID

GO:0000723

UniProtAcc

P49750


Top

Malignant transformation analysis

check button Identification of the aberrant gene expression in precancerous and cancerous lesions by comparing the gene expression of stem-like cells in diseased tissues with normal stem cells
check button Malignant transformation involving gene list.
Entrez IDSymbolReplicatesSpeciesOrganTissueAdj P-valueLog2FCMalignancy
56252YLPM1P52T-EHumanEsophagusESCC3.61e-202.35e-010.1555
56252YLPM1P54T-EHumanEsophagusESCC1.06e-123.62e-010.0975
56252YLPM1P56T-EHumanEsophagusESCC2.89e-037.97e-010.1613
56252YLPM1P57T-EHumanEsophagusESCC1.01e-202.31e-010.0926
56252YLPM1P61T-EHumanEsophagusESCC4.90e-298.00e-010.099
56252YLPM1P62T-EHumanEsophagusESCC1.54e-194.20e-010.1302
56252YLPM1P65T-EHumanEsophagusESCC3.19e-223.70e-010.0978
56252YLPM1P74T-EHumanEsophagusESCC1.43e-235.45e-010.1479
56252YLPM1P75T-EHumanEsophagusESCC1.48e-173.66e-010.1125
56252YLPM1P76T-EHumanEsophagusESCC1.08e-162.01e-010.1207
56252YLPM1P79T-EHumanEsophagusESCC1.61e-284.79e-010.1154
56252YLPM1P80T-EHumanEsophagusESCC1.03e-155.79e-010.155
56252YLPM1P82T-EHumanEsophagusESCC1.23e-053.05e-010.1072
56252YLPM1P83T-EHumanEsophagusESCC9.04e-256.45e-010.1738
56252YLPM1P84T-EHumanEsophagusESCC1.28e-072.87e-010.0933
56252YLPM1P89T-EHumanEsophagusESCC1.22e-035.34e-010.1752
56252YLPM1P91T-EHumanEsophagusESCC1.87e-091.21e+000.1828
56252YLPM1P104T-EHumanEsophagusESCC9.12e-062.22e-010.0931
56252YLPM1P107T-EHumanEsophagusESCC8.42e-164.23e-010.171
56252YLPM1P127T-EHumanEsophagusESCC1.72e-204.27e-010.0826
Page: 1 2 3 4 5 6 

check button Transcriptomic changes along malignancy continuum.
TissueExpression DynamicsAbbreviation
EsophagusThe image shows the transcriptomic changes along malignancy continuum.log2FC in expression of this searched gene in stem-like cells from each diseased tissue sample relative to stem-like cells in normal samples in each tissue plotted against the malignancy continuum. Samples are colored based on if they are from different disease stage.
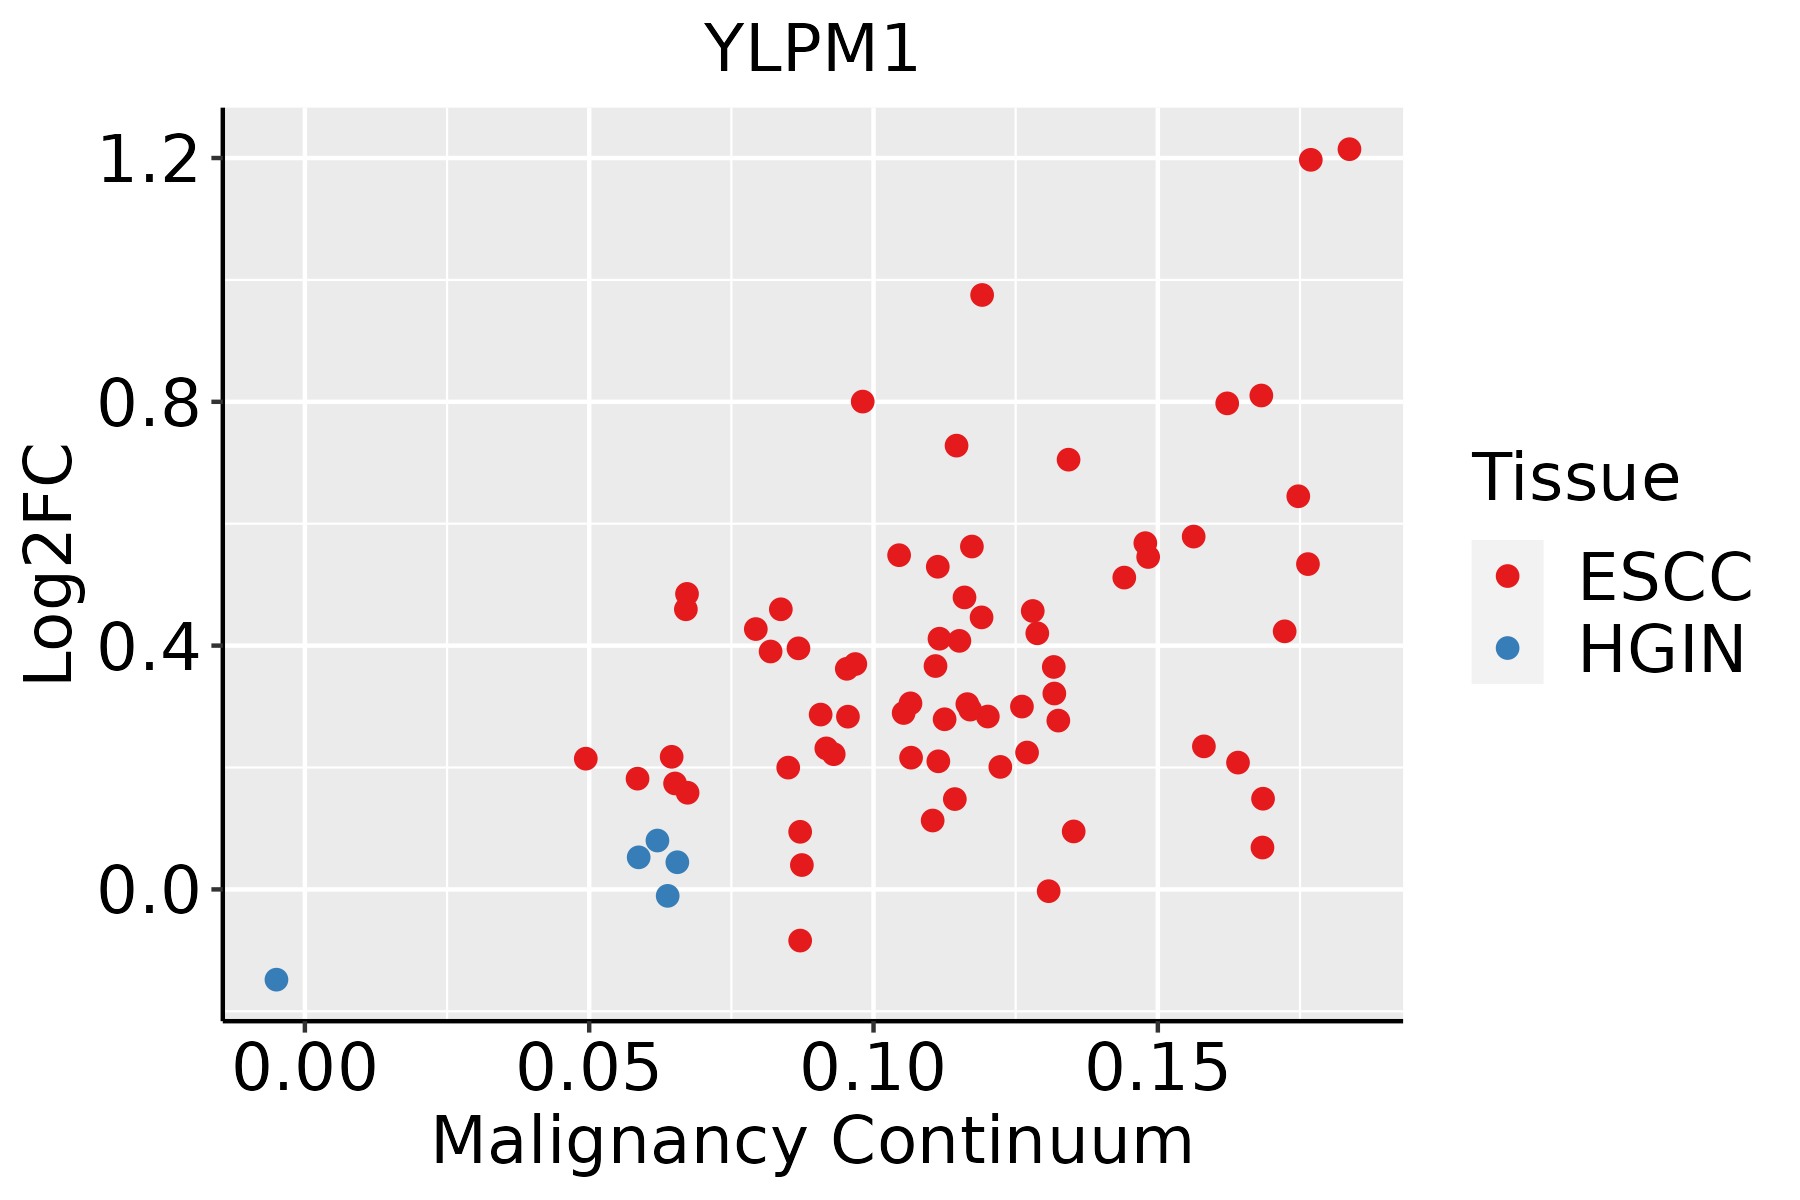
ESCC: Esophageal squamous cell carcinoma
HGIN: High-grade intraepithelial neoplasias
LGIN: Low-grade intraepithelial neoplasias
LiverThe image shows the transcriptomic changes along malignancy continuum.log2FC in expression of this searched gene in stem-like cells from each diseased tissue sample relative to stem-like cells in normal samples in each tissue plotted against the malignancy continuum. Samples are colored based on if they are from different disease stage.HCC: Hepatocellular carcinoma
NAFLD: Non-alcoholic fatty liver disease
Oral CavityThe image shows the transcriptomic changes along malignancy continuum.log2FC in expression of this searched gene in stem-like cells from each diseased tissue sample relative to stem-like cells in normal samples in each tissue plotted against the malignancy continuum. Samples are colored based on if they are from different disease stage.
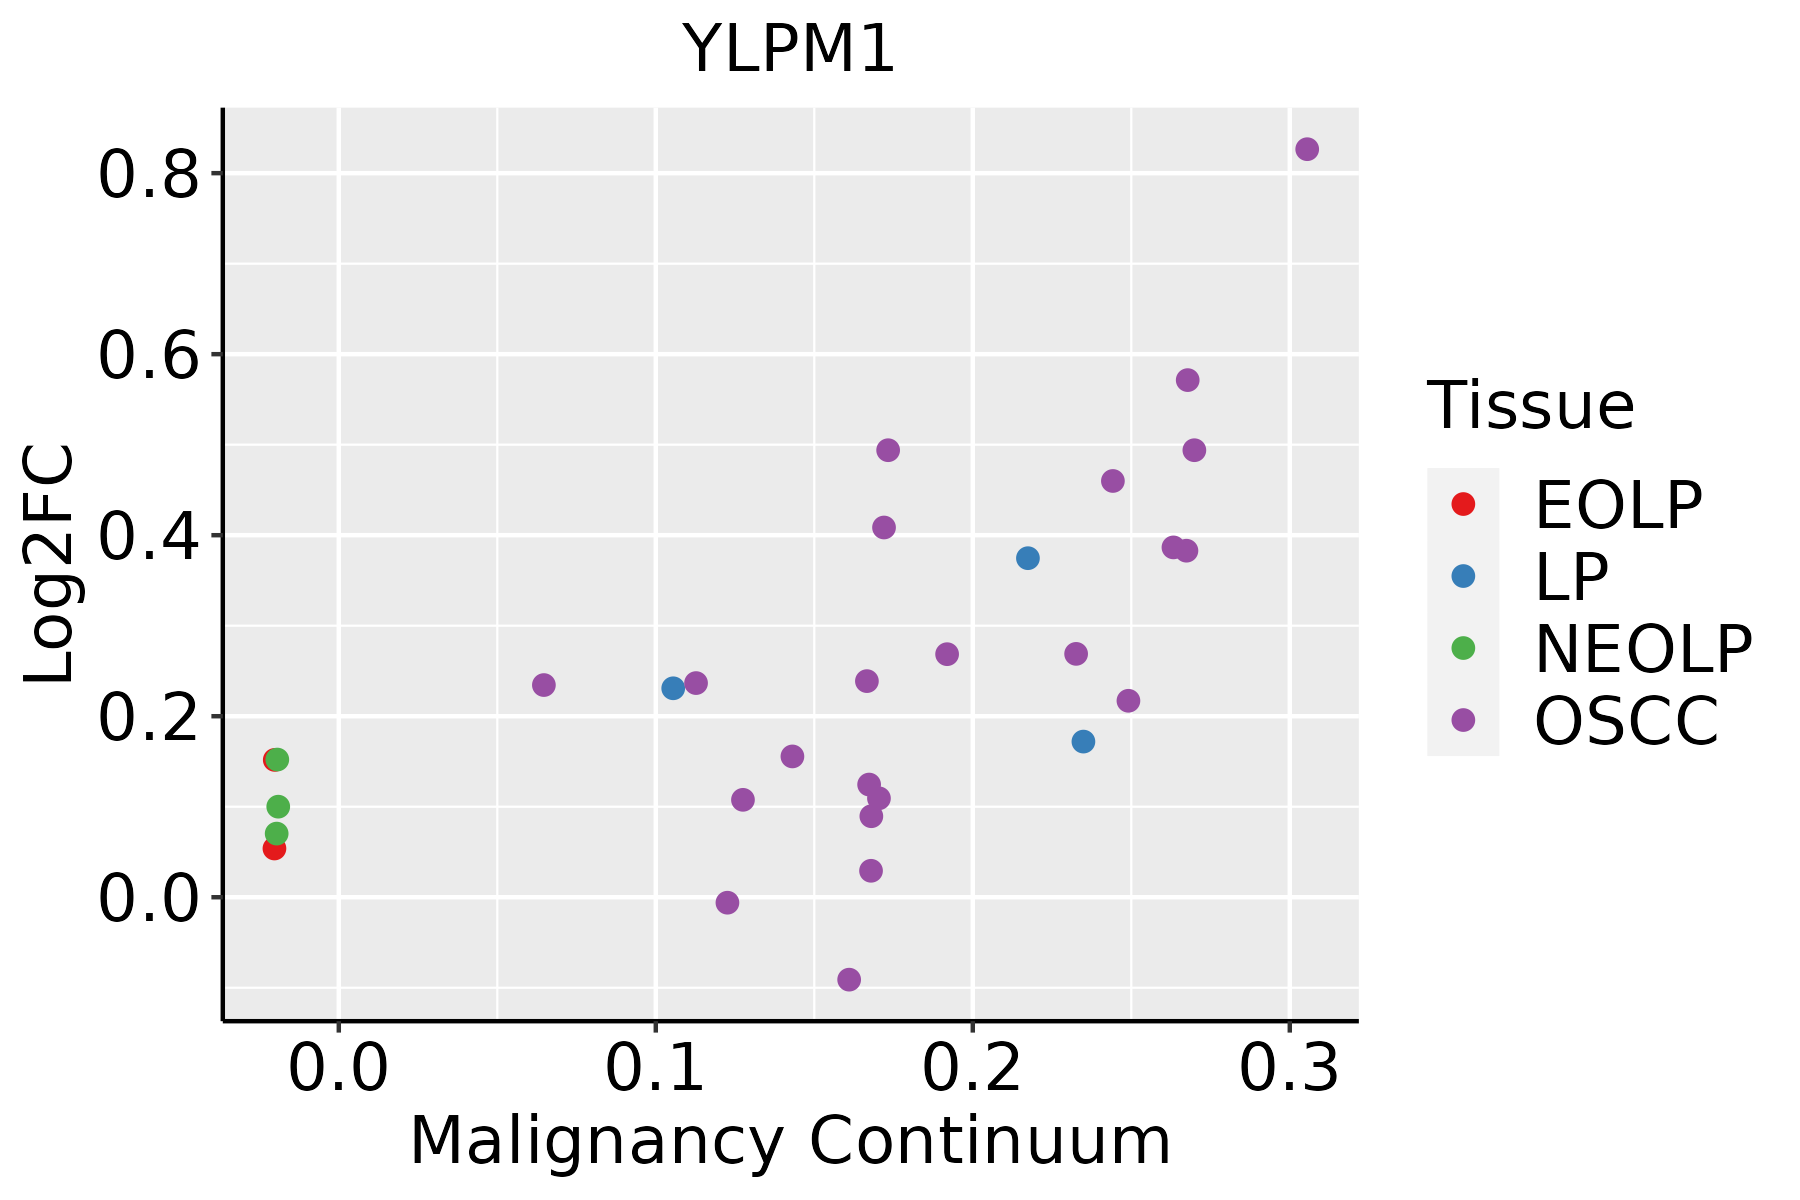
EOLP: Erosive Oral lichen planus
LP: leukoplakia
NEOLP: Non-erosive oral lichen planus
OSCC: Oral squamous cell carcinoma
ProstateThe image shows the transcriptomic changes along malignancy continuum.log2FC in expression of this searched gene in stem-like cells from each diseased tissue sample relative to stem-like cells in normal samples in each tissue plotted against the malignancy continuum. Samples are colored based on if they are from different disease stage.
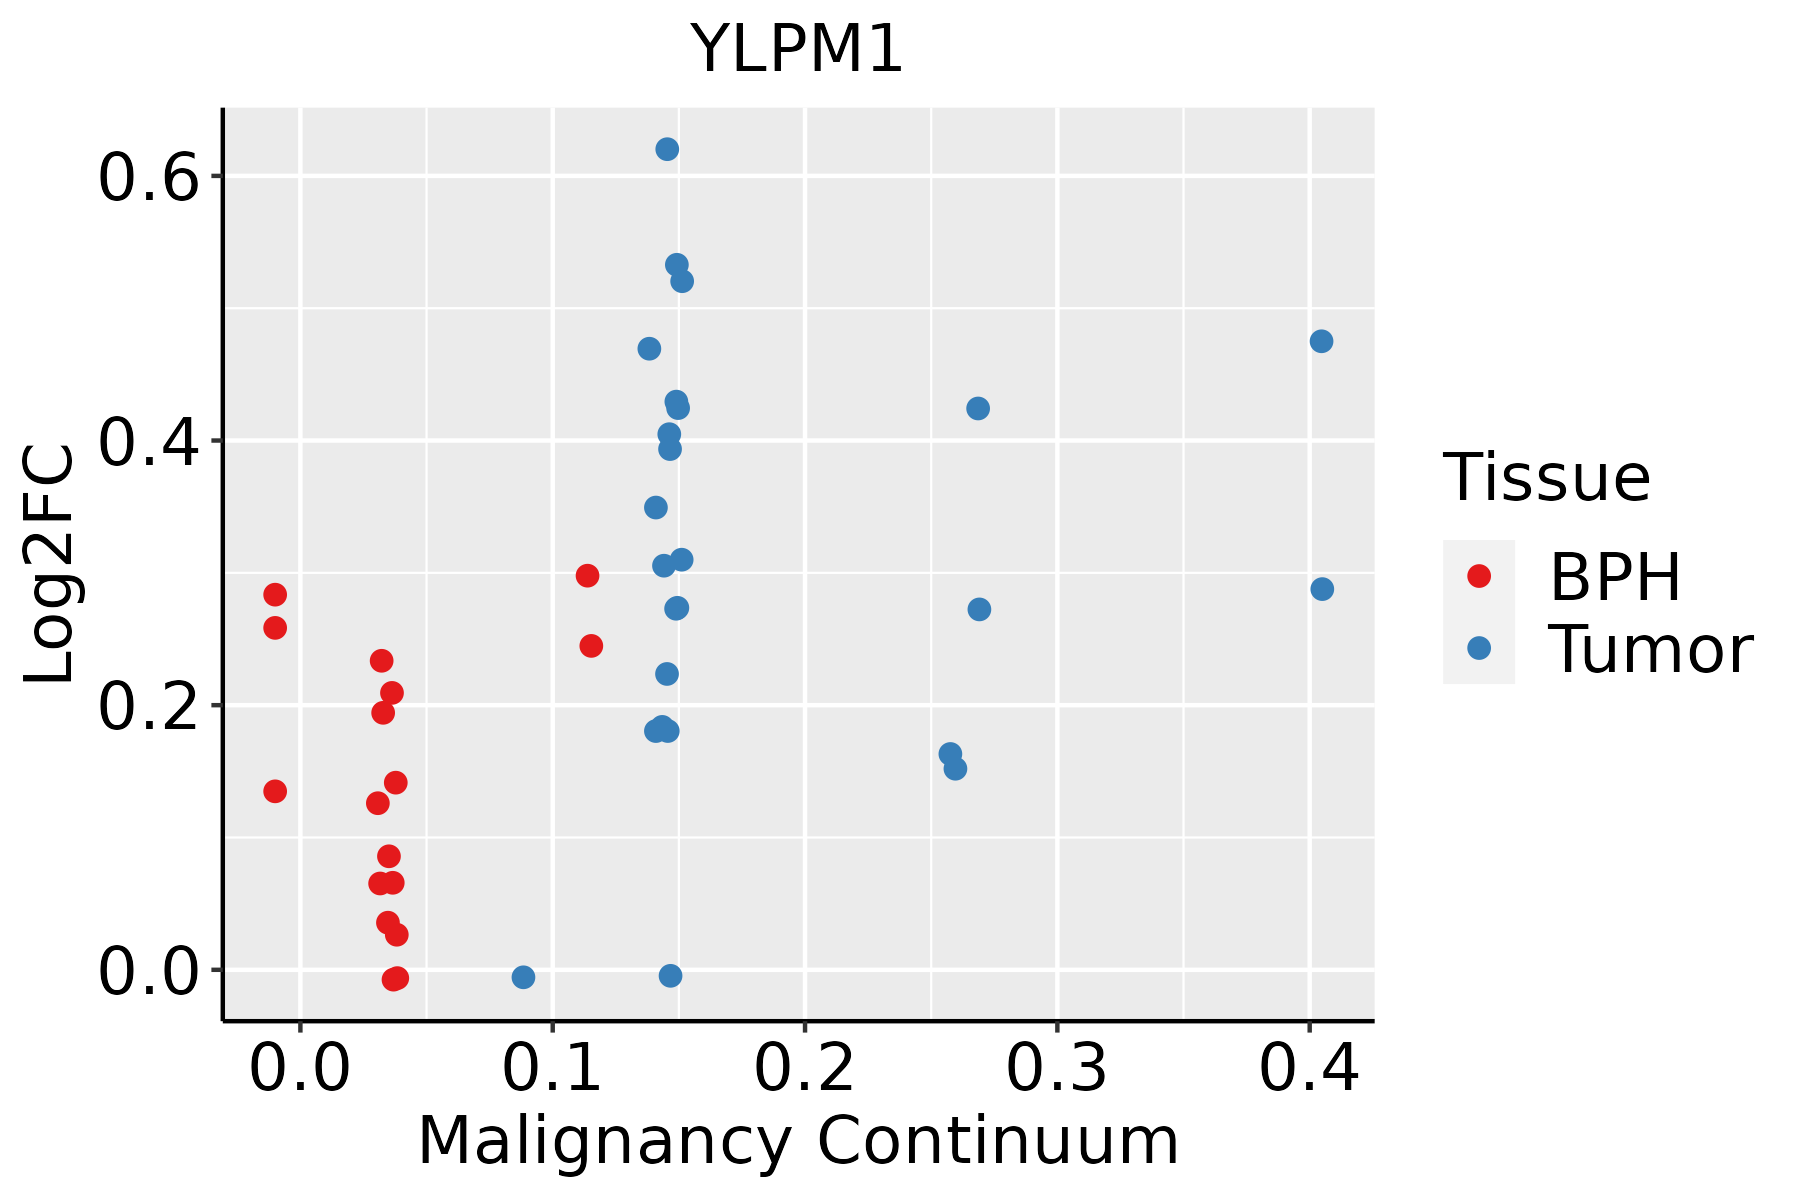
BPH: Benign Prostatic Hyperplasia
ThyroidThe image shows the transcriptomic changes along malignancy continuum.log2FC in expression of this searched gene in stem-like cells from each diseased tissue sample relative to stem-like cells in normal samples in each tissue plotted against the malignancy continuum. Samples are colored based on if they are from different disease stage.
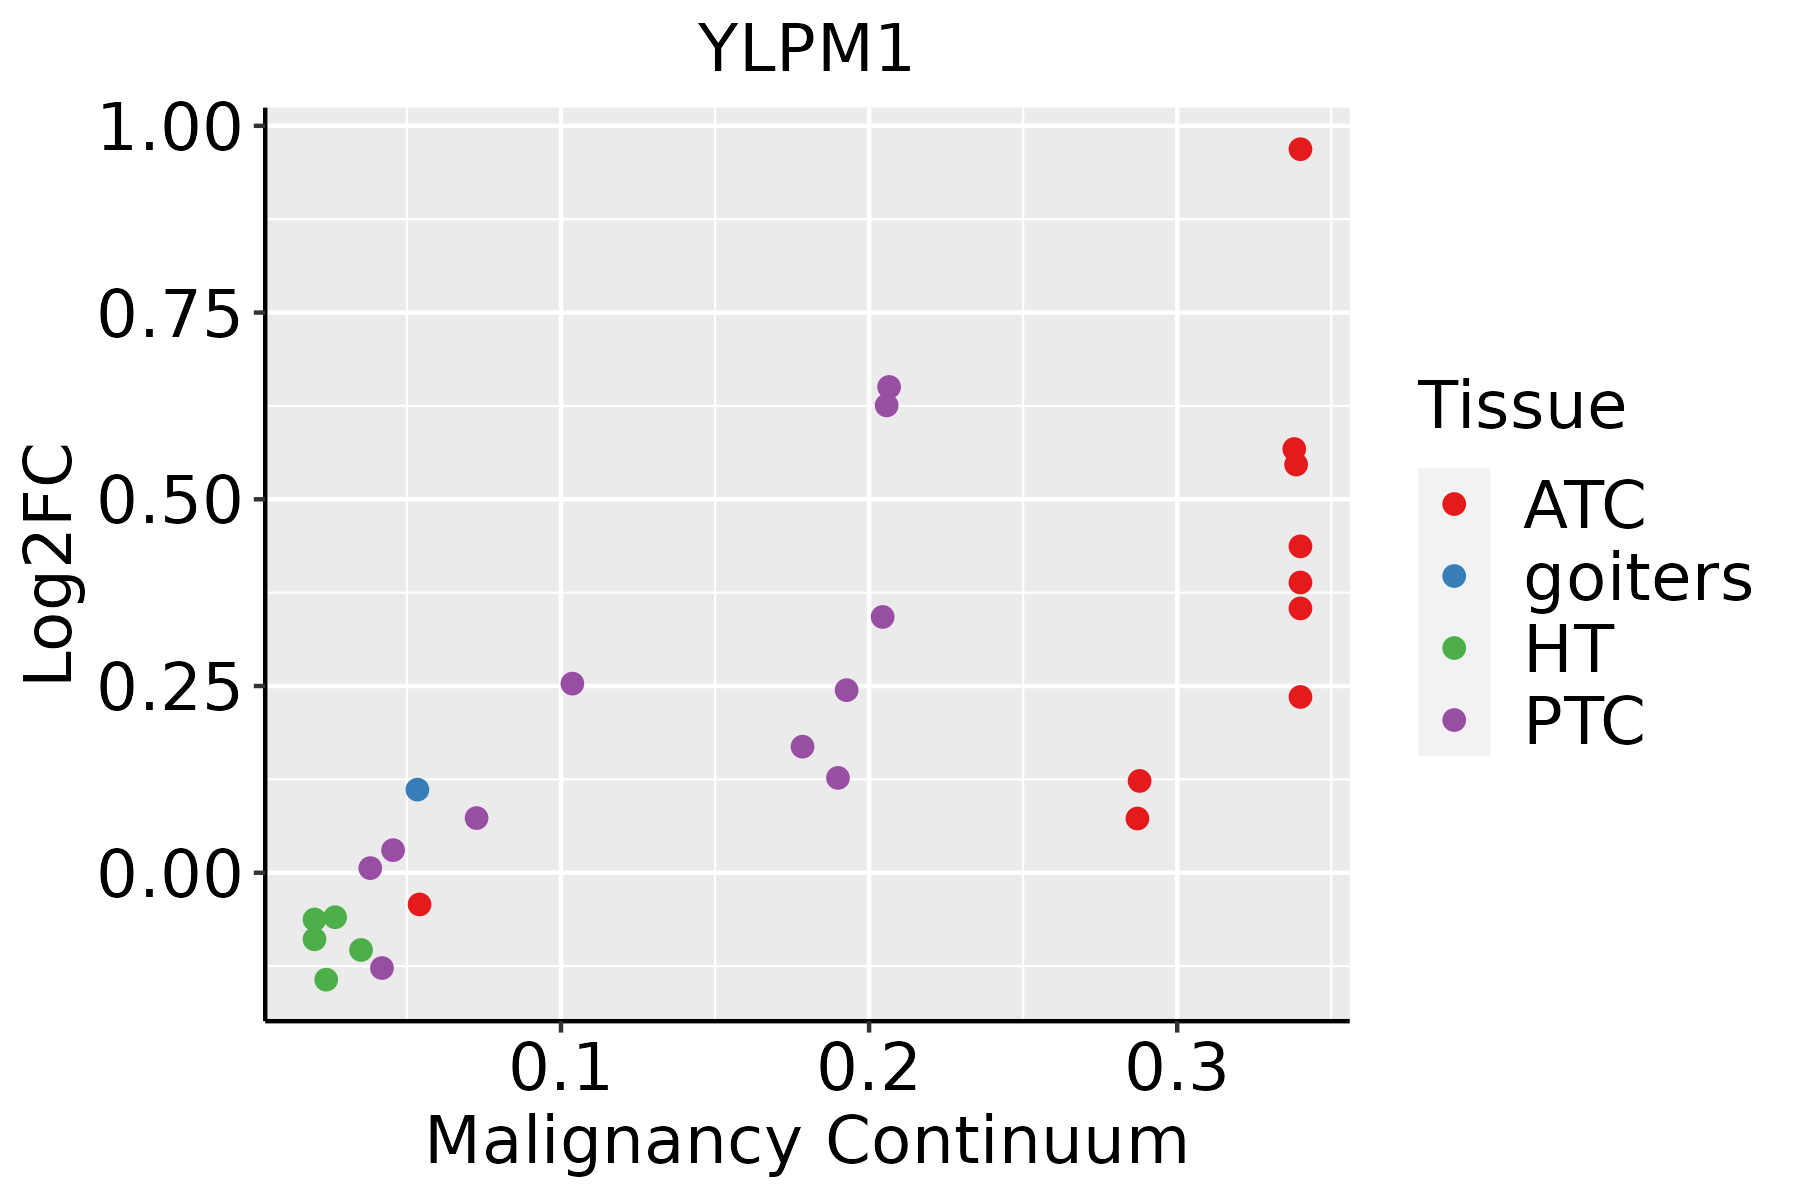
ATC: Anaplastic thyroid cancer
HT: Hashimoto's thyroiditis
PTC: Papillary thyroid cancer
∗log2FC in expression of this searched gene in stem-like cells from each diseased tissue sample relative to stem-like cells in normal samples in each tissue plotted against the malignancy continuum. Samples are colored based on if they are from different disease stage.

Top

Malignant transformation related pathway analysis

check buttonFind out the enriched GO biological processes and KEGG pathways involved in transition from healthy to precancer to cancer
check button Figure of enriched GO biological processes.
TissueDisease StageEnriched GO biological Processes
ColorectumADGO analysis - Figure of enriched GO biological processes: Top 15 enriched GO BP terms are showed in the bar plot of each disease state in each tissue. Each row represents a significant GO biological process which is colored according to the -log10(p.adjust).
ColorectumSERGO analysis - Figure of enriched GO biological processes: Top 15 enriched GO BP terms are showed in the bar plot of each disease state in each tissue. Each row represents a significant GO biological process which is colored according to the -log10(p.adjust).
ColorectumMSSGO analysis - Figure of enriched GO biological processes: Top 15 enriched GO BP terms are showed in the bar plot of each disease state in each tissue. Each row represents a significant GO biological process which is colored according to the -log10(p.adjust).
ColorectumMSI-HGO analysis - Figure of enriched GO biological processes: Top 15 enriched GO BP terms are showed in the bar plot of each disease state in each tissue. Each row represents a significant GO biological process which is colored according to the -log10(p.adjust).
ColorectumFAPGO analysis - Figure of enriched GO biological processes: Top 15 enriched GO BP terms are showed in the bar plot of each disease state in each tissue. Each row represents a significant GO biological process which is colored according to the -log10(p.adjust).
∗Top 15 enriched GO BP terms are showed in the bar plot of each disease state in each tissue. Each row represents a significant GO biological process which is colored according to the -log10(p.adjust).
Page: 1 2 3 4 5 6 7 8 9 

check button Enriched GO biological processes.
GO IDTissueDisease StageDescriptionGene RatioBg Ratiopvaluep.adjustCount
GO:003304416EsophagusESCCregulation of chromosome organization145/8552187/187233.80e-194.31e-17145
GO:005105215EsophagusESCCregulation of DNA metabolic process232/8552359/187232.40e-131.13e-11232
GO:000072319EsophagusESCCtelomere maintenance99/8552131/187232.68e-121.08e-1099
GO:003220417EsophagusESCCregulation of telomere maintenance65/855280/187236.02e-111.90e-0965
GO:003220014EsophagusESCCtelomere organization99/8552159/187231.77e-051.57e-0499
GO:00330444LiverNAFLDregulation of chromosome organization34/1882187/187234.69e-046.74e-0334
GO:00510526LiverNAFLDregulation of DNA metabolic process56/1882359/187235.95e-047.92e-0356
GO:003304421LiverHCCregulation of chromosome organization125/7958187/187231.35e-115.40e-10125
GO:000072311LiverHCCtelomere maintenance85/7958131/187231.86e-073.40e-0685
GO:005105221LiverHCCregulation of DNA metabolic process198/7958359/187237.62e-071.17e-05198
GO:003220411LiverHCCregulation of telomere maintenance55/795880/187231.83e-062.54e-0555
GO:00322001LiverHCCtelomere organization86/7958159/187232.06e-031.04e-0286
GO:00330448Oral cavityOSCCregulation of chromosome organization123/7305187/187239.87e-145.17e-12123
GO:005105210Oral cavityOSCCregulation of DNA metabolic process207/7305359/187234.45e-132.17e-11207
GO:000072316Oral cavityOSCCtelomere maintenance85/7305131/187231.72e-094.09e-0885
GO:003220410Oral cavityOSCCregulation of telomere maintenance55/730580/187236.67e-081.19e-0655
GO:00322006Oral cavityOSCCtelomere organization85/7305159/187231.47e-041.04e-0385
GO:003304422Oral cavityEOLPregulation of chromosome organization50/2218187/187231.80e-087.94e-0750
GO:005105222Oral cavityEOLPregulation of DNA metabolic process75/2218359/187235.81e-071.53e-0575
GO:000072322Oral cavityEOLPtelomere maintenance36/2218131/187238.39e-072.10e-0536
Page: 1 2 3 

check button Enriched KEGG pathways.
Pathway IDTissueDisease StageDescriptionGene RatioBg Ratiopvaluep.adjustqvalueCount
Page: 1 

Top

Cell-cell communication analysis

check buttonIdentification of potential cell-cell interactions between two cell types and their ligand-receptor pairs for different disease states
LigandReceptorLRpairPathwayTissueDisease Stage
Page: 1 

Top

Single-cell gene regulatory network inference analysis

check buttonFind out the significant the regulons (TFs) and the target genes of each regulon across cell types for different disease states
TFCell TypeTissueDisease StageTarget GeneRSSRegulon Activity
∗The dot plots of a searched regulon are shown for all cell subpopulations in each disease state of each tissue based on the regulon specific score inferred using pySCENIC and by calculating the average expression.
Page: 1 

Top

Somatic mutation of malignant transformation related genes

check buttonAnnotation of somatic variants for genes involved in malignant transformation
Hugo SymbolVariant ClassVariant ClassificationdbSNP RSHGVScHGVSpHGVSp ShortSWISSPROTBIOTYPESIFTPolyPhenTumor Sample BarcodeTissueHistologySexAgeStageTherapy TypesDrugsOutcome
YLPM1SNVMissense_Mutationc.6013N>Tp.Asp2005Tyrp.D2005YP49750protein_codingdeleterious(0)probably_damaging(0.989)TCGA-A1-A0SI-01Breastbreast invasive carcinomaFemale<65I/IIUnknownUnknownSD
YLPM1SNVMissense_Mutationc.2722N>Ap.Glu908Lysp.E908KP49750protein_codingtolerated_low_confidence(0.08)benign(0.223)TCGA-AC-A23H-01Breastbreast invasive carcinomaFemale>=65I/IIUnknownUnknownPD
YLPM1SNVMissense_Mutationnovelc.877C>Gp.Gln293Glup.Q293EP49750protein_codingdeleterious_low_confidence(0.03)probably_damaging(0.979)TCGA-AC-A3W5-01Breastbreast invasive carcinomaFemale>=65I/IIChemotherapydocetaxelCR
YLPM1SNVMissense_Mutationc.1129N>Cp.Asp377Hisp.D377HP49750protein_codingdeleterious_low_confidence(0.01)possibly_damaging(0.73)TCGA-AO-A03T-01Breastbreast invasive carcinomaFemale<65I/IIChemotherapycyclophosphamideSD
YLPM1SNVMissense_Mutationnovelc.5174N>Gp.Val1725Glyp.V1725GP49750protein_codingtolerated_low_confidence(0.27)benign(0.001)TCGA-AO-A128-01Breastbreast invasive carcinomaFemale<65I/IIChemotherapydoxorubicinSD
YLPM1SNVMissense_Mutationc.2973T>Gp.His991Glnp.H991QP49750protein_codingtolerated_low_confidence(0.46)benign(0.001)TCGA-AR-A1AY-01Breastbreast invasive carcinomaFemale>=65I/IIUnspecificDoxorubicinSD
YLPM1SNVMissense_Mutationc.2488C>Tp.Pro830Serp.P830SP49750protein_codingtolerated_low_confidence(0.52)benign(0.147)TCGA-B6-A0RM-01Breastbreast invasive carcinomaFemale<65I/IIUnknownUnknownSD
YLPM1SNVMissense_Mutationc.3199G>Ap.Asp1067Asnp.D1067NP49750protein_codingtolerated_low_confidence(0.09)benign(0.082)TCGA-C8-A12T-01Breastbreast invasive carcinomaFemale<65I/IIUnknownUnknownSD
YLPM1SNVMissense_Mutationrs757763862c.4088N>Ap.Arg1363Glnp.R1363QP49750protein_codingdeleterious_low_confidence(0.01)benign(0.018)TCGA-C8-A26Y-01Breastbreast invasive carcinomaFemale>=65I/IIUnknownUnknownSD
YLPM1SNVMissense_Mutationnovelc.4513N>Tp.Met1505Leup.M1505LP49750protein_codingtolerated_low_confidence(0.53)benign(0)TCGA-C8-A8HR-01Breastbreast invasive carcinomaFemale<65III/IVChemotherapy5-fluorouracilCR
Page: 1 2 3 4 5 6 7 8 9 10 11 12 13 14 15 16 17 18 19 20 21 22 

Top

Related drugs of malignant transformation related genes

check buttonIdentification of chemicals and drugs interact with genes involved in malignant transfromation
(DGIdb 4.0)
Entrez IDSymbolCategoryInteraction TypesDrug Claim NameDrug NamePMIDs
Page: 1