
|
|||||
|
 | |
| |
| |
| |
| |
| |
|
Gene: WDHD1 |
Gene summary for WDHD1 |
| Gene information | Species | Human | Gene symbol | WDHD1 | Gene ID | 11169 |
| Gene name | WD repeat and HMG-box DNA binding protein 1 | |
| Gene Alias | AND-1 | |
| Cytomap | 14q22.2-q22.3 | |
| Gene Type | protein-coding | GO ID | GO:0000278 | UniProtAcc | O75717 |
Top |
Malignant transformation analysis |
| Identification of the aberrant gene expression in precancerous and cancerous lesions by comparing the gene expression of stem-like cells in diseased tissues with normal stem cells |
| Entrez ID | Symbol | Replicates | Species | Organ | Tissue | Adj P-value | Log2FC | Malignancy |
| 11169 | WDHD1 | P65T-E | Human | Esophagus | ESCC | 5.29e-07 | 2.09e-01 | 0.0978 |
| 11169 | WDHD1 | P74T-E | Human | Esophagus | ESCC | 3.23e-09 | 2.81e-01 | 0.1479 |
| 11169 | WDHD1 | P75T-E | Human | Esophagus | ESCC | 4.30e-10 | 2.78e-01 | 0.1125 |
| 11169 | WDHD1 | P76T-E | Human | Esophagus | ESCC | 1.66e-02 | 1.08e-01 | 0.1207 |
| 11169 | WDHD1 | P79T-E | Human | Esophagus | ESCC | 1.47e-14 | 3.42e-01 | 0.1154 |
| 11169 | WDHD1 | P80T-E | Human | Esophagus | ESCC | 9.98e-09 | 2.77e-01 | 0.155 |
| 11169 | WDHD1 | P83T-E | Human | Esophagus | ESCC | 2.18e-14 | 3.89e-01 | 0.1738 |
| 11169 | WDHD1 | P89T-E | Human | Esophagus | ESCC | 3.35e-02 | 2.18e-01 | 0.1752 |
| 11169 | WDHD1 | P91T-E | Human | Esophagus | ESCC | 1.76e-08 | 7.43e-01 | 0.1828 |
| 11169 | WDHD1 | P107T-E | Human | Esophagus | ESCC | 1.37e-14 | 3.34e-01 | 0.171 |
| 11169 | WDHD1 | P128T-E | Human | Esophagus | ESCC | 1.49e-11 | 3.38e-01 | 0.1241 |
| 11169 | WDHD1 | P130T-E | Human | Esophagus | ESCC | 2.39e-24 | 5.52e-01 | 0.1676 |
| Page: 1 2 3 |
| Tissue | Expression Dynamics | Abbreviation |
| Cervix | 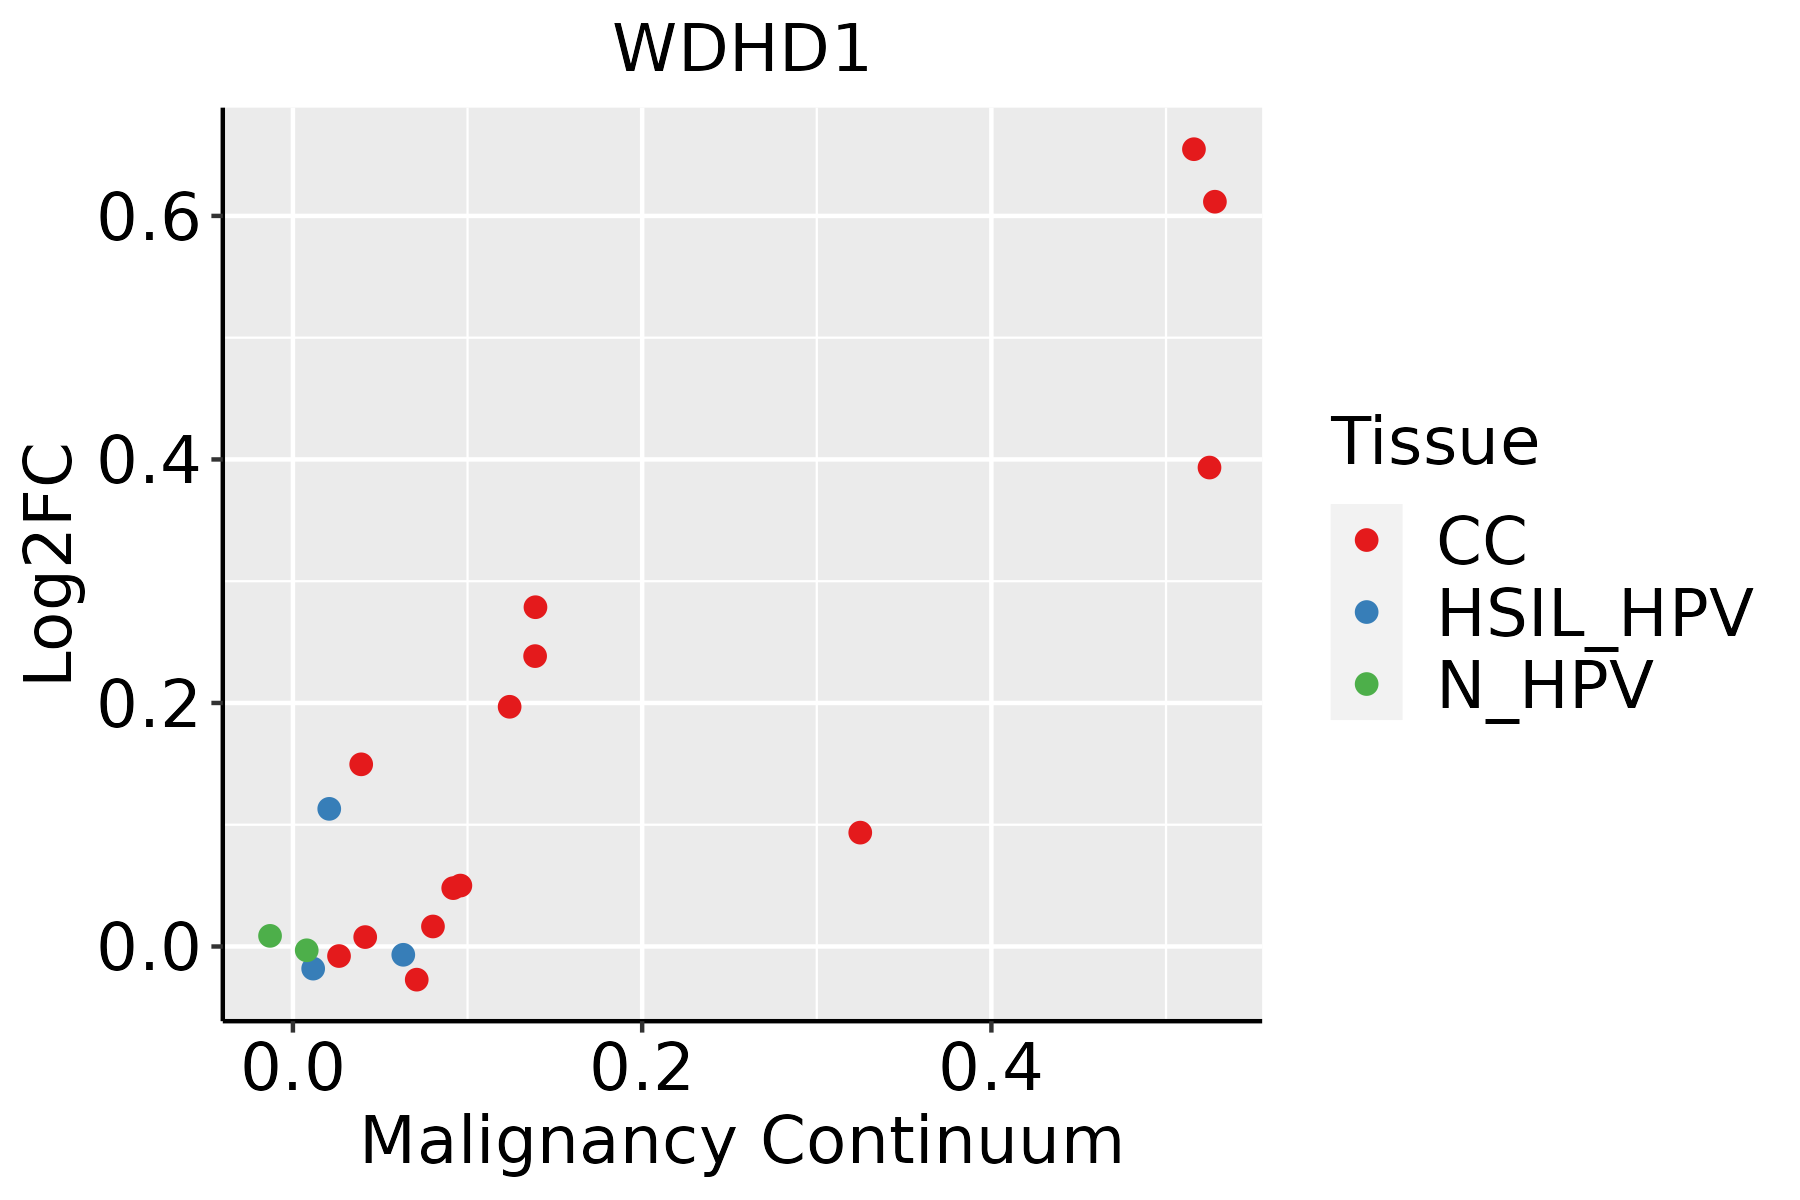 | CC: Cervix cancer |
| HSIL_HPV: HPV-infected high-grade squamous intraepithelial lesions | ||
| N_HPV: HPV-infected normal cervix | ||
| Esophagus | 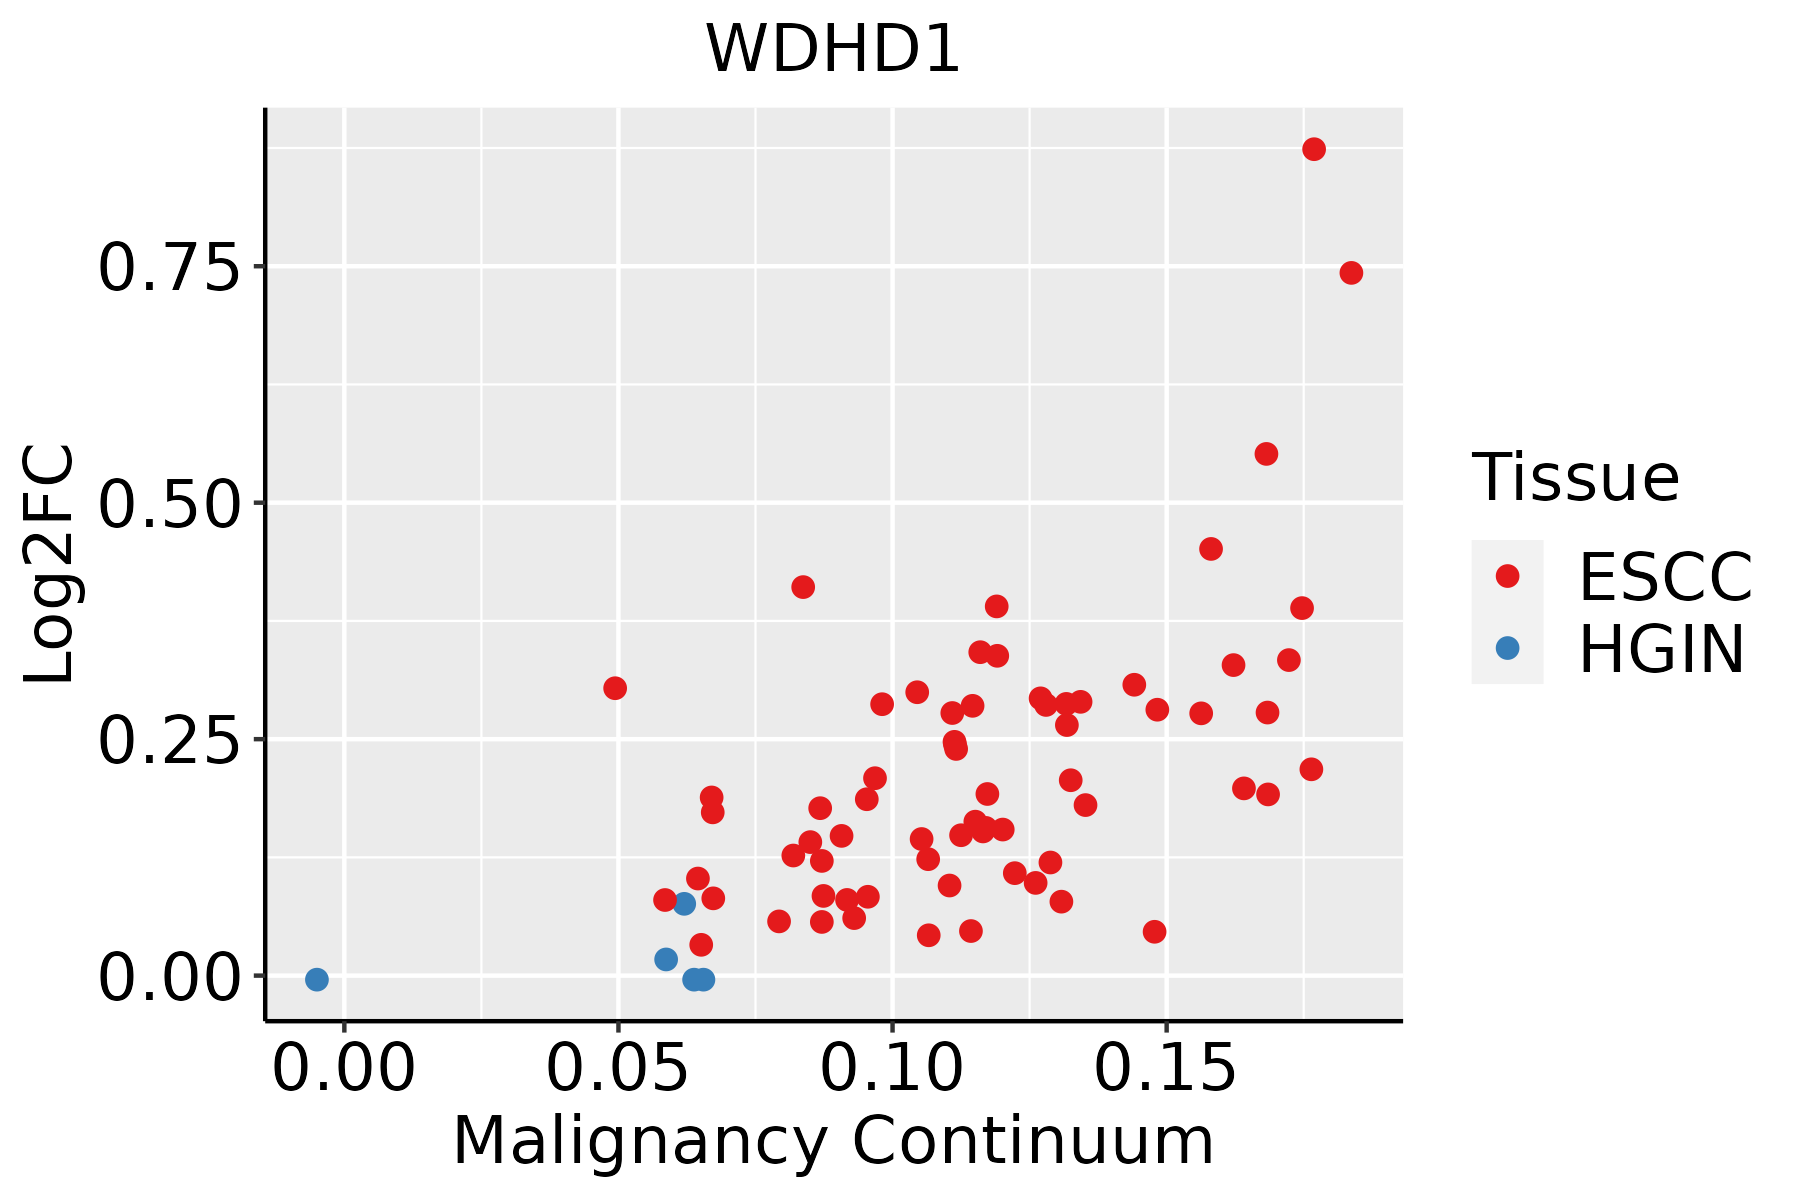 | ESCC: Esophageal squamous cell carcinoma |
| HGIN: High-grade intraepithelial neoplasias | ||
| LGIN: Low-grade intraepithelial neoplasias |
| ∗log2FC in expression of this searched gene in stem-like cells from each diseased tissue sample relative to stem-like cells in normal samples in each tissue plotted against the malignancy continuum. Samples are colored based on if they are from different disease stage. |
Top |
Malignant transformation related pathway analysis |
| Find out the enriched GO biological processes and KEGG pathways involved in transition from healthy to precancer to cancer |
| Tissue | Disease Stage | Enriched GO biological Processes |
| Colorectum | AD |  |
| Colorectum | SER |  |
| Colorectum | MSS |  |
| Colorectum | MSI-H |  |
| Colorectum | FAP |  |
| ∗Top 15 enriched GO BP terms are showed in the bar plot of each disease state in each tissue. Each row represents a significant GO biological process which is colored according to the -log10(p.adjust). |
| Page: 1 2 3 4 5 6 7 8 9 |
| GO ID | Tissue | Disease Stage | Description | Gene Ratio | Bg Ratio | pvalue | p.adjust | Count |
| GO:00062602 | Cervix | CC | DNA replication | 48/2311 | 260/18723 | 2.70e-03 | 1.85e-02 | 48 |
| GO:00062604 | Esophagus | ESCC | DNA replication | 181/8552 | 260/18723 | 3.55e-15 | 2.05e-13 | 181 |
| GO:00062612 | Esophagus | ESCC | DNA-dependent DNA replication | 100/8552 | 151/18723 | 2.61e-07 | 3.94e-06 | 100 |
| Page: 1 |
| Pathway ID | Tissue | Disease Stage | Description | Gene Ratio | Bg Ratio | pvalue | p.adjust | qvalue | Count |
| Page: 1 |
Top |
Cell-cell communication analysis |
| Identification of potential cell-cell interactions between two cell types and their ligand-receptor pairs for different disease states |
| Ligand | Receptor | LRpair | Pathway | Tissue | Disease Stage |
| Page: 1 |
Top |
Single-cell gene regulatory network inference analysis |
| Find out the significant the regulons (TFs) and the target genes of each regulon across cell types for different disease states |
| TF | Cell Type | Tissue | Disease Stage | Target Gene | RSS | Regulon Activity |
| ∗The dot plots of a searched regulon are shown for all cell subpopulations in each disease state of each tissue based on the regulon specific score inferred using pySCENIC and by calculating the average expression. |
| Page: 1 |
Top |
Somatic mutation of malignant transformation related genes |
| Annotation of somatic variants for genes involved in malignant transformation |
| Hugo Symbol | Variant Class | Variant Classification | dbSNP RS | HGVSc | HGVSp | HGVSp Short | SWISSPROT | BIOTYPE | SIFT | PolyPhen | Tumor Sample Barcode | Tissue | Histology | Sex | Age | Stage | Therapy Types | Drugs | Outcome |
| WDHD1 | SNV | Missense_Mutation | c.2551N>C | p.Glu851Gln | p.E851Q | O75717 | protein_coding | deleterious(0.03) | possibly_damaging(0.494) | TCGA-AC-A23H-01 | Breast | breast invasive carcinoma | Female | >=65 | I/II | Unknown | Unknown | PD | |
| WDHD1 | SNV | Missense_Mutation | rs372886136 | c.1943N>A | p.Arg648Gln | p.R648Q | O75717 | protein_coding | deleterious(0.02) | benign(0.21) | TCGA-AN-A046-01 | Breast | breast invasive carcinoma | Female | >=65 | I/II | Unknown | Unknown | SD |
| WDHD1 | SNV | Missense_Mutation | novel | c.2332N>A | p.Glu778Lys | p.E778K | O75717 | protein_coding | deleterious(0) | probably_damaging(0.982) | TCGA-BH-A0HF-01 | Breast | breast invasive carcinoma | Female | >=65 | I/II | Hormone Therapy | arimidex | SD |
| WDHD1 | SNV | Missense_Mutation | c.3322A>C | p.Lys1108Gln | p.K1108Q | O75717 | protein_coding | deleterious(0) | probably_damaging(0.999) | TCGA-BH-A0WA-01 | Breast | breast invasive carcinoma | Female | >=65 | I/II | Unknown | Unknown | SD | |
| WDHD1 | SNV | Missense_Mutation | c.1752C>A | p.Phe584Leu | p.F584L | O75717 | protein_coding | tolerated(1) | benign(0) | TCGA-D8-A27G-01 | Breast | breast invasive carcinoma | Female | >=65 | I/II | Unknown | Unknown | SD | |
| WDHD1 | SNV | Missense_Mutation | novel | c.2788N>A | p.Ala930Thr | p.A930T | O75717 | protein_coding | tolerated(0.51) | benign(0) | TCGA-2W-A8YY-01 | Cervix | cervical & endocervical cancer | Female | <65 | I/II | Chemotherapy | cisplatin | CR |
| WDHD1 | SNV | Missense_Mutation | novel | c.194N>T | p.Gly65Val | p.G65V | O75717 | protein_coding | deleterious(0) | possibly_damaging(0.653) | TCGA-AA-3984-01 | Colorectum | colon adenocarcinoma | Female | <65 | I/II | Unknown | Unknown | SD |
| WDHD1 | SNV | Missense_Mutation | rs770036425 | c.398N>A | p.Arg133Gln | p.R133Q | O75717 | protein_coding | deleterious(0.02) | probably_damaging(0.944) | TCGA-AA-A00N-01 | Colorectum | colon adenocarcinoma | Male | >=65 | I/II | Unknown | Unknown | PD |
| WDHD1 | SNV | Missense_Mutation | c.2410N>T | p.Arg804Trp | p.R804W | O75717 | protein_coding | deleterious(0) | probably_damaging(0.993) | TCGA-AA-A01R-01 | Colorectum | colon adenocarcinoma | Male | <65 | III/IV | Chemotherapy | 5-fluorouracil | PD | |
| WDHD1 | SNV | Missense_Mutation | novel | c.544N>A | p.Asp182Asn | p.D182N | O75717 | protein_coding | deleterious(0) | probably_damaging(0.994) | TCGA-AZ-4315-01 | Colorectum | colon adenocarcinoma | Male | <65 | I/II | Unknown | Unknown | SD |
| Page: 1 2 3 4 5 6 7 8 9 |
Top |
Related drugs of malignant transformation related genes |
| Identification of chemicals and drugs interact with genes involved in malignant transfromation |
| (DGIdb 4.0) |
| Entrez ID | Symbol | Category | Interaction Types | Drug Claim Name | Drug Name | PMIDs |
| Page: 1 |

Copyright 2023-Present -The University of Texas Health Science Center at Houston |