
|
|||||
|
 | |
| |
| |
| |
| |
| |
|
Gene: VCAN |
Gene summary for VCAN |
| Gene information | Species | Human | Gene symbol | VCAN | Gene ID | 1462 |
| Gene name | versican | |
| Gene Alias | CSPG2 | |
| Cytomap | 5q14.2-q14.3 | |
| Gene Type | protein-coding | GO ID | GO:0001501 | UniProtAcc | P13611 |
Top |
Malignant transformation analysis |
| Identification of the aberrant gene expression in precancerous and cancerous lesions by comparing the gene expression of stem-like cells in diseased tissues with normal stem cells |
| Entrez ID | Symbol | Replicates | Species | Organ | Tissue | Adj P-value | Log2FC | Malignancy |
| 1462 | VCAN | P130T-E | Human | Esophagus | ESCC | 1.16e-02 | 4.50e-01 | 0.1676 |
| 1462 | VCAN | C21 | Human | Oral cavity | OSCC | 1.46e-02 | -7.33e-02 | 0.2678 |
| 1462 | VCAN | C09 | Human | Oral cavity | OSCC | 8.90e-17 | 1.13e+00 | 0.1431 |
| 1462 | VCAN | NEOLP-1 | Human | Oral cavity | NEOLP | 1.75e-21 | 8.05e-01 | -0.0194 |
| 1462 | VCAN | GSM5252126_BPH283PrGF_Via | Human | Prostate | BPH | 1.04e-13 | 5.93e-01 | -0.1771 |
| 1462 | VCAN | GSM5252127_BPH283PrSF_Via | Human | Prostate | BPH | 7.96e-19 | 1.08e+00 | -0.1453 |
| 1462 | VCAN | GSM5252128_BPH327PrGF_Via | Human | Prostate | BPH | 1.06e-38 | 1.20e+00 | -0.1688 |
| 1462 | VCAN | GSM5252129_BPH327PrSF_Via | Human | Prostate | BPH | 6.28e-13 | 1.10e+00 | -0.1697 |
| 1462 | VCAN | GSM5252131_BPH340PrSF_Via | Human | Prostate | BPH | 2.01e-14 | 4.94e-01 | -0.2126 |
| 1462 | VCAN | GSM5252132_BPH389PrGF | Human | Prostate | BPH | 3.84e-16 | 1.09e+00 | -0.2247 |
| 1462 | VCAN | GSM5252134_BPH511PrG_Fcol_3GEX | Human | Prostate | BPH | 3.06e-11 | 5.61e-01 | -0.1433 |
| 1462 | VCAN | GSM5252136_BPH556PrGA1_Fcol | Human | Prostate | BPH | 6.25e-26 | 9.73e-01 | -0.23 |
| 1462 | VCAN | GSM5252137_BPH556PrGA2_Fcol | Human | Prostate | BPH | 3.37e-47 | 1.82e+00 | -0.23 |
| 1462 | VCAN | 048752_1579-all-cells | Human | Prostate | BPH | 1.89e-31 | 7.87e-01 | 0.1008 |
| 1462 | VCAN | 052095_1628-all-cells | Human | Prostate | BPH | 2.69e-22 | 5.65e-01 | 0.1032 |
| 1462 | VCAN | 052097_1595-all-cells | Human | Prostate | BPH | 1.21e-12 | 4.15e-01 | 0.0972 |
| 1462 | VCAN | 052099_1652-all-cells | Human | Prostate | BPH | 5.29e-38 | 8.18e-01 | 0.1038 |
| 1462 | VCAN | Dong_P1 | Human | Prostate | Tumor | 1.79e-03 | -3.37e-03 | 0.035 |
| 1462 | VCAN | Dong_P3 | Human | Prostate | Tumor | 1.67e-17 | 4.40e-01 | 0.0278 |
| 1462 | VCAN | Dong_P5 | Human | Prostate | Tumor | 4.05e-02 | 2.67e-02 | 0.053 |
| Page: 1 2 3 4 5 |
| Tissue | Expression Dynamics | Abbreviation |
| Endometrium | 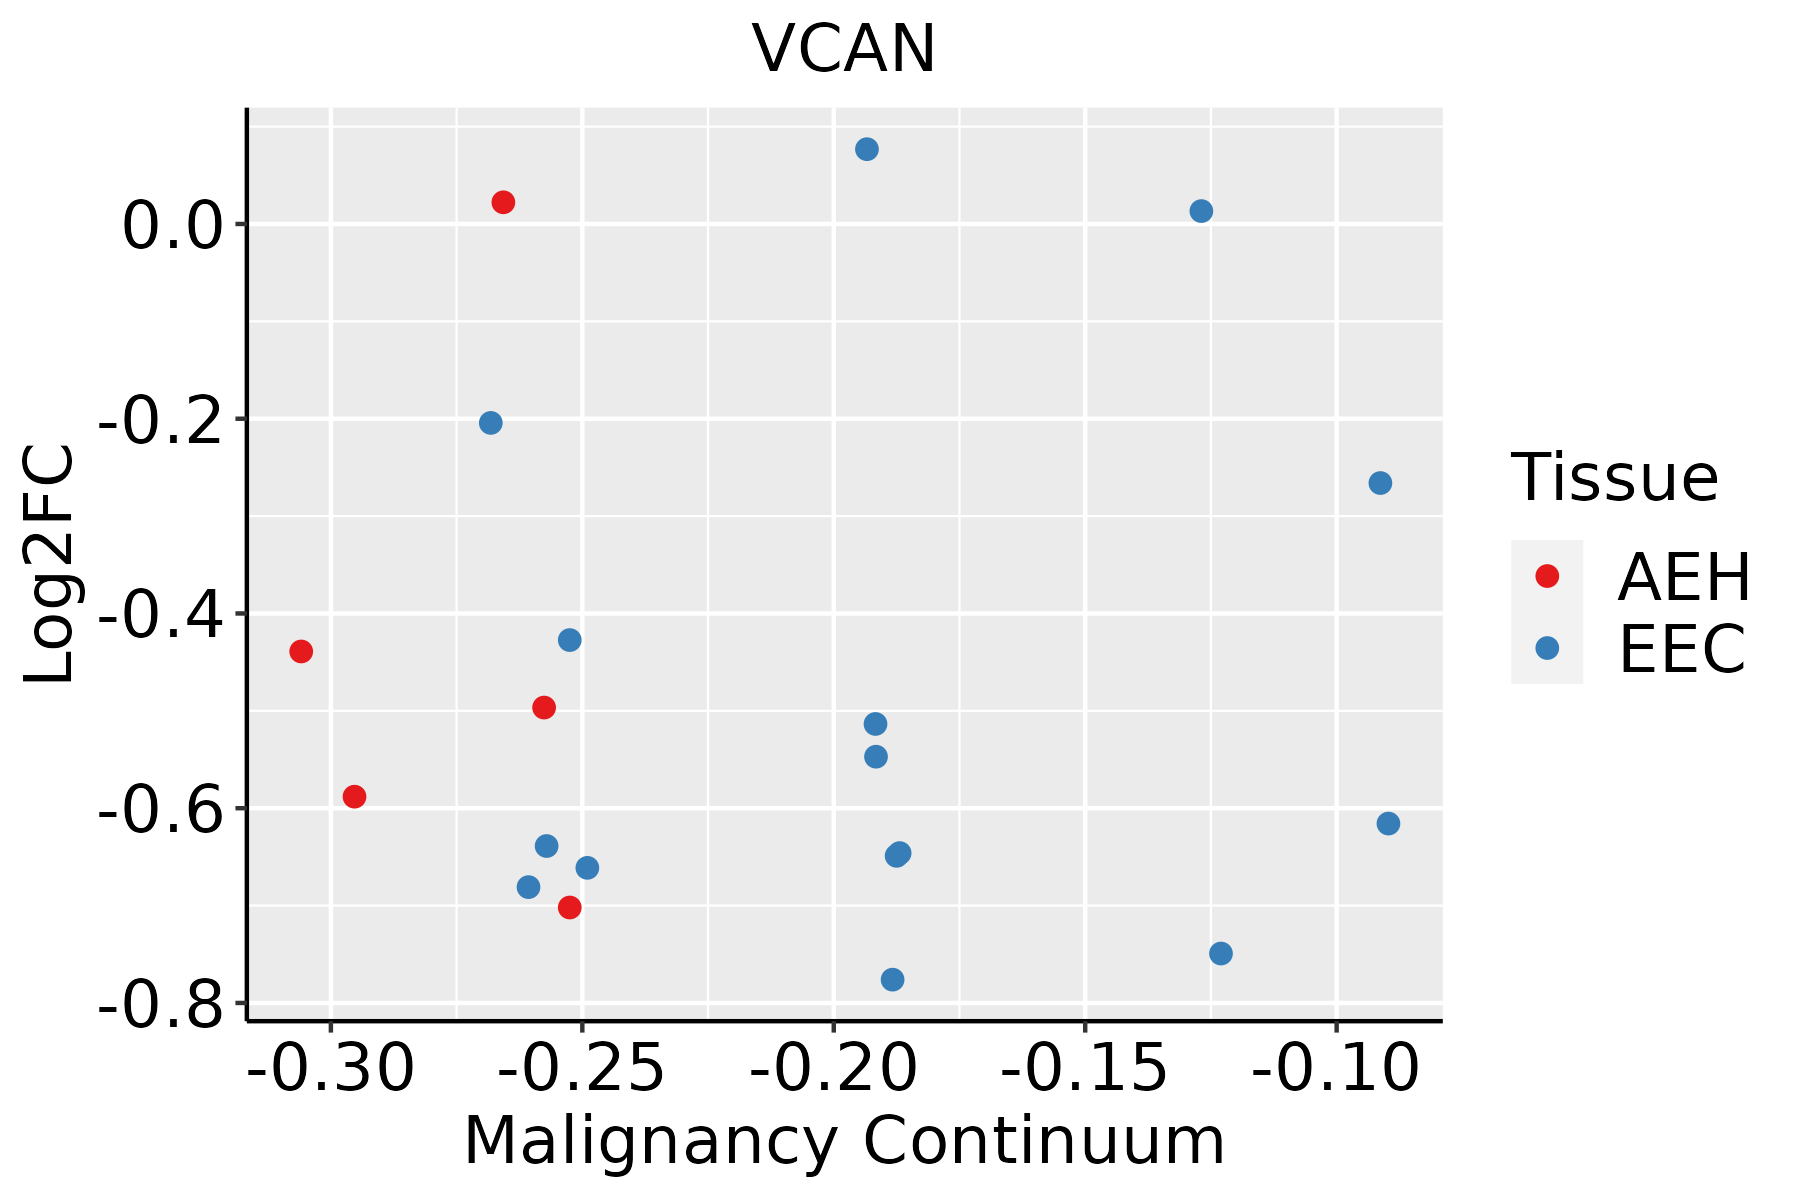 | AEH: Atypical endometrial hyperplasia |
| EEC: Endometrioid Cancer | ||
| Esophagus |  | ESCC: Esophageal squamous cell carcinoma |
| HGIN: High-grade intraepithelial neoplasias | ||
| LGIN: Low-grade intraepithelial neoplasias | ||
| Oral Cavity | 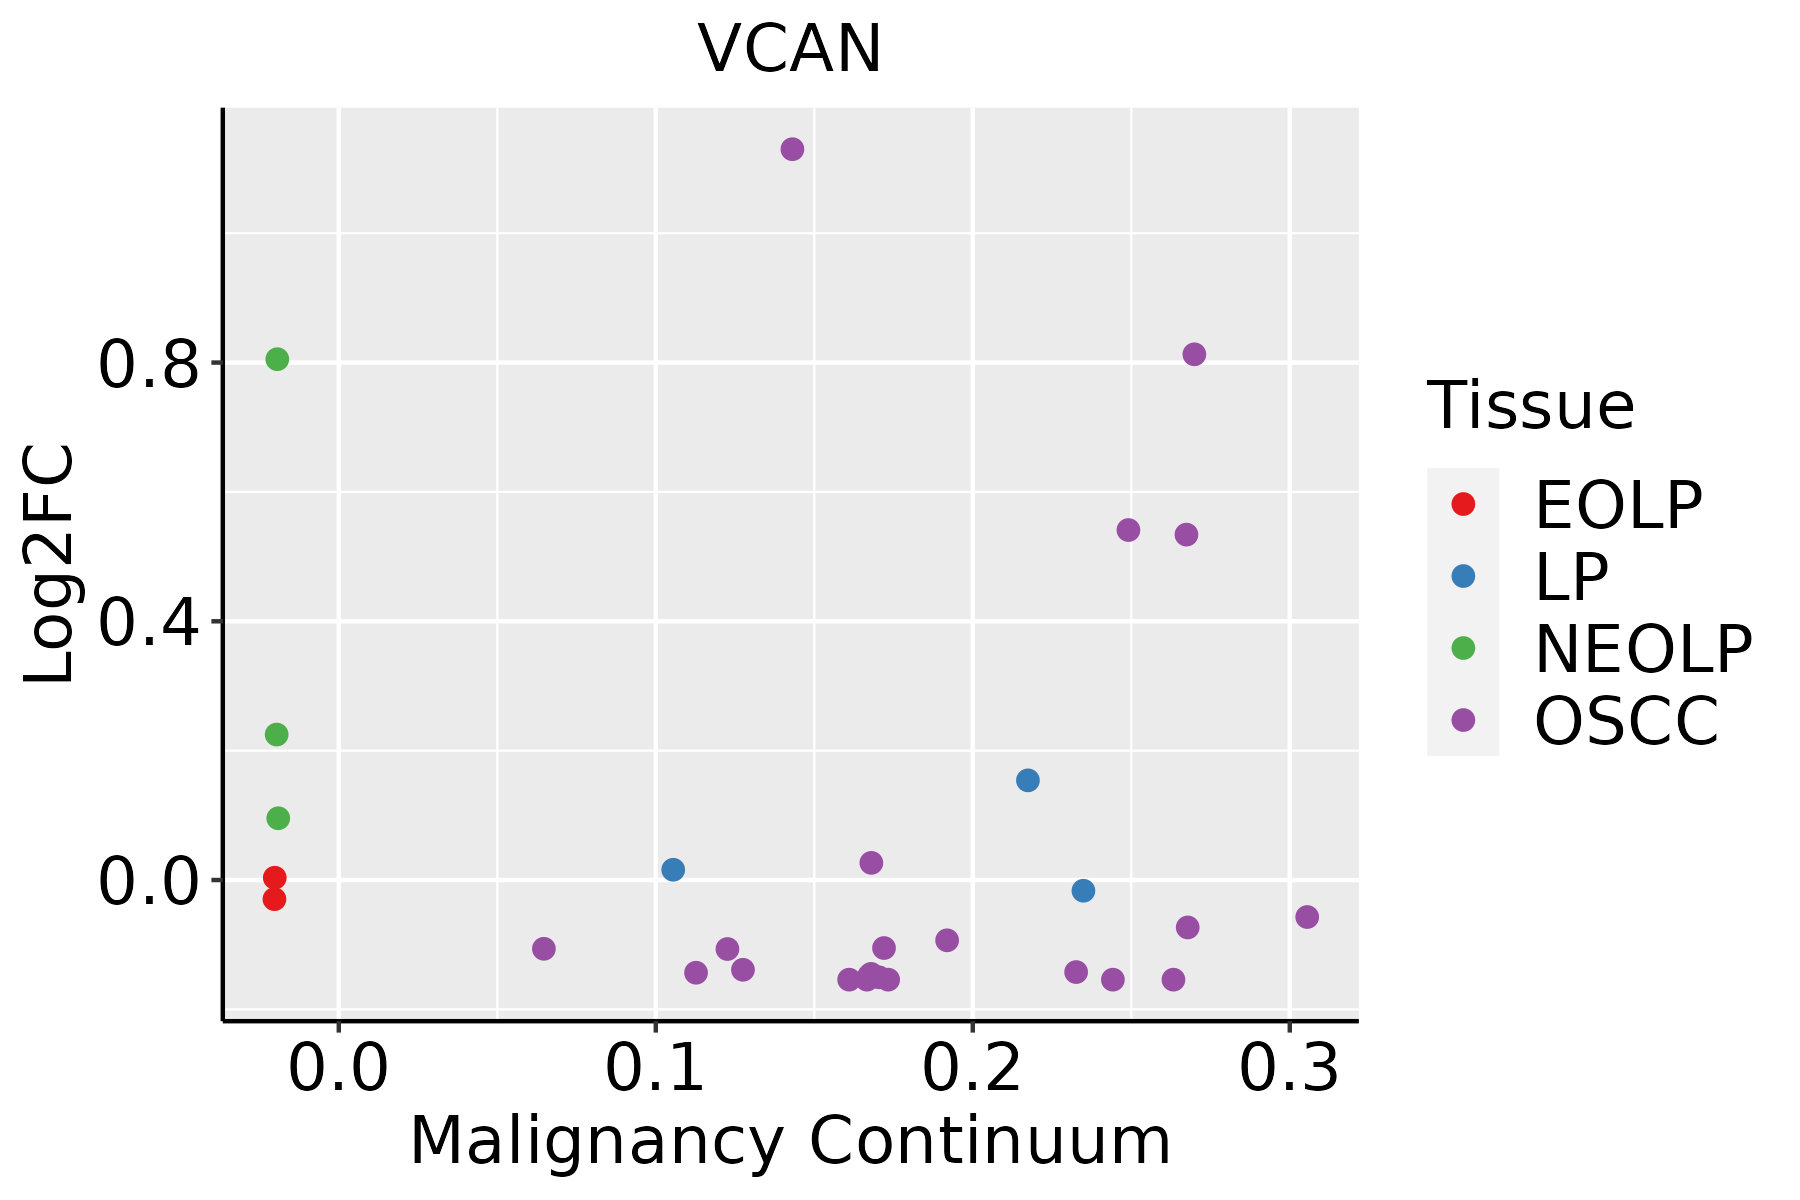 | EOLP: Erosive Oral lichen planus |
| LP: leukoplakia | ||
| NEOLP: Non-erosive oral lichen planus | ||
| OSCC: Oral squamous cell carcinoma | ||
| Prostate |  | BPH: Benign Prostatic Hyperplasia |
| Skin | 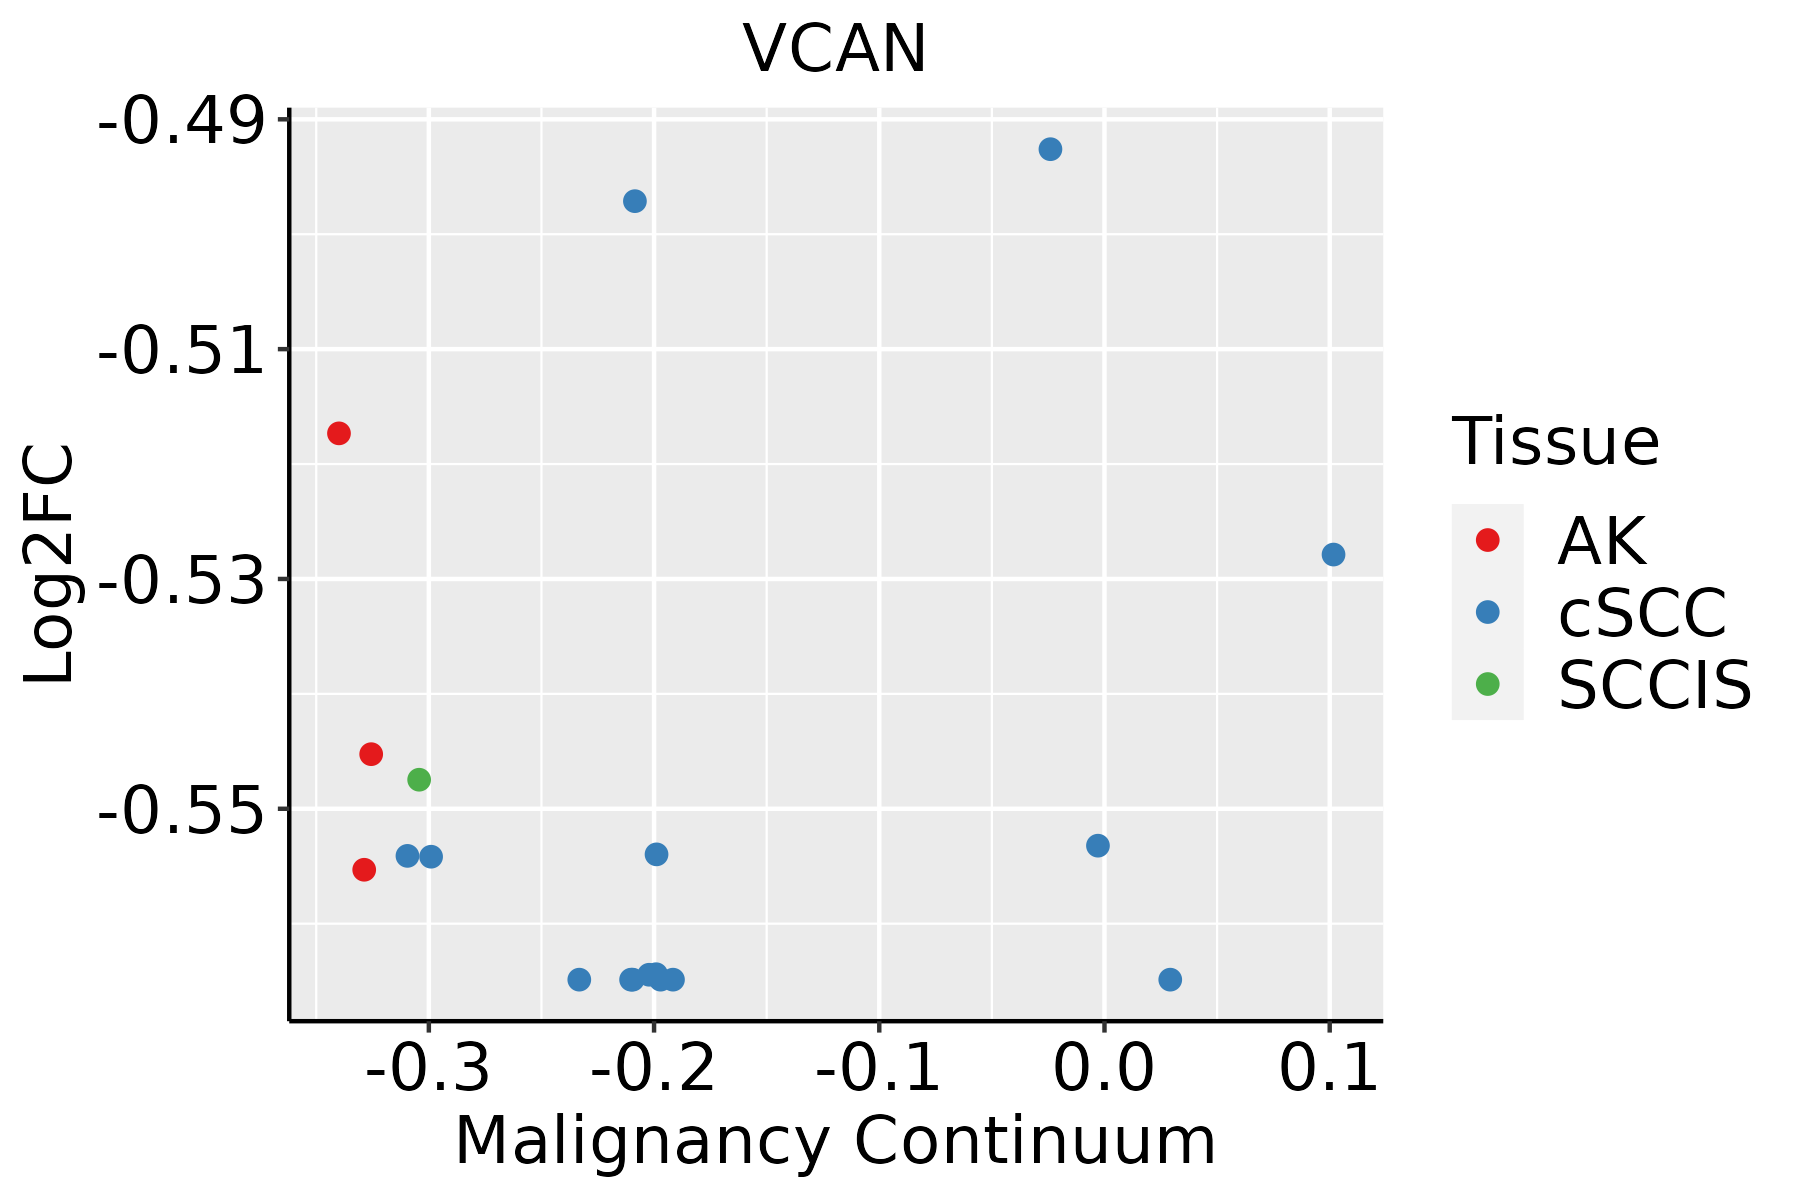 | AK: Actinic keratosis |
| cSCC: Cutaneous squamous cell carcinoma | ||
| SCCIS:squamous cell carcinoma in situ | ||
| Thyroid | 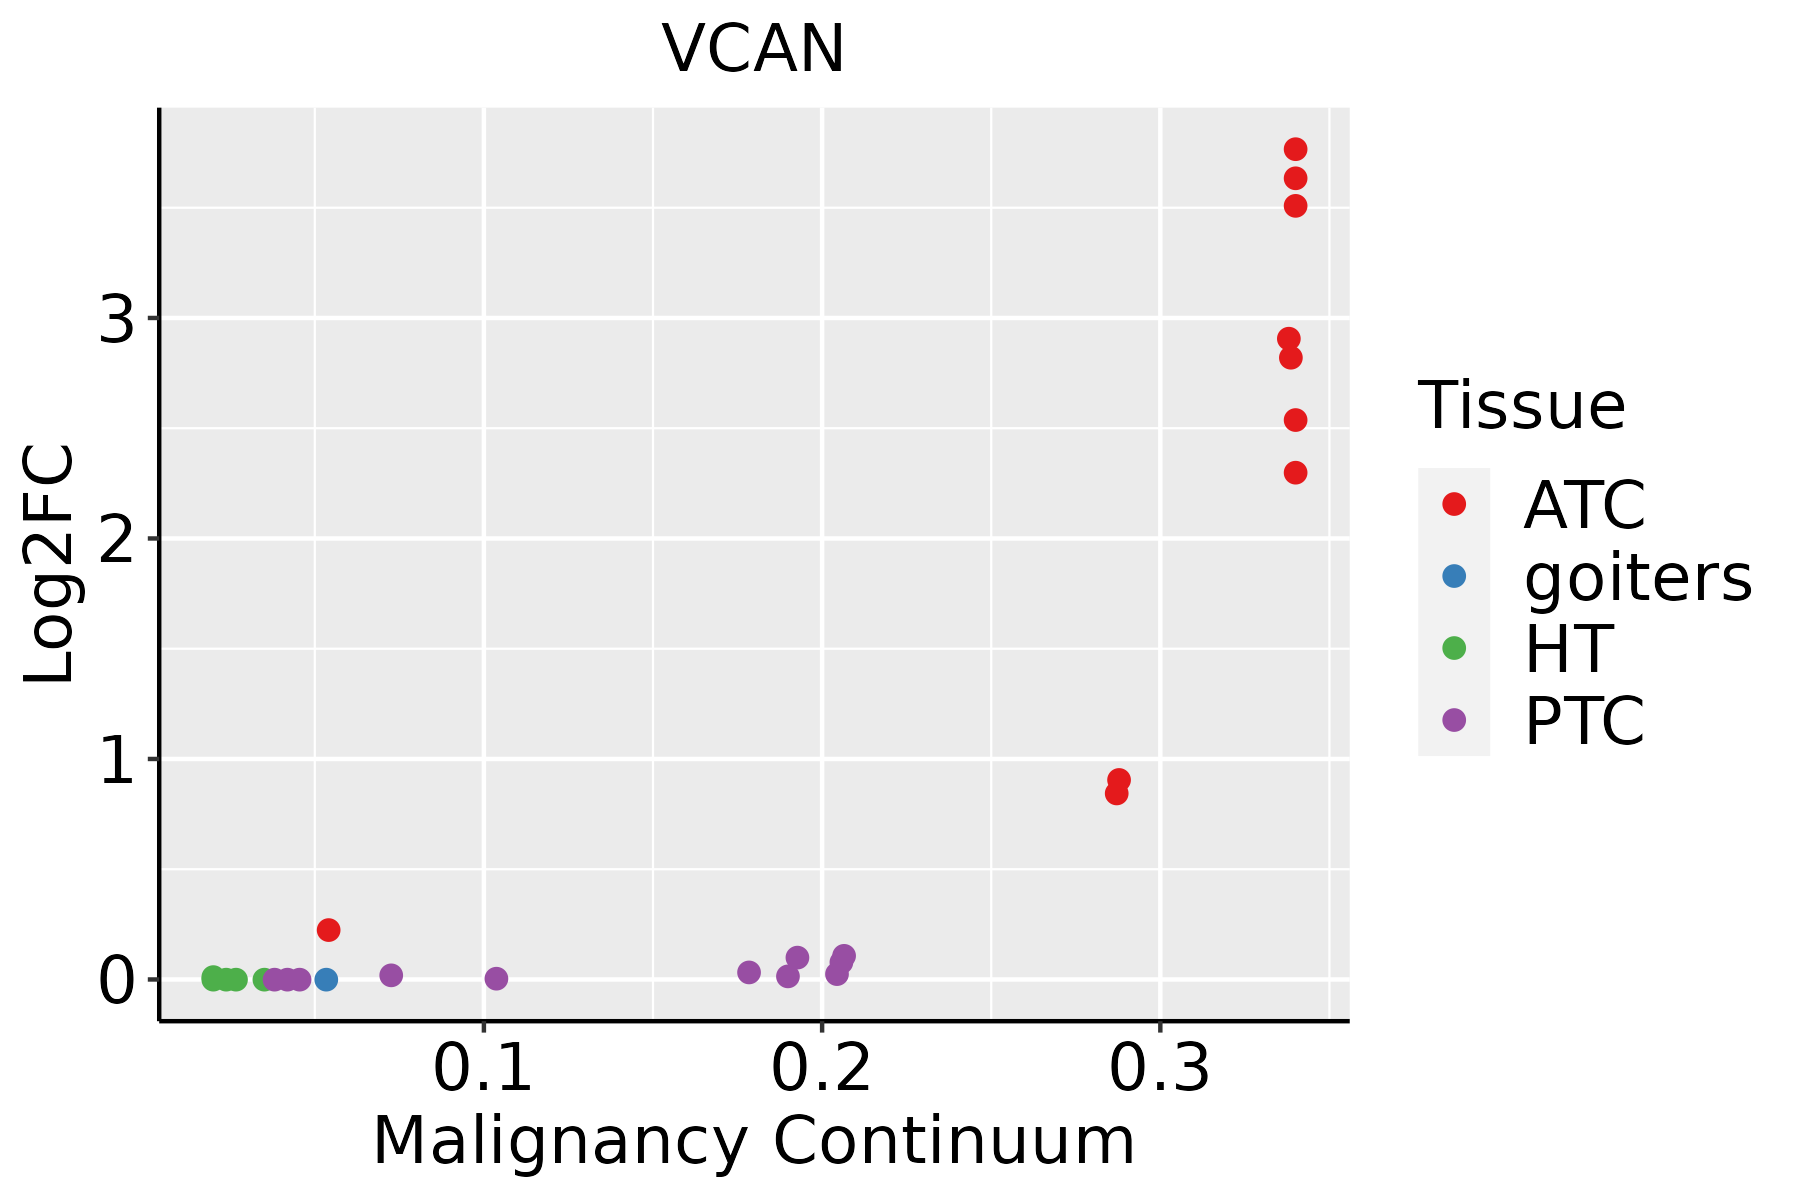 | ATC: Anaplastic thyroid cancer |
| HT: Hashimoto's thyroiditis | ||
| PTC: Papillary thyroid cancer |
| ∗log2FC in expression of this searched gene in stem-like cells from each diseased tissue sample relative to stem-like cells in normal samples in each tissue plotted against the malignancy continuum. Samples are colored based on if they are from different disease stage. |
Top |
Malignant transformation related pathway analysis |
| Find out the enriched GO biological processes and KEGG pathways involved in transition from healthy to precancer to cancer |
| Tissue | Disease Stage | Enriched GO biological Processes |
| Colorectum | AD |  |
| Colorectum | SER |  |
| Colorectum | MSS |  |
| Colorectum | MSI-H |  |
| Colorectum | FAP |  |
| ∗Top 15 enriched GO BP terms are showed in the bar plot of each disease state in each tissue. Each row represents a significant GO biological process which is colored according to the -log10(p.adjust). |
| Page: 1 2 3 4 5 6 7 8 9 |
| GO ID | Tissue | Disease Stage | Description | Gene Ratio | Bg Ratio | pvalue | p.adjust | Count |
| GO:00016498 | Endometrium | AEH | osteoblast differentiation | 52/2100 | 229/18723 | 4.74e-07 | 1.92e-05 | 52 |
| GO:00015038 | Endometrium | AEH | ossification | 78/2100 | 408/18723 | 1.54e-06 | 4.85e-05 | 78 |
| GO:000164914 | Endometrium | EEC | osteoblast differentiation | 53/2168 | 229/18723 | 5.32e-07 | 2.02e-05 | 53 |
| GO:000150313 | Endometrium | EEC | ossification | 79/2168 | 408/18723 | 2.72e-06 | 7.67e-05 | 79 |
| GO:000164918 | Esophagus | ESCC | osteoblast differentiation | 140/8552 | 229/18723 | 1.63e-06 | 1.95e-05 | 140 |
| GO:000150317 | Esophagus | ESCC | ossification | 232/8552 | 408/18723 | 3.00e-06 | 3.40e-05 | 232 |
| GO:000150310 | Oral cavity | OSCC | ossification | 203/7305 | 408/18723 | 5.54e-06 | 6.19e-05 | 203 |
| GO:000164910 | Oral cavity | OSCC | osteoblast differentiation | 118/7305 | 229/18723 | 7.51e-05 | 5.85e-04 | 118 |
| GO:000150331 | Oral cavity | NEOLP | ossification | 81/2005 | 408/18723 | 2.67e-08 | 1.15e-06 | 81 |
| GO:000164931 | Oral cavity | NEOLP | osteoblast differentiation | 47/2005 | 229/18723 | 8.59e-06 | 1.66e-04 | 47 |
| GO:00016499 | Prostate | BPH | osteoblast differentiation | 75/3107 | 229/18723 | 1.29e-09 | 5.57e-08 | 75 |
| GO:00015039 | Prostate | BPH | ossification | 107/3107 | 408/18723 | 4.31e-07 | 8.83e-06 | 107 |
| GO:000164915 | Prostate | Tumor | osteoblast differentiation | 77/3246 | 229/18723 | 1.55e-09 | 7.26e-08 | 77 |
| GO:000150314 | Prostate | Tumor | ossification | 109/3246 | 408/18723 | 1.13e-06 | 2.14e-05 | 109 |
| GO:000164919 | Skin | AK | osteoblast differentiation | 52/1910 | 229/18723 | 2.27e-08 | 1.28e-06 | 52 |
| GO:000150318 | Skin | AK | ossification | 78/1910 | 408/18723 | 3.26e-08 | 1.76e-06 | 78 |
| GO:0001649110 | Skin | SCCIS | osteoblast differentiation | 34/919 | 229/18723 | 7.78e-09 | 2.95e-06 | 34 |
| GO:000150319 | Skin | SCCIS | ossification | 47/919 | 408/18723 | 5.02e-08 | 8.19e-06 | 47 |
| GO:000164923 | Skin | cSCC | osteoblast differentiation | 89/4864 | 229/18723 | 1.18e-05 | 1.51e-04 | 89 |
| GO:000150323 | Skin | cSCC | ossification | 137/4864 | 408/18723 | 3.39e-04 | 2.68e-03 | 137 |
| Page: 1 2 |
| Pathway ID | Tissue | Disease Stage | Description | Gene Ratio | Bg Ratio | pvalue | p.adjust | qvalue | Count |
| Page: 1 |
Top |
Cell-cell communication analysis |
| Identification of potential cell-cell interactions between two cell types and their ligand-receptor pairs for different disease states |
| Ligand | Receptor | LRpair | Pathway | Tissue | Disease Stage |
| Page: 1 |
Top |
Single-cell gene regulatory network inference analysis |
| Find out the significant the regulons (TFs) and the target genes of each regulon across cell types for different disease states |
| TF | Cell Type | Tissue | Disease Stage | Target Gene | RSS | Regulon Activity |
| ∗The dot plots of a searched regulon are shown for all cell subpopulations in each disease state of each tissue based on the regulon specific score inferred using pySCENIC and by calculating the average expression. |
| Page: 1 |
Top |
Somatic mutation of malignant transformation related genes |
| Annotation of somatic variants for genes involved in malignant transformation |
| Hugo Symbol | Variant Class | Variant Classification | dbSNP RS | HGVSc | HGVSp | HGVSp Short | SWISSPROT | BIOTYPE | SIFT | PolyPhen | Tumor Sample Barcode | Tissue | Histology | Sex | Age | Stage | Therapy Types | Drugs | Outcome |
| VCAN | SNV | Missense_Mutation | c.3023N>G | p.Asp1008Gly | p.D1008G | P13611 | protein_coding | deleterious(0.04) | benign(0.194) | TCGA-A2-A0YG-01 | Breast | breast invasive carcinoma | Female | <65 | III/IV | Chemotherapy | cytoxan | SD | |
| VCAN | SNV | Missense_Mutation | c.9440N>C | p.Asn3147Thr | p.N3147T | P13611 | protein_coding | deleterious(0) | probably_damaging(0.995) | TCGA-A7-A0CE-01 | Breast | breast invasive carcinoma | Female | <65 | I/II | Chemotherapy | adriamycin | SD | |
| VCAN | SNV | Missense_Mutation | c.4102N>C | p.Met1368Leu | p.M1368L | P13611 | protein_coding | tolerated(0.73) | benign(0) | TCGA-A8-A07L-01 | Breast | breast invasive carcinoma | Female | <65 | III/IV | Chemotherapy | CR | ||
| VCAN | SNV | Missense_Mutation | c.5465N>T | p.Thr1822Ile | p.T1822I | P13611 | protein_coding | deleterious(0) | benign(0.34) | TCGA-A8-A09Z-01 | Breast | breast invasive carcinoma | Female | >=65 | I/II | Unknown | Unknown | SD | |
| VCAN | SNV | Missense_Mutation | rs759103599 | c.8477N>T | p.Ser2826Leu | p.S2826L | P13611 | protein_coding | deleterious(0.01) | possibly_damaging(0.796) | TCGA-AC-A23H-01 | Breast | breast invasive carcinoma | Female | >=65 | I/II | Unknown | Unknown | PD |
| VCAN | SNV | Missense_Mutation | novel | c.1362N>C | p.Glu454Asp | p.E454D | P13611 | protein_coding | tolerated(0.14) | benign(0.011) | TCGA-AN-A046-01 | Breast | breast invasive carcinoma | Female | >=65 | I/II | Unknown | Unknown | SD |
| VCAN | SNV | Missense_Mutation | novel | c.6683N>C | p.Lys2228Thr | p.K2228T | P13611 | protein_coding | tolerated(0.15) | benign(0.048) | TCGA-AN-A046-01 | Breast | breast invasive carcinoma | Female | >=65 | I/II | Unknown | Unknown | SD |
| VCAN | SNV | Missense_Mutation | rs545968358 | c.1708A>T | p.Thr570Ser | p.T570S | P13611 | protein_coding | tolerated(0.09) | benign(0.158) | TCGA-AN-A0AT-01 | Breast | breast invasive carcinoma | Female | <65 | I/II | Unknown | Unknown | SD |
| VCAN | SNV | Missense_Mutation | c.3610C>G | p.Pro1204Ala | p.P1204A | P13611 | protein_coding | tolerated(0.05) | benign(0.182) | TCGA-AR-A0TX-01 | Breast | breast invasive carcinoma | Female | <65 | I/II | Unknown | Unknown | SD | |
| VCAN | SNV | Missense_Mutation | novel | c.3478N>A | p.His1160Asn | p.H1160N | P13611 | protein_coding | tolerated(0.48) | benign(0.021) | TCGA-B6-A0IA-01 | Breast | breast invasive carcinoma | Female | <65 | I/II | Unknown | Unknown | SD |
| Page: 1 2 3 4 5 6 7 8 9 10 11 12 13 14 15 16 17 18 19 20 21 22 23 24 25 26 27 28 29 30 31 32 33 34 35 36 37 38 39 40 41 42 43 44 45 46 47 48 49 50 51 52 |
Top |
Related drugs of malignant transformation related genes |
| Identification of chemicals and drugs interact with genes involved in malignant transfromation |
| (DGIdb 4.0) |
| Entrez ID | Symbol | Category | Interaction Types | Drug Claim Name | Drug Name | PMIDs |
| 1462 | VCAN | DRUGGABLE GENOME | CSA | CYCLOSPORINE | 14974815 |
| Page: 1 |

Copyright 2023-Present -The University of Texas Health Science Center at Houston |