
|
|||||
|
 | |
| |
| |
| |
| |
| |
|
Gene: VASN |
Gene summary for VASN |
| Gene information | Species | Human | Gene symbol | VASN | Gene ID | 114990 |
| Gene name | vasorin | |
| Gene Alias | SLITL2 | |
| Cytomap | 16p13.3 | |
| Gene Type | protein-coding | GO ID | GO:0001666 | UniProtAcc | Q6EMK4 |
Top |
Malignant transformation analysis |
| Identification of the aberrant gene expression in precancerous and cancerous lesions by comparing the gene expression of stem-like cells in diseased tissues with normal stem cells |
| Entrez ID | Symbol | Replicates | Species | Organ | Tissue | Adj P-value | Log2FC | Malignancy |
| 114990 | VASN | S029 | Human | Liver | HCC | 1.35e-16 | 8.37e-01 | 0.2581 |
| 114990 | VASN | male-WTA | Human | Thyroid | PTC | 9.39e-43 | 3.56e-01 | 0.1037 |
| 114990 | VASN | PTC01 | Human | Thyroid | PTC | 1.82e-08 | 1.12e-01 | 0.1899 |
| 114990 | VASN | PTC04 | Human | Thyroid | PTC | 3.32e-10 | 2.44e-01 | 0.1927 |
| 114990 | VASN | PTC05 | Human | Thyroid | PTC | 5.81e-13 | 8.56e-01 | 0.2065 |
| 114990 | VASN | PTC06 | Human | Thyroid | PTC | 2.55e-26 | 8.95e-01 | 0.2057 |
| 114990 | VASN | PTC07 | Human | Thyroid | PTC | 2.07e-26 | 6.22e-01 | 0.2044 |
| 114990 | VASN | ATC09 | Human | Thyroid | ATC | 2.66e-10 | 2.58e-01 | 0.2871 |
| 114990 | VASN | ATC12 | Human | Thyroid | ATC | 1.41e-07 | 1.10e-01 | 0.34 |
| 114990 | VASN | ATC13 | Human | Thyroid | ATC | 2.06e-11 | -5.91e-02 | 0.34 |
| 114990 | VASN | ATC1 | Human | Thyroid | ATC | 2.85e-09 | 2.83e-01 | 0.2878 |
| 114990 | VASN | ATC4 | Human | Thyroid | ATC | 1.87e-08 | 1.78e-01 | 0.34 |
| 114990 | VASN | ATC5 | Human | Thyroid | ATC | 1.23e-10 | -4.76e-02 | 0.34 |
| Page: 1 2 3 |
| Tissue | Expression Dynamics | Abbreviation |
| Esophagus | 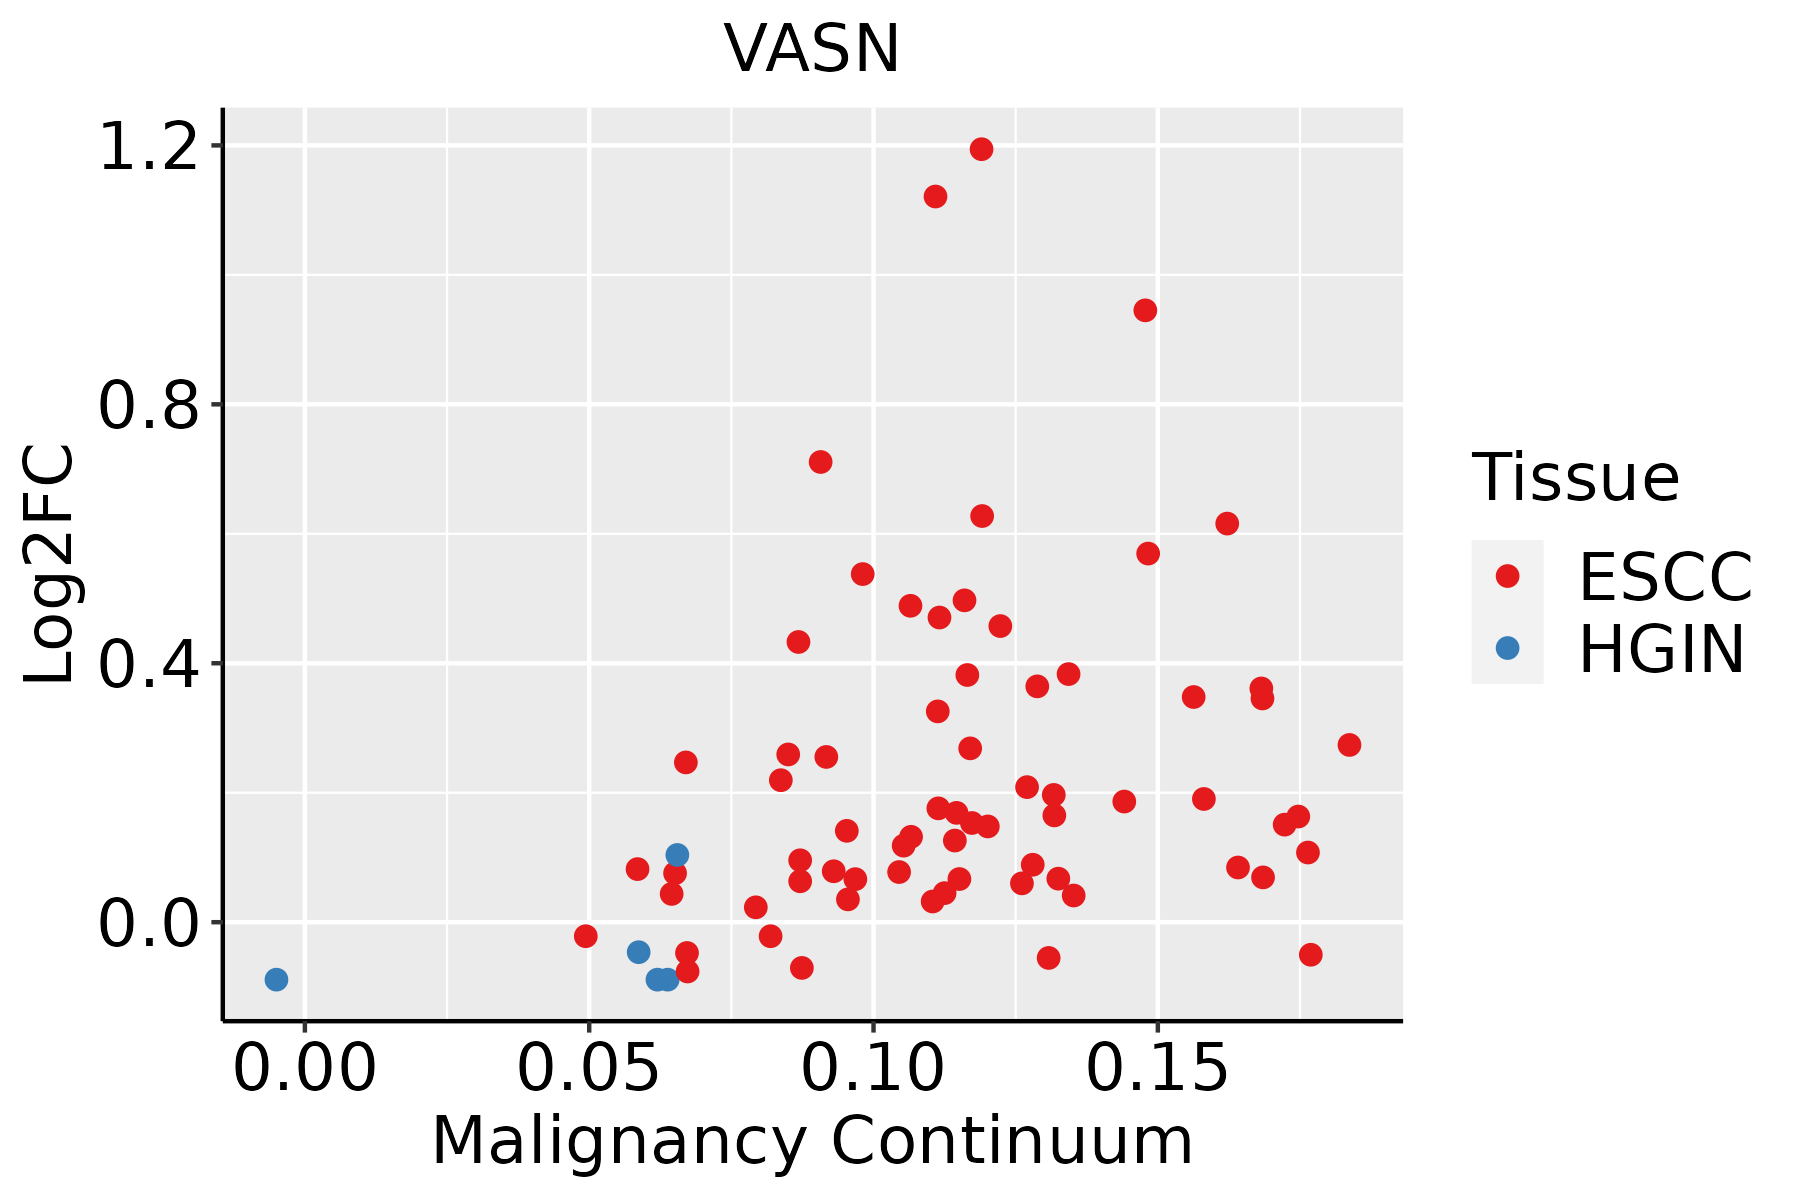 | ESCC: Esophageal squamous cell carcinoma |
| HGIN: High-grade intraepithelial neoplasias | ||
| LGIN: Low-grade intraepithelial neoplasias | ||
| Liver | 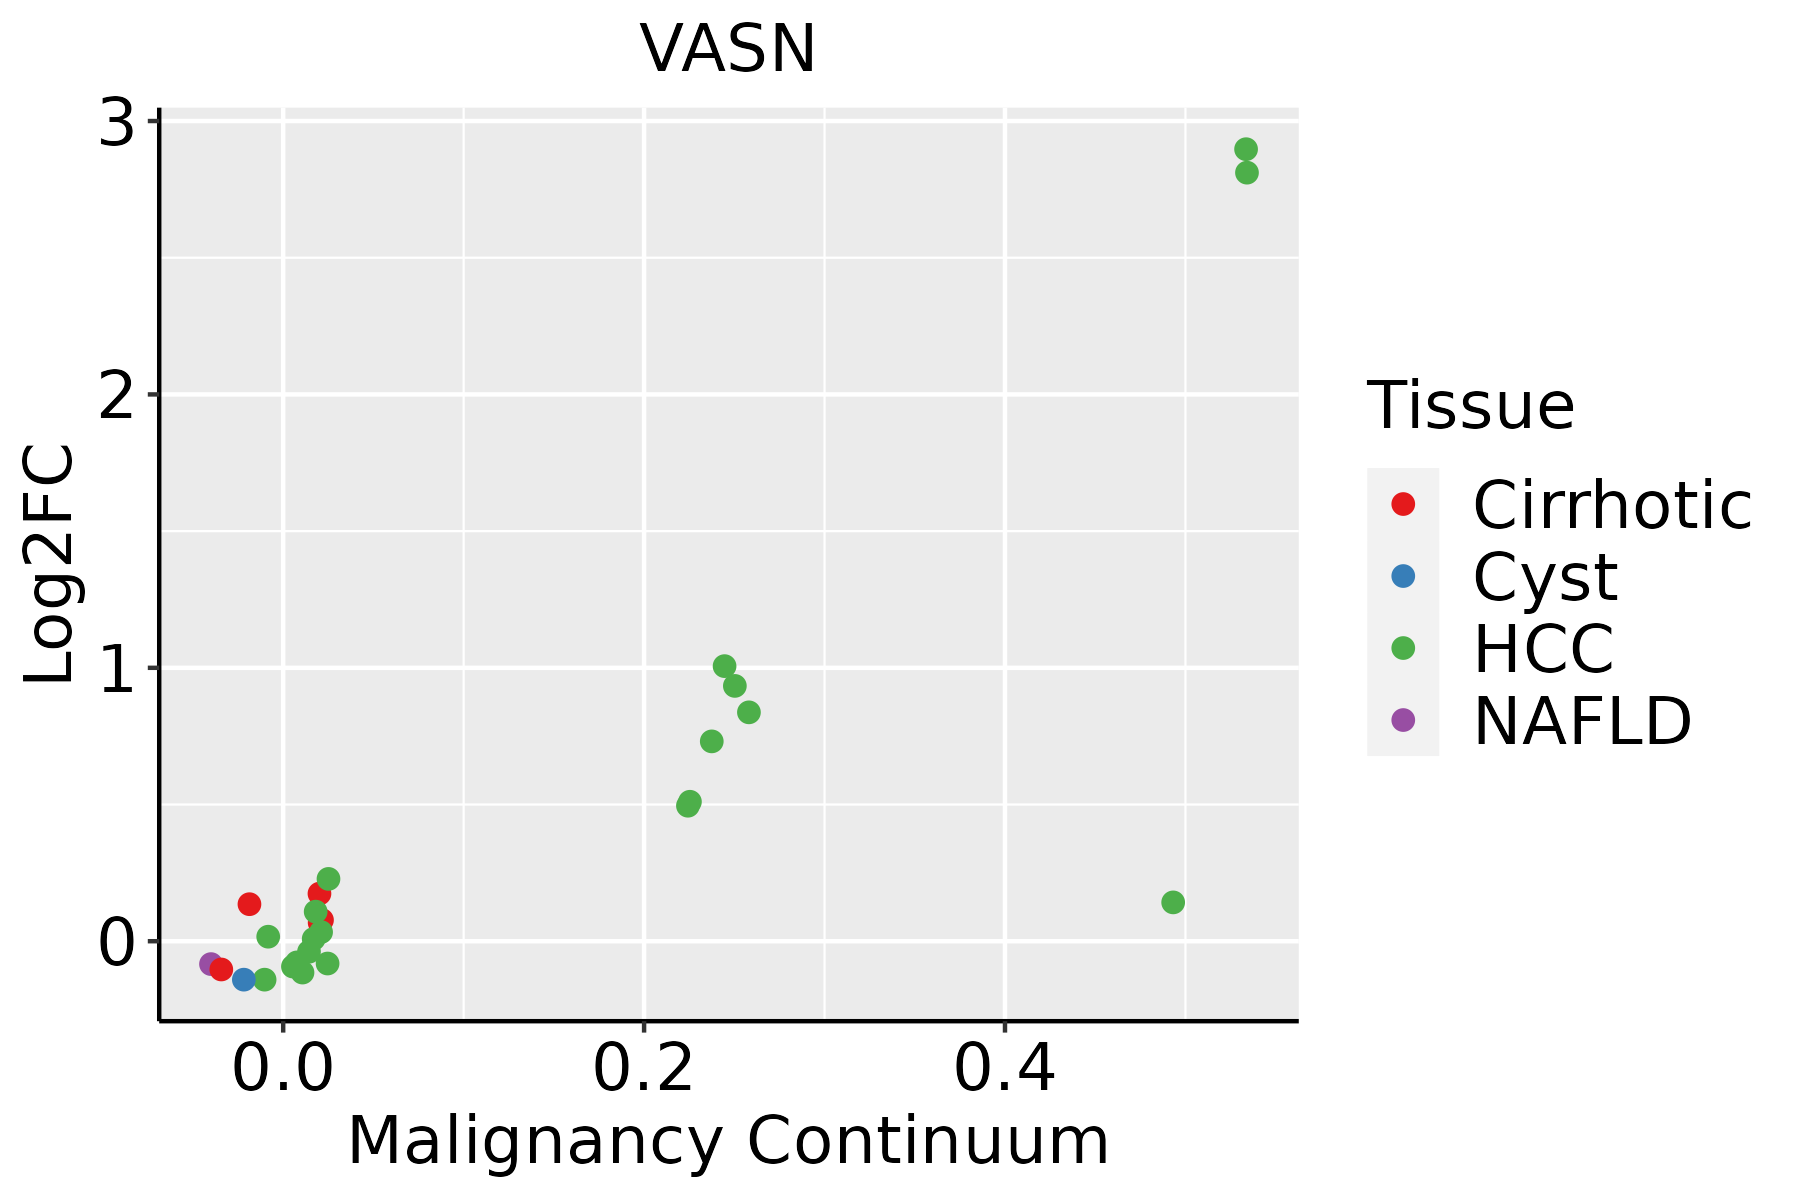 | HCC: Hepatocellular carcinoma |
| NAFLD: Non-alcoholic fatty liver disease | ||
| Thyroid | 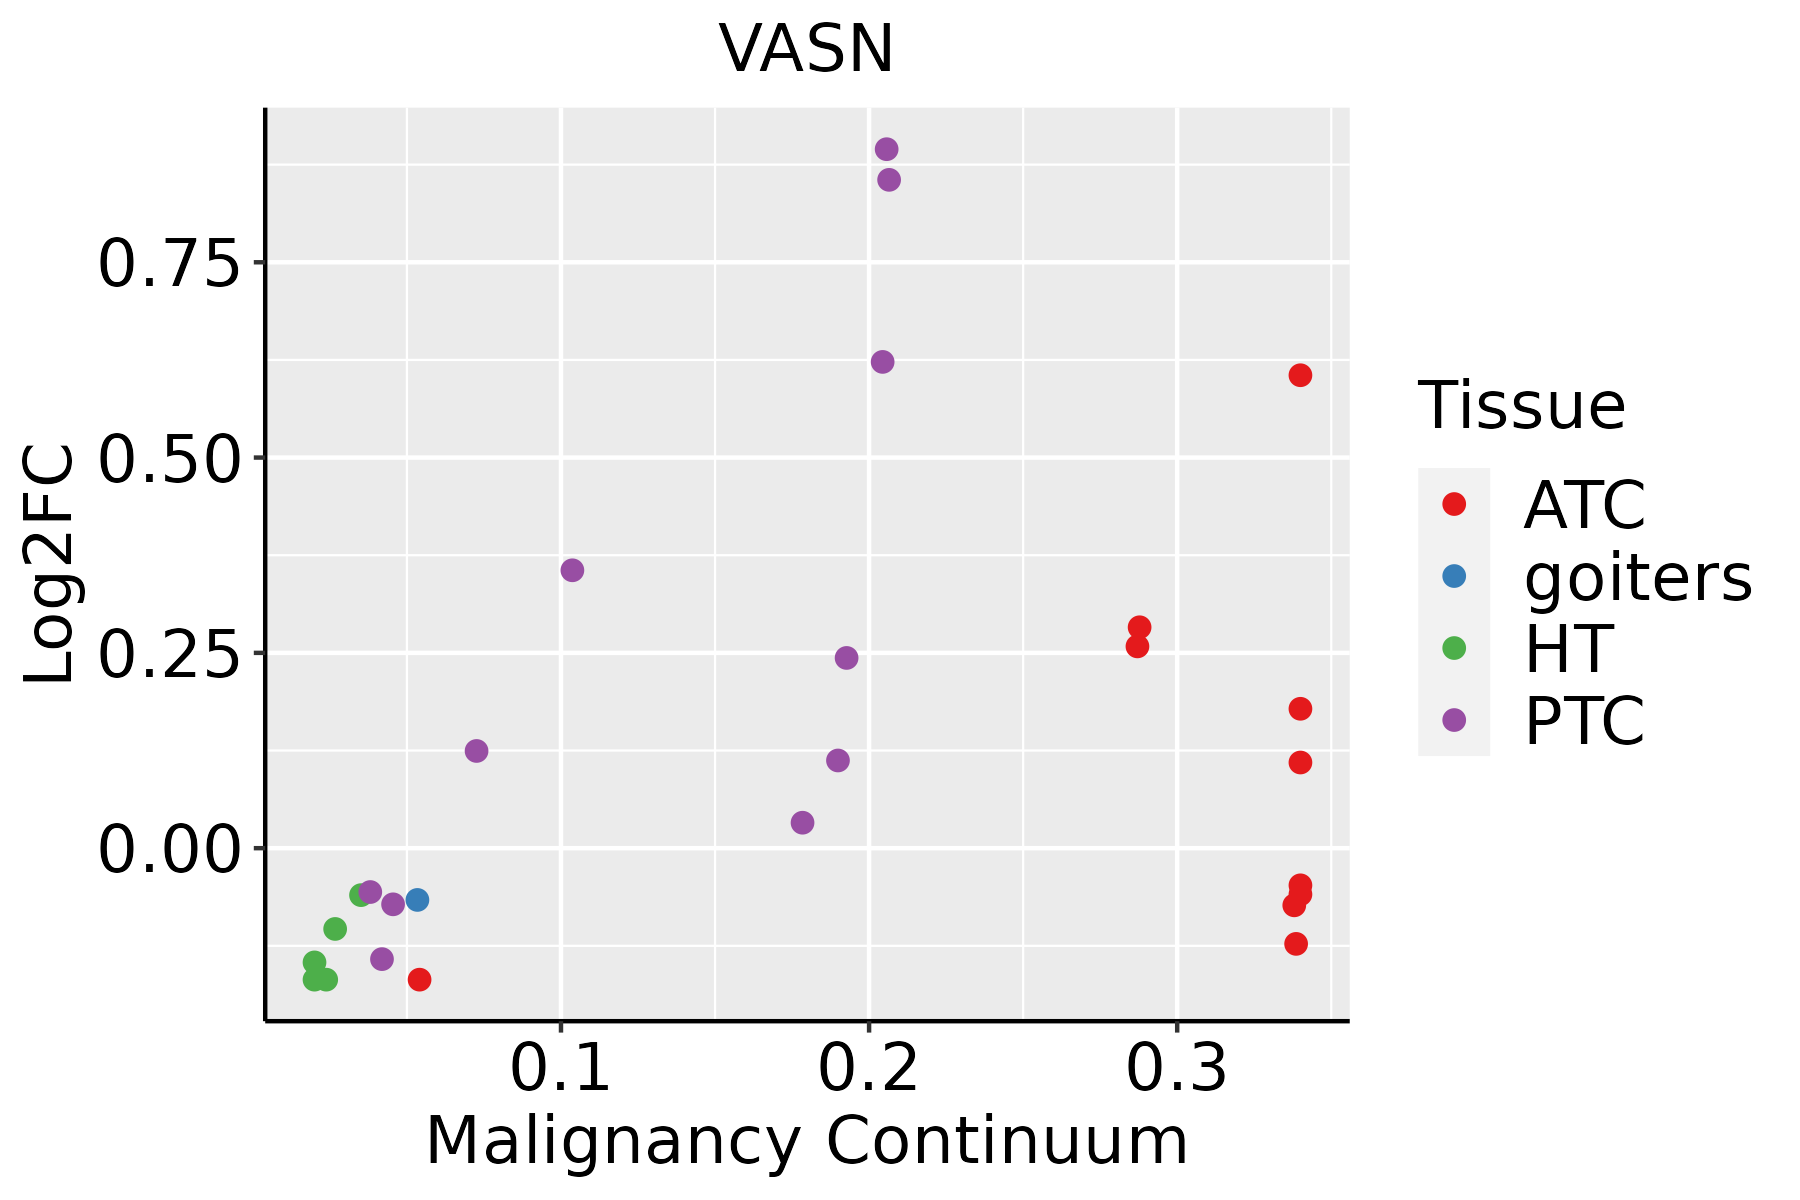 | ATC: Anaplastic thyroid cancer |
| HT: Hashimoto's thyroiditis | ||
| PTC: Papillary thyroid cancer |
| ∗log2FC in expression of this searched gene in stem-like cells from each diseased tissue sample relative to stem-like cells in normal samples in each tissue plotted against the malignancy continuum. Samples are colored based on if they are from different disease stage. |
Top |
Malignant transformation related pathway analysis |
| Find out the enriched GO biological processes and KEGG pathways involved in transition from healthy to precancer to cancer |
| Tissue | Disease Stage | Enriched GO biological Processes |
| Colorectum | AD |  |
| Colorectum | SER |  |
| Colorectum | MSS |  |
| Colorectum | MSI-H |  |
| Colorectum | FAP |  |
| ∗Top 15 enriched GO BP terms are showed in the bar plot of each disease state in each tissue. Each row represents a significant GO biological process which is colored according to the -log10(p.adjust). |
| Page: 1 2 3 4 5 6 7 8 9 |
| GO ID | Tissue | Disease Stage | Description | Gene Ratio | Bg Ratio | pvalue | p.adjust | Count |
| GO:0070482111 | Esophagus | ESCC | response to oxygen levels | 218/8552 | 347/18723 | 6.91e-11 | 2.17e-09 | 218 |
| GO:0036293111 | Esophagus | ESCC | response to decreased oxygen levels | 201/8552 | 322/18723 | 8.37e-10 | 2.04e-08 | 201 |
| GO:0001666111 | Esophagus | ESCC | response to hypoxia | 192/8552 | 307/18723 | 1.59e-09 | 3.69e-08 | 192 |
| GO:00715599 | Esophagus | ESCC | response to transforming growth factor beta | 157/8552 | 256/18723 | 2.95e-07 | 4.23e-06 | 157 |
| GO:0071453110 | Esophagus | ESCC | cellular response to oxygen levels | 114/8552 | 177/18723 | 3.63e-07 | 5.06e-06 | 114 |
| GO:0036294110 | Esophagus | ESCC | cellular response to decreased oxygen levels | 105/8552 | 161/18723 | 4.20e-07 | 5.73e-06 | 105 |
| GO:00715609 | Esophagus | ESCC | cellular response to transforming growth factor beta stimulus | 151/8552 | 250/18723 | 1.78e-06 | 2.10e-05 | 151 |
| GO:007145616 | Esophagus | ESCC | cellular response to hypoxia | 97/8552 | 151/18723 | 3.12e-06 | 3.51e-05 | 97 |
| GO:00071799 | Esophagus | ESCC | transforming growth factor beta receptor signaling pathway | 121/8552 | 198/18723 | 8.26e-06 | 8.03e-05 | 121 |
| GO:00018378 | Esophagus | ESCC | epithelial to mesenchymal transition | 95/8552 | 157/18723 | 1.25e-04 | 8.56e-04 | 95 |
| GO:000717810 | Esophagus | ESCC | transmembrane receptor protein serine/threonine kinase signaling pathway | 195/8552 | 355/18723 | 2.58e-04 | 1.58e-03 | 195 |
| GO:00487628 | Esophagus | ESCC | mesenchymal cell differentiation | 133/8552 | 236/18723 | 5.94e-04 | 3.22e-03 | 133 |
| GO:00107174 | Esophagus | ESCC | regulation of epithelial to mesenchymal transition | 61/8552 | 99/18723 | 1.01e-03 | 5.09e-03 | 61 |
| GO:00170156 | Esophagus | ESCC | regulation of transforming growth factor beta receptor signaling pathway | 75/8552 | 128/18723 | 2.19e-03 | 9.71e-03 | 75 |
| GO:19038447 | Esophagus | ESCC | regulation of cellular response to transforming growth factor beta stimulus | 76/8552 | 131/18723 | 2.96e-03 | 1.24e-02 | 76 |
| GO:00604856 | Esophagus | ESCC | mesenchyme development | 156/8552 | 291/18723 | 3.76e-03 | 1.53e-02 | 156 |
| GO:00704827 | Liver | Cirrhotic | response to oxygen levels | 125/4634 | 347/18723 | 1.55e-06 | 3.02e-05 | 125 |
| GO:007155911 | Liver | Cirrhotic | response to transforming growth factor beta | 96/4634 | 256/18723 | 3.55e-06 | 6.09e-05 | 96 |
| GO:007156011 | Liver | Cirrhotic | cellular response to transforming growth factor beta stimulus | 93/4634 | 250/18723 | 7.34e-06 | 1.13e-04 | 93 |
| GO:00362937 | Liver | Cirrhotic | response to decreased oxygen levels | 113/4634 | 322/18723 | 1.87e-05 | 2.52e-04 | 113 |
| Page: 1 2 3 4 5 |
| Pathway ID | Tissue | Disease Stage | Description | Gene Ratio | Bg Ratio | pvalue | p.adjust | qvalue | Count |
| Page: 1 |
Top |
Cell-cell communication analysis |
| Identification of potential cell-cell interactions between two cell types and their ligand-receptor pairs for different disease states |
| Ligand | Receptor | LRpair | Pathway | Tissue | Disease Stage |
| Page: 1 |
Top |
Single-cell gene regulatory network inference analysis |
| Find out the significant the regulons (TFs) and the target genes of each regulon across cell types for different disease states |
| TF | Cell Type | Tissue | Disease Stage | Target Gene | RSS | Regulon Activity |
| ∗The dot plots of a searched regulon are shown for all cell subpopulations in each disease state of each tissue based on the regulon specific score inferred using pySCENIC and by calculating the average expression. |
| Page: 1 |
Top |
Somatic mutation of malignant transformation related genes |
| Annotation of somatic variants for genes involved in malignant transformation |
| Hugo Symbol | Variant Class | Variant Classification | dbSNP RS | HGVSc | HGVSp | HGVSp Short | SWISSPROT | BIOTYPE | SIFT | PolyPhen | Tumor Sample Barcode | Tissue | Histology | Sex | Age | Stage | Therapy Types | Drugs | Outcome |
| VASN | SNV | Missense_Mutation | novel | c.350N>G | p.Asn117Ser | p.N117S | Q6EMK4 | protein_coding | tolerated(0.08) | possibly_damaging(0.621) | TCGA-GM-A3NY-01 | Breast | breast invasive carcinoma | Female | >=65 | I/II | Hormone Therapy | arimidex | SD |
| VASN | SNV | Missense_Mutation | novel | c.1816G>A | p.Ala606Thr | p.A606T | Q6EMK4 | protein_coding | tolerated(0.18) | benign(0.003) | TCGA-2W-A8YY-01 | Cervix | cervical & endocervical cancer | Female | <65 | I/II | Chemotherapy | cisplatin | CR |
| VASN | SNV | Missense_Mutation | novel | c.1817N>T | p.Ala606Val | p.A606V | Q6EMK4 | protein_coding | deleterious(0.04) | benign(0.115) | TCGA-AA-A022-01 | Colorectum | colon adenocarcinoma | Female | >=65 | I/II | Unknown | Unknown | SD |
| VASN | SNV | Missense_Mutation | rs755829190 | c.952N>A | p.Val318Ile | p.V318I | Q6EMK4 | protein_coding | tolerated(0.31) | benign(0.007) | TCGA-AD-6964-01 | Colorectum | colon adenocarcinoma | Male | <65 | III/IV | Chemotherapy | folfox | PD |
| VASN | SNV | Missense_Mutation | c.80G>A | p.Gly27Asp | p.G27D | Q6EMK4 | protein_coding | tolerated(0.43) | benign(0.076) | TCGA-CK-4951-01 | Colorectum | colon adenocarcinoma | Female | >=65 | I/II | Unknown | Unknown | PD | |
| VASN | SNV | Missense_Mutation | c.1591T>A | p.Tyr531Asn | p.Y531N | Q6EMK4 | protein_coding | deleterious(0) | probably_damaging(0.998) | TCGA-CK-4951-01 | Colorectum | colon adenocarcinoma | Female | >=65 | I/II | Unknown | Unknown | PD | |
| VASN | SNV | Missense_Mutation | rs199795973 | c.409C>T | p.Arg137Cys | p.R137C | Q6EMK4 | protein_coding | deleterious(0.04) | benign(0.013) | TCGA-CK-6746-01 | Colorectum | colon adenocarcinoma | Female | >=65 | I/II | Unknown | Unknown | SD |
| VASN | SNV | Missense_Mutation | rs113954688 | c.647N>A | p.Arg216His | p.R216H | Q6EMK4 | protein_coding | tolerated(0.19) | benign(0.005) | TCGA-CM-6674-01 | Colorectum | colon adenocarcinoma | Male | <65 | I/II | Unknown | Unknown | SD |
| VASN | SNV | Missense_Mutation | c.1187N>A | p.Ala396Asp | p.A396D | Q6EMK4 | protein_coding | tolerated(0.17) | benign(0.235) | TCGA-DC-4749-01 | Colorectum | rectum adenocarcinoma | Male | <65 | I/II | Unknown | Unknown | SD | |
| VASN | insertion | Frame_Shift_Ins | novel | c.340_341insA | p.Ile115AsnfsTer4 | p.I115Nfs*4 | Q6EMK4 | protein_coding | TCGA-AZ-6606-01 | Colorectum | colon adenocarcinoma | Male | >=65 | III/IV | Chemotherapy | folfiri | PD |
| Page: 1 2 3 4 |
Top |
Related drugs of malignant transformation related genes |
| Identification of chemicals and drugs interact with genes involved in malignant transfromation |
| (DGIdb 4.0) |
| Entrez ID | Symbol | Category | Interaction Types | Drug Claim Name | Drug Name | PMIDs |
| Page: 1 |

Copyright 2023-Present -The University of Texas Health Science Center at Houston |