
|
|||||
|
 | |
| |
| |
| |
| |
| |
|
Gene: UTP20 |
Gene summary for UTP20 |
| Gene information | Species | Human | Gene symbol | UTP20 | Gene ID | 27340 |
| Gene name | UTP20 small subunit processome component | |
| Gene Alias | 1A6/DRIM | |
| Cytomap | 12q23.2 | |
| Gene Type | protein-coding | GO ID | GO:0000447 | UniProtAcc | O75691 |
Top |
Malignant transformation analysis |
| Identification of the aberrant gene expression in precancerous and cancerous lesions by comparing the gene expression of stem-like cells in diseased tissues with normal stem cells |
| Entrez ID | Symbol | Replicates | Species | Organ | Tissue | Adj P-value | Log2FC | Malignancy |
| 27340 | UTP20 | P74T-E | Human | Esophagus | ESCC | 3.94e-12 | 3.47e-01 | 0.1479 |
| 27340 | UTP20 | P75T-E | Human | Esophagus | ESCC | 9.21e-13 | 2.89e-01 | 0.1125 |
| 27340 | UTP20 | P76T-E | Human | Esophagus | ESCC | 3.33e-17 | 3.14e-01 | 0.1207 |
| 27340 | UTP20 | P79T-E | Human | Esophagus | ESCC | 2.37e-16 | 2.77e-01 | 0.1154 |
| 27340 | UTP20 | P80T-E | Human | Esophagus | ESCC | 5.25e-16 | 4.36e-01 | 0.155 |
| 27340 | UTP20 | P82T-E | Human | Esophagus | ESCC | 4.25e-02 | 1.80e-01 | 0.1072 |
| 27340 | UTP20 | P83T-E | Human | Esophagus | ESCC | 1.33e-14 | 4.45e-01 | 0.1738 |
| 27340 | UTP20 | P91T-E | Human | Esophagus | ESCC | 2.38e-05 | 5.39e-01 | 0.1828 |
| 27340 | UTP20 | P107T-E | Human | Esophagus | ESCC | 1.43e-25 | 5.30e-01 | 0.171 |
| 27340 | UTP20 | P126T-E | Human | Esophagus | ESCC | 2.37e-04 | 3.79e-01 | 0.1125 |
| 27340 | UTP20 | P127T-E | Human | Esophagus | ESCC | 1.18e-09 | 1.32e-01 | 0.0826 |
| 27340 | UTP20 | P128T-E | Human | Esophagus | ESCC | 4.09e-16 | 5.65e-01 | 0.1241 |
| 27340 | UTP20 | P130T-E | Human | Esophagus | ESCC | 1.39e-25 | 5.41e-01 | 0.1676 |
| 27340 | UTP20 | HCC1_Meng | Human | Liver | HCC | 4.16e-49 | 7.13e-02 | 0.0246 |
| 27340 | UTP20 | HCC2_Meng | Human | Liver | HCC | 5.08e-08 | 3.55e-02 | 0.0107 |
| 27340 | UTP20 | HCC2 | Human | Liver | HCC | 7.00e-12 | 4.15e+00 | 0.5341 |
| 27340 | UTP20 | S014 | Human | Liver | HCC | 2.83e-04 | 2.94e-01 | 0.2254 |
| 27340 | UTP20 | S015 | Human | Liver | HCC | 1.41e-05 | 4.22e-01 | 0.2375 |
| 27340 | UTP20 | S016 | Human | Liver | HCC | 6.22e-08 | 3.81e-01 | 0.2243 |
| 27340 | UTP20 | S027 | Human | Liver | HCC | 2.41e-03 | 4.94e-01 | 0.2446 |
| Page: 1 2 3 4 |
| Tissue | Expression Dynamics | Abbreviation |
| Esophagus | 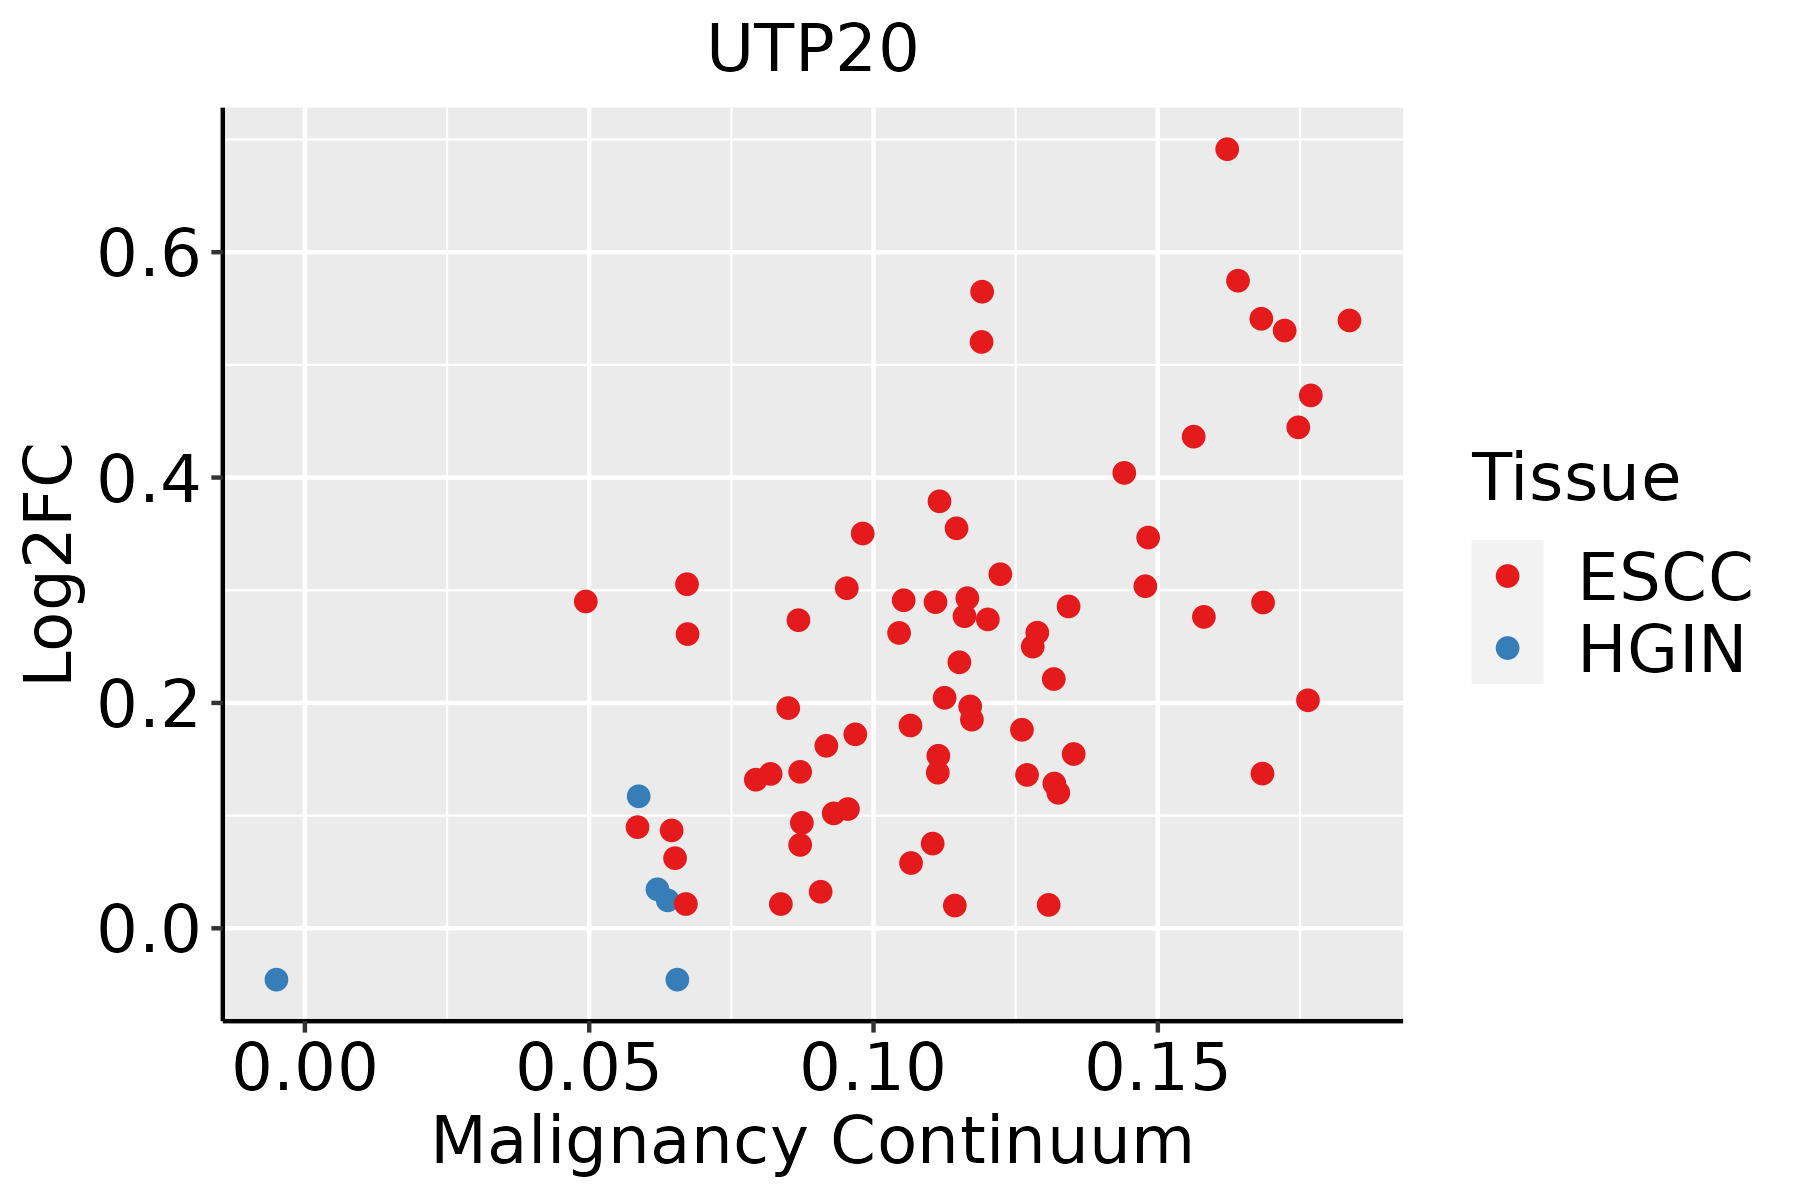 | ESCC: Esophageal squamous cell carcinoma |
| HGIN: High-grade intraepithelial neoplasias | ||
| LGIN: Low-grade intraepithelial neoplasias | ||
| Liver |  | HCC: Hepatocellular carcinoma |
| NAFLD: Non-alcoholic fatty liver disease | ||
| Thyroid |  | ATC: Anaplastic thyroid cancer |
| HT: Hashimoto's thyroiditis | ||
| PTC: Papillary thyroid cancer |
| ∗log2FC in expression of this searched gene in stem-like cells from each diseased tissue sample relative to stem-like cells in normal samples in each tissue plotted against the malignancy continuum. Samples are colored based on if they are from different disease stage. |
Top |
Malignant transformation related pathway analysis |
| Find out the enriched GO biological processes and KEGG pathways involved in transition from healthy to precancer to cancer |
| Tissue | Disease Stage | Enriched GO biological Processes |
| Colorectum | AD |  |
| Colorectum | SER |  |
| Colorectum | MSS |  |
| Colorectum | MSI-H |  |
| Colorectum | FAP |  |
| ∗Top 15 enriched GO BP terms are showed in the bar plot of each disease state in each tissue. Each row represents a significant GO biological process which is colored according to the -log10(p.adjust). |
| Page: 1 2 3 4 5 6 7 8 9 |
| GO ID | Tissue | Disease Stage | Description | Gene Ratio | Bg Ratio | pvalue | p.adjust | Count |
| GO:0022613111 | Esophagus | ESCC | ribonucleoprotein complex biogenesis | 365/8552 | 463/18723 | 1.74e-49 | 1.11e-45 | 365 |
| GO:0042254111 | Esophagus | ESCC | ribosome biogenesis | 252/8552 | 299/18723 | 3.27e-44 | 1.04e-40 | 252 |
| GO:003447015 | Esophagus | ESCC | ncRNA processing | 300/8552 | 395/18723 | 3.09e-35 | 3.26e-32 | 300 |
| GO:0016072110 | Esophagus | ESCC | rRNA metabolic process | 197/8552 | 236/18723 | 1.31e-33 | 1.18e-30 | 197 |
| GO:0006364110 | Esophagus | ESCC | rRNA processing | 189/8552 | 225/18723 | 4.88e-33 | 3.87e-30 | 189 |
| GO:003466012 | Esophagus | ESCC | ncRNA metabolic process | 346/8552 | 485/18723 | 4.35e-31 | 2.51e-28 | 346 |
| GO:0042274111 | Esophagus | ESCC | ribosomal small subunit biogenesis | 67/8552 | 73/18723 | 6.62e-17 | 5.38e-15 | 67 |
| GO:00905013 | Esophagus | ESCC | RNA phosphodiester bond hydrolysis | 110/8552 | 152/18723 | 1.95e-11 | 6.81e-10 | 110 |
| GO:00304904 | Esophagus | ESCC | maturation of SSU-rRNA | 45/8552 | 50/18723 | 5.07e-11 | 1.63e-09 | 45 |
| GO:00903053 | Esophagus | ESCC | nucleic acid phosphodiester bond hydrolysis | 163/8552 | 261/18723 | 3.07e-08 | 5.73e-07 | 163 |
| GO:00004623 | Esophagus | ESCC | maturation of SSU-rRNA from tricistronic rRNA transcript (SSU-rRNA, 5.8S rRNA, LSU-rRNA) | 32/8552 | 37/18723 | 2.96e-07 | 4.23e-06 | 32 |
| GO:00004603 | Esophagus | ESCC | maturation of 5.8S rRNA | 30/8552 | 35/18723 | 1.07e-06 | 1.34e-05 | 30 |
| GO:00004693 | Esophagus | ESCC | cleavage involved in rRNA processing | 24/8552 | 27/18723 | 3.48e-06 | 3.84e-05 | 24 |
| GO:00004663 | Esophagus | ESCC | maturation of 5.8S rRNA from tricistronic rRNA transcript (SSU-rRNA, 5.8S rRNA, LSU-rRNA) | 21/8552 | 24/18723 | 2.57e-05 | 2.17e-04 | 21 |
| GO:00905023 | Esophagus | ESCC | RNA phosphodiester bond hydrolysis, endonucleolytic | 55/8552 | 82/18723 | 7.34e-05 | 5.51e-04 | 55 |
| GO:00004783 | Esophagus | ESCC | endonucleolytic cleavage involved in rRNA processing | 14/8552 | 15/18723 | 1.47e-04 | 9.85e-04 | 14 |
| GO:00004793 | Esophagus | ESCC | endonucleolytic cleavage of tricistronic rRNA transcript (SSU-rRNA, 5.8S rRNA, LSU-rRNA) | 14/8552 | 15/18723 | 1.47e-04 | 9.85e-04 | 14 |
| GO:00344713 | Esophagus | ESCC | ncRNA 5'-end processing | 18/8552 | 21/18723 | 1.81e-04 | 1.16e-03 | 18 |
| GO:00009663 | Esophagus | ESCC | RNA 5'-end processing | 19/8552 | 23/18723 | 3.12e-04 | 1.85e-03 | 19 |
| GO:002261322 | Liver | HCC | ribonucleoprotein complex biogenesis | 355/7958 | 463/18723 | 7.76e-52 | 4.92e-48 | 355 |
| Page: 1 2 3 4 |
| Pathway ID | Tissue | Disease Stage | Description | Gene Ratio | Bg Ratio | pvalue | p.adjust | qvalue | Count |
| Page: 1 |
Top |
Cell-cell communication analysis |
| Identification of potential cell-cell interactions between two cell types and their ligand-receptor pairs for different disease states |
| Ligand | Receptor | LRpair | Pathway | Tissue | Disease Stage |
| Page: 1 |
Top |
Single-cell gene regulatory network inference analysis |
| Find out the significant the regulons (TFs) and the target genes of each regulon across cell types for different disease states |
| TF | Cell Type | Tissue | Disease Stage | Target Gene | RSS | Regulon Activity |
| ∗The dot plots of a searched regulon are shown for all cell subpopulations in each disease state of each tissue based on the regulon specific score inferred using pySCENIC and by calculating the average expression. |
| Page: 1 |
Top |
Somatic mutation of malignant transformation related genes |
| Annotation of somatic variants for genes involved in malignant transformation |
| Hugo Symbol | Variant Class | Variant Classification | dbSNP RS | HGVSc | HGVSp | HGVSp Short | SWISSPROT | BIOTYPE | SIFT | PolyPhen | Tumor Sample Barcode | Tissue | Histology | Sex | Age | Stage | Therapy Types | Drugs | Outcome |
| UTP20 | SNV | Missense_Mutation | novel | c.5159N>C | p.Arg1720Pro | p.R1720P | O75691 | protein_coding | tolerated(0.33) | benign(0) | TCGA-A2-A3XT-01 | Breast | breast invasive carcinoma | Female | <65 | I/II | Chemotherapy | cyclophosphamide | PR |
| UTP20 | SNV | Missense_Mutation | rs778767258 | c.5596C>T | p.Arg1866Cys | p.R1866C | O75691 | protein_coding | deleterious(0) | possibly_damaging(0.793) | TCGA-A8-A081-01 | Breast | breast invasive carcinoma | Female | >=65 | I/II | Unknown | Unknown | SD |
| UTP20 | SNV | Missense_Mutation | c.3095N>G | p.Ser1032Cys | p.S1032C | O75691 | protein_coding | deleterious(0.03) | probably_damaging(0.99) | TCGA-AC-A23H-01 | Breast | breast invasive carcinoma | Female | >=65 | I/II | Unknown | Unknown | PD | |
| UTP20 | SNV | Missense_Mutation | novel | c.6103N>A | p.Pro2035Thr | p.P2035T | O75691 | protein_coding | tolerated(0.06) | possibly_damaging(0.786) | TCGA-AN-A046-01 | Breast | breast invasive carcinoma | Female | >=65 | I/II | Unknown | Unknown | SD |
| UTP20 | SNV | Missense_Mutation | novel | c.3103G>T | p.Gly1035Cys | p.G1035C | O75691 | protein_coding | deleterious(0.02) | probably_damaging(0.968) | TCGA-AN-A0AK-01 | Breast | breast invasive carcinoma | Female | >=65 | I/II | Unknown | Unknown | SD |
| UTP20 | SNV | Missense_Mutation | c.29N>A | p.Thr10Asn | p.T10N | O75691 | protein_coding | deleterious(0.03) | benign(0.084) | TCGA-AO-A03T-01 | Breast | breast invasive carcinoma | Female | <65 | I/II | Chemotherapy | cyclophosphamide | SD | |
| UTP20 | SNV | Missense_Mutation | c.5194N>G | p.Ser1732Gly | p.S1732G | O75691 | protein_coding | tolerated(0.33) | benign(0.009) | TCGA-B6-A0RG-01 | Breast | breast invasive carcinoma | Female | <65 | I/II | Unknown | Unknown | SD | |
| UTP20 | SNV | Missense_Mutation | c.3392N>T | p.Ser1131Leu | p.S1131L | O75691 | protein_coding | deleterious(0) | benign(0.282) | TCGA-B6-A0RI-01 | Breast | breast invasive carcinoma | Female | <65 | III/IV | Unknown | Unknown | PD | |
| UTP20 | SNV | Missense_Mutation | rs200357157 | c.7756N>A | p.Glu2586Lys | p.E2586K | O75691 | protein_coding | tolerated(0.33) | benign(0.014) | TCGA-BH-A0HP-01 | Breast | breast invasive carcinoma | Female | >=65 | III/IV | Chemotherapy | doxorubicin | SD |
| UTP20 | SNV | Missense_Mutation | c.5905G>C | p.Gly1969Arg | p.G1969R | O75691 | protein_coding | deleterious(0) | possibly_damaging(0.838) | TCGA-BH-A18V-01 | Breast | breast invasive carcinoma | Female | <65 | I/II | Unknown | Unknown | SD |
| Page: 1 2 3 4 5 6 7 8 9 10 11 12 13 14 15 16 17 18 19 20 21 22 23 24 25 26 27 28 29 |
Top |
Related drugs of malignant transformation related genes |
| Identification of chemicals and drugs interact with genes involved in malignant transfromation |
| (DGIdb 4.0) |
| Entrez ID | Symbol | Category | Interaction Types | Drug Claim Name | Drug Name | PMIDs |
| Page: 1 |

Copyright 2023-Present -The University of Texas Health Science Center at Houston |