
|
|||||
|
 | |
| |
| |
| |
| |
| |
|
Gene: URB1 |
Gene summary for URB1 |
| Gene information | Species | Human | Gene symbol | URB1 | Gene ID | 9875 |
| Gene name | URB1 ribosome biogenesis homolog | |
| Gene Alias | C21orf108 | |
| Cytomap | 21q22.11 | |
| Gene Type | protein-coding | GO ID | GO:0000460 | UniProtAcc | O60287 |
Top |
Malignant transformation analysis |
| Identification of the aberrant gene expression in precancerous and cancerous lesions by comparing the gene expression of stem-like cells in diseased tissues with normal stem cells |
| Entrez ID | Symbol | Replicates | Species | Organ | Tissue | Adj P-value | Log2FC | Malignancy |
| 9875 | URB1 | P75T-E | Human | Esophagus | ESCC | 1.61e-22 | 2.26e-01 | 0.1125 |
| 9875 | URB1 | P76T-E | Human | Esophagus | ESCC | 2.15e-04 | 5.18e-02 | 0.1207 |
| 9875 | URB1 | P79T-E | Human | Esophagus | ESCC | 6.63e-16 | 1.73e-01 | 0.1154 |
| 9875 | URB1 | P80T-E | Human | Esophagus | ESCC | 1.05e-26 | 9.96e-01 | 0.155 |
| 9875 | URB1 | P82T-E | Human | Esophagus | ESCC | 5.74e-13 | 4.95e-01 | 0.1072 |
| 9875 | URB1 | P83T-E | Human | Esophagus | ESCC | 2.02e-09 | 2.63e-01 | 0.1738 |
| 9875 | URB1 | P89T-E | Human | Esophagus | ESCC | 1.32e-03 | 2.93e-01 | 0.1752 |
| 9875 | URB1 | P91T-E | Human | Esophagus | ESCC | 7.21e-06 | 5.99e-01 | 0.1828 |
| 9875 | URB1 | P107T-E | Human | Esophagus | ESCC | 1.91e-05 | 1.05e-01 | 0.171 |
| 9875 | URB1 | P127T-E | Human | Esophagus | ESCC | 4.69e-05 | 1.42e-01 | 0.0826 |
| 9875 | URB1 | P128T-E | Human | Esophagus | ESCC | 1.72e-16 | 6.71e-01 | 0.1241 |
| 9875 | URB1 | P130T-E | Human | Esophagus | ESCC | 1.48e-30 | 6.75e-01 | 0.1676 |
| 9875 | URB1 | NAFLD1 | Human | Liver | NAFLD | 2.38e-02 | 3.20e-01 | -0.04 |
| 9875 | URB1 | HCC1_Meng | Human | Liver | HCC | 1.02e-20 | 4.27e-02 | 0.0246 |
| 9875 | URB1 | HCC2_Meng | Human | Liver | HCC | 1.31e-06 | 6.45e-02 | 0.0107 |
| 9875 | URB1 | HCC1 | Human | Liver | HCC | 1.56e-02 | 2.27e+00 | 0.5336 |
| 9875 | URB1 | HCC2 | Human | Liver | HCC | 1.79e-07 | 2.73e+00 | 0.5341 |
| 9875 | URB1 | S015 | Human | Liver | HCC | 4.92e-04 | 2.14e-01 | 0.2375 |
| 9875 | URB1 | S016 | Human | Liver | HCC | 1.37e-02 | 1.73e-01 | 0.2243 |
| 9875 | URB1 | S028 | Human | Liver | HCC | 2.13e-13 | 4.92e-01 | 0.2503 |
| Page: 1 2 3 4 |
| Tissue | Expression Dynamics | Abbreviation |
| Cervix | 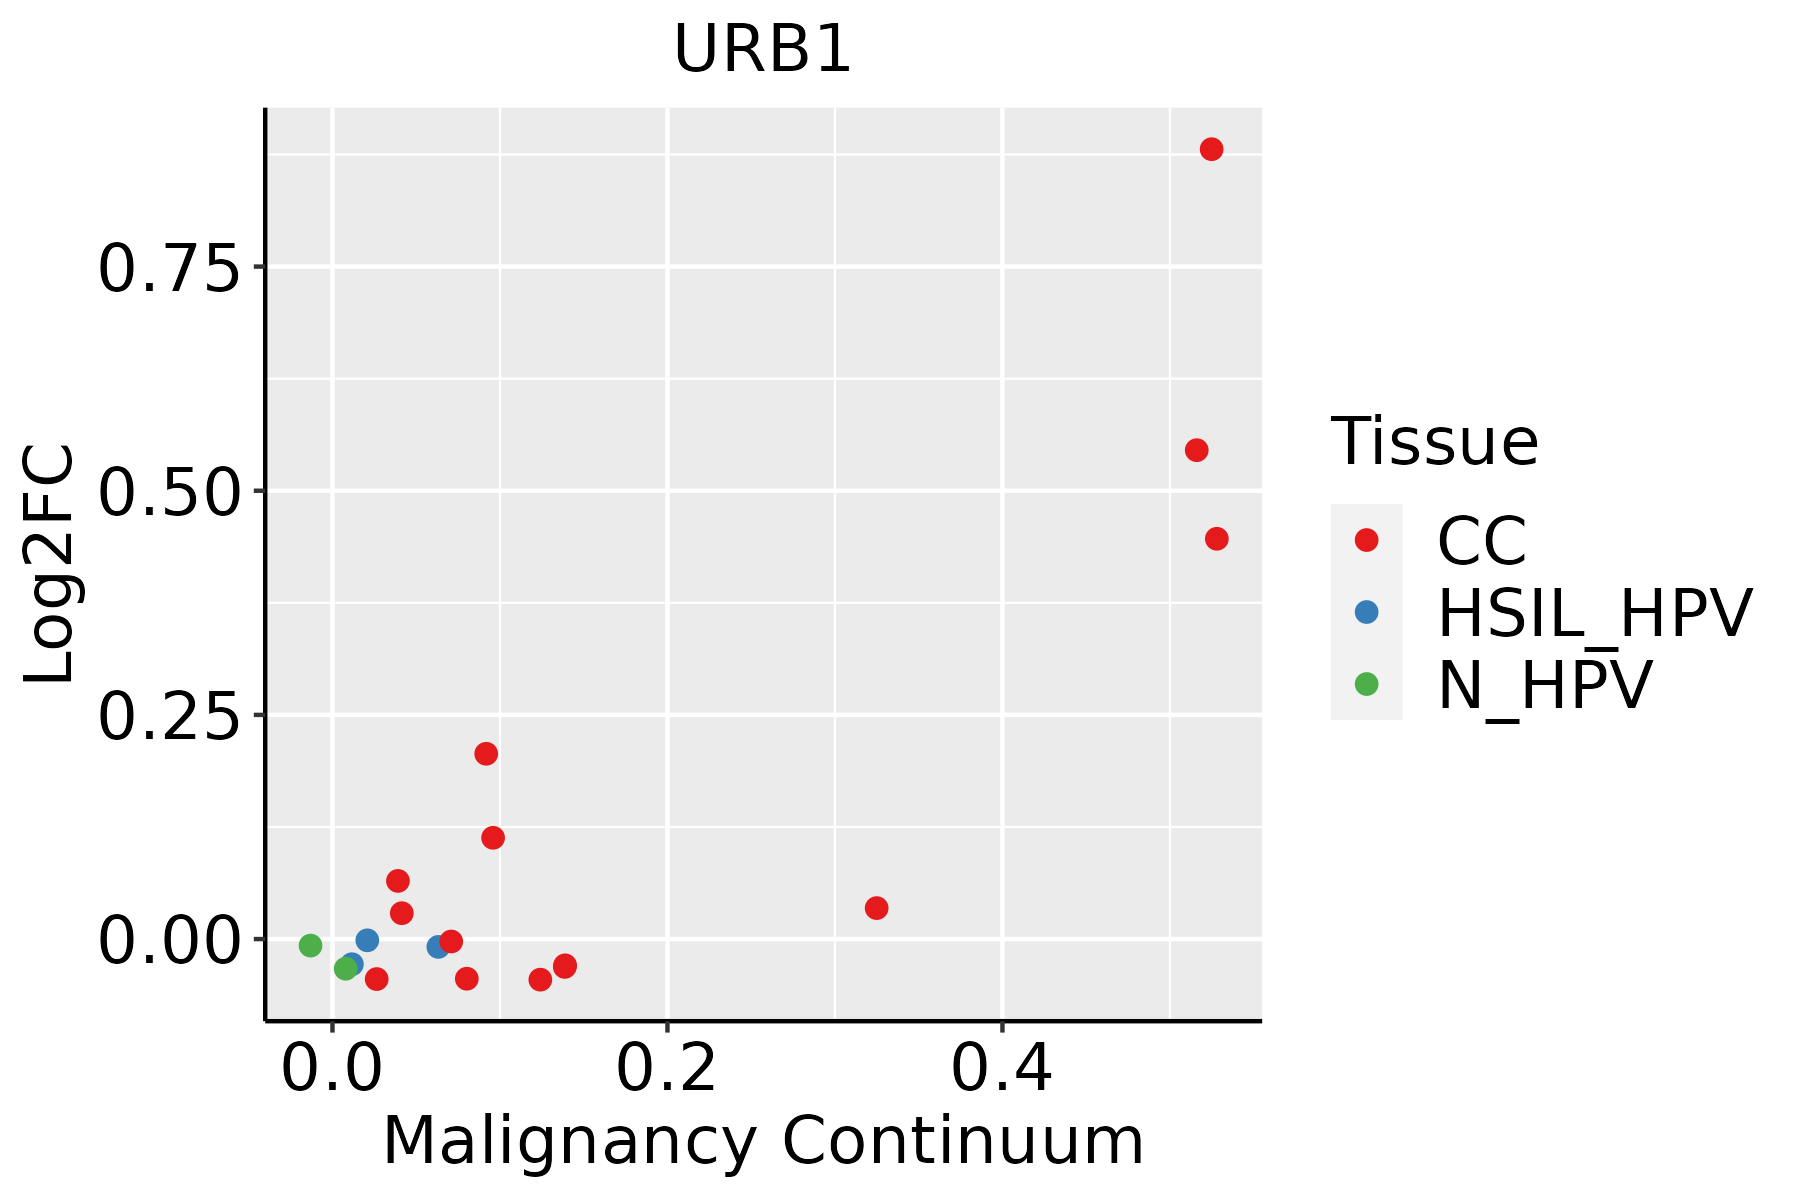 | CC: Cervix cancer |
| HSIL_HPV: HPV-infected high-grade squamous intraepithelial lesions | ||
| N_HPV: HPV-infected normal cervix | ||
| Esophagus |  | ESCC: Esophageal squamous cell carcinoma |
| HGIN: High-grade intraepithelial neoplasias | ||
| LGIN: Low-grade intraepithelial neoplasias | ||
| Liver | 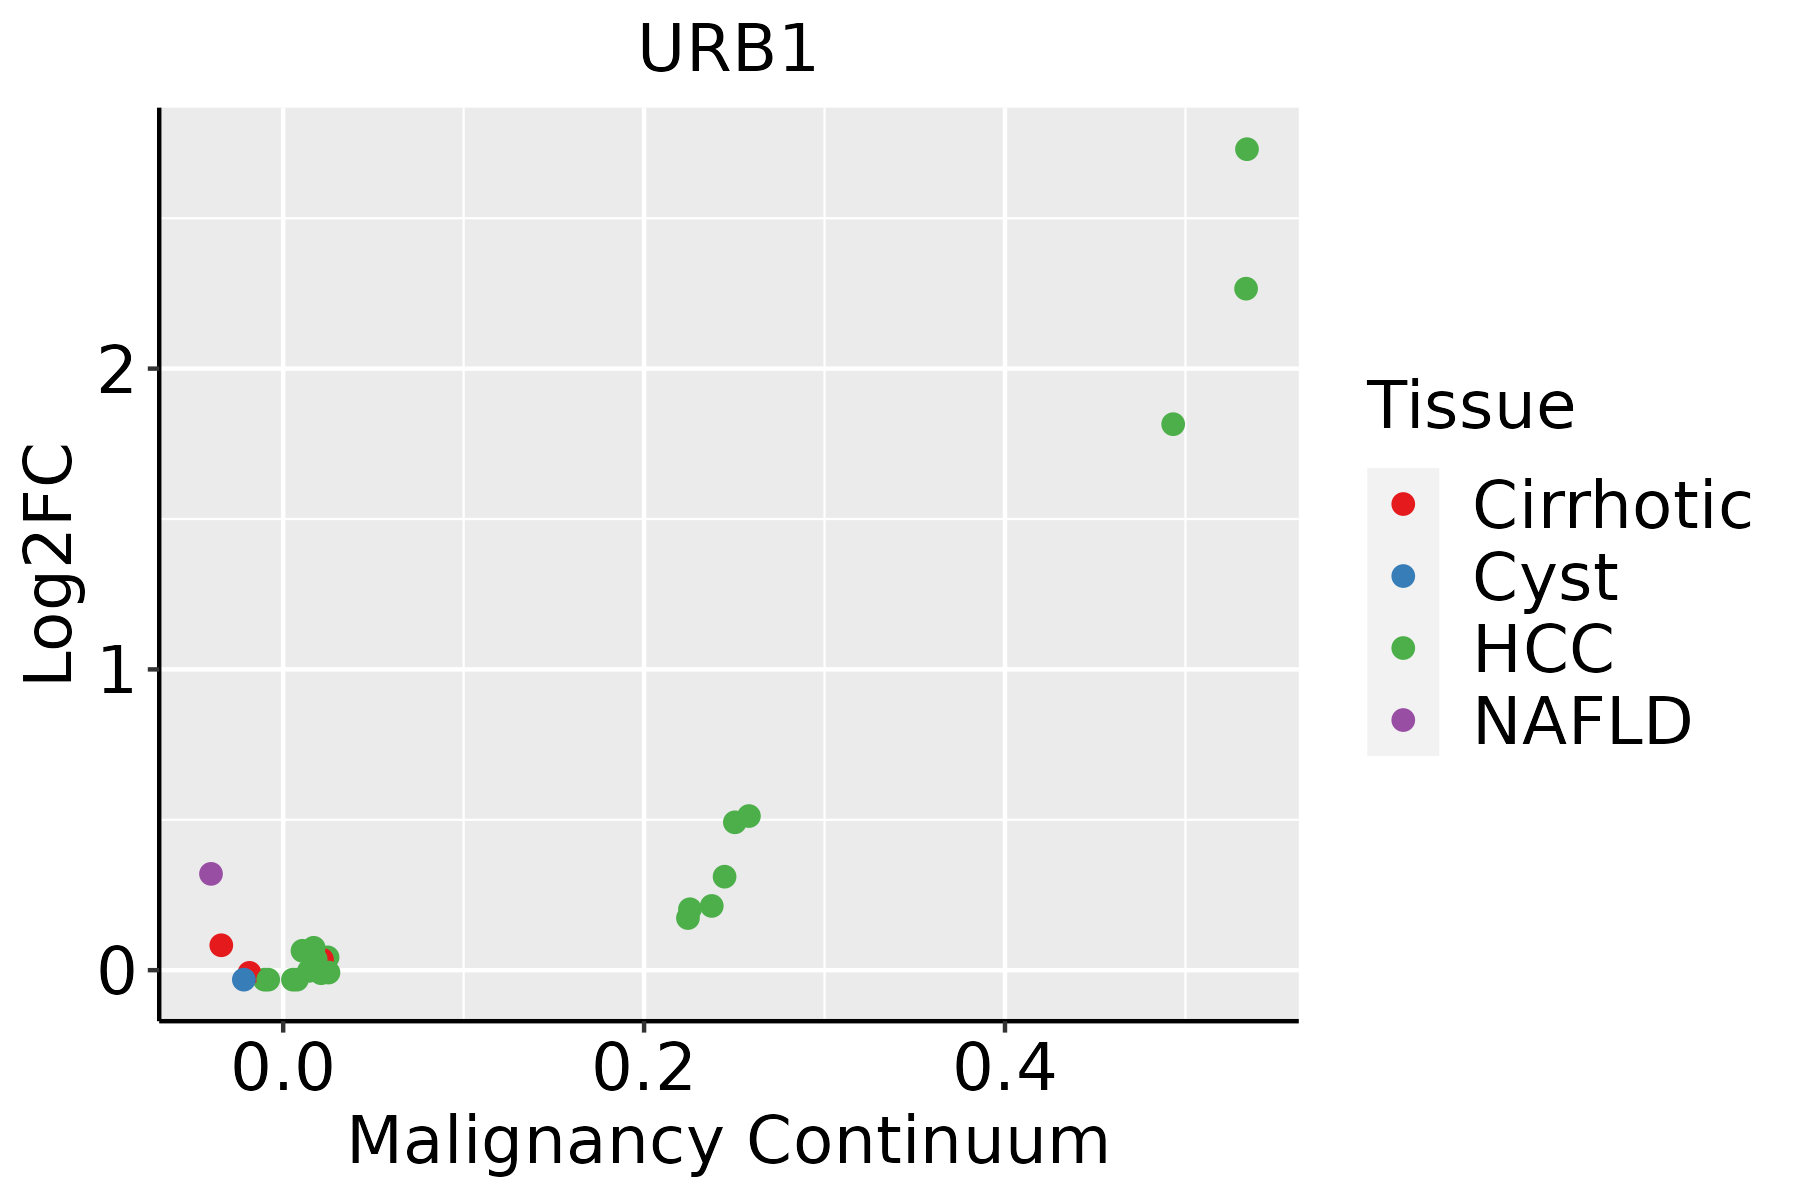 | HCC: Hepatocellular carcinoma |
| NAFLD: Non-alcoholic fatty liver disease |
| ∗log2FC in expression of this searched gene in stem-like cells from each diseased tissue sample relative to stem-like cells in normal samples in each tissue plotted against the malignancy continuum. Samples are colored based on if they are from different disease stage. |
Top |
Malignant transformation related pathway analysis |
| Find out the enriched GO biological processes and KEGG pathways involved in transition from healthy to precancer to cancer |
| Tissue | Disease Stage | Enriched GO biological Processes |
| Colorectum | AD |  |
| Colorectum | SER |  |
| Colorectum | MSS |  |
| Colorectum | MSI-H |  |
| Colorectum | FAP |  |
| ∗Top 15 enriched GO BP terms are showed in the bar plot of each disease state in each tissue. Each row represents a significant GO biological process which is colored according to the -log10(p.adjust). |
| Page: 1 2 3 4 5 6 7 8 9 |
| GO ID | Tissue | Disease Stage | Description | Gene Ratio | Bg Ratio | pvalue | p.adjust | Count |
| GO:004227310 | Cervix | CC | ribosomal large subunit biogenesis | 26/2311 | 72/18723 | 1.87e-07 | 8.48e-06 | 26 |
| GO:002261310 | Cervix | CC | ribonucleoprotein complex biogenesis | 88/2311 | 463/18723 | 2.11e-05 | 3.82e-04 | 88 |
| GO:004225410 | Cervix | CC | ribosome biogenesis | 62/2311 | 299/18723 | 2.48e-05 | 4.27e-04 | 62 |
| GO:00160727 | Cervix | CC | rRNA metabolic process | 42/2311 | 236/18723 | 9.12e-03 | 4.60e-02 | 42 |
| GO:0022613111 | Esophagus | ESCC | ribonucleoprotein complex biogenesis | 365/8552 | 463/18723 | 1.74e-49 | 1.11e-45 | 365 |
| GO:0042254111 | Esophagus | ESCC | ribosome biogenesis | 252/8552 | 299/18723 | 3.27e-44 | 1.04e-40 | 252 |
| GO:003447015 | Esophagus | ESCC | ncRNA processing | 300/8552 | 395/18723 | 3.09e-35 | 3.26e-32 | 300 |
| GO:0016072110 | Esophagus | ESCC | rRNA metabolic process | 197/8552 | 236/18723 | 1.31e-33 | 1.18e-30 | 197 |
| GO:0006364110 | Esophagus | ESCC | rRNA processing | 189/8552 | 225/18723 | 4.88e-33 | 3.87e-30 | 189 |
| GO:003466012 | Esophagus | ESCC | ncRNA metabolic process | 346/8552 | 485/18723 | 4.35e-31 | 2.51e-28 | 346 |
| GO:0042273111 | Esophagus | ESCC | ribosomal large subunit biogenesis | 65/8552 | 72/18723 | 1.53e-15 | 9.82e-14 | 65 |
| GO:000047016 | Esophagus | ESCC | maturation of LSU-rRNA | 27/8552 | 28/18723 | 9.94e-09 | 2.00e-07 | 27 |
| GO:00004603 | Esophagus | ESCC | maturation of 5.8S rRNA | 30/8552 | 35/18723 | 1.07e-06 | 1.34e-05 | 30 |
| GO:00004634 | Esophagus | ESCC | maturation of LSU-rRNA from tricistronic rRNA transcript (SSU-rRNA, 5.8S rRNA, LSU-rRNA) | 15/8552 | 15/18723 | 7.81e-06 | 7.69e-05 | 15 |
| GO:00004663 | Esophagus | ESCC | maturation of 5.8S rRNA from tricistronic rRNA transcript (SSU-rRNA, 5.8S rRNA, LSU-rRNA) | 21/8552 | 24/18723 | 2.57e-05 | 2.17e-04 | 21 |
| GO:00226137 | Liver | NAFLD | ribonucleoprotein complex biogenesis | 76/1882 | 463/18723 | 1.19e-05 | 3.67e-04 | 76 |
| GO:00422737 | Liver | NAFLD | ribosomal large subunit biogenesis | 20/1882 | 72/18723 | 1.83e-05 | 5.29e-04 | 20 |
| GO:00422547 | Liver | NAFLD | ribosome biogenesis | 52/1882 | 299/18723 | 6.03e-05 | 1.32e-03 | 52 |
| GO:00344704 | Liver | NAFLD | ncRNA processing | 57/1882 | 395/18723 | 3.34e-03 | 2.93e-02 | 57 |
| GO:00063644 | Liver | NAFLD | rRNA processing | 35/1882 | 225/18723 | 6.04e-03 | 4.54e-02 | 35 |
| Page: 1 2 |
| Pathway ID | Tissue | Disease Stage | Description | Gene Ratio | Bg Ratio | pvalue | p.adjust | qvalue | Count |
| Page: 1 |
Top |
Cell-cell communication analysis |
| Identification of potential cell-cell interactions between two cell types and their ligand-receptor pairs for different disease states |
| Ligand | Receptor | LRpair | Pathway | Tissue | Disease Stage |
| Page: 1 |
Top |
Single-cell gene regulatory network inference analysis |
| Find out the significant the regulons (TFs) and the target genes of each regulon across cell types for different disease states |
| TF | Cell Type | Tissue | Disease Stage | Target Gene | RSS | Regulon Activity |
| ∗The dot plots of a searched regulon are shown for all cell subpopulations in each disease state of each tissue based on the regulon specific score inferred using pySCENIC and by calculating the average expression. |
| Page: 1 |
Top |
Somatic mutation of malignant transformation related genes |
| Annotation of somatic variants for genes involved in malignant transformation |
| Hugo Symbol | Variant Class | Variant Classification | dbSNP RS | HGVSc | HGVSp | HGVSp Short | SWISSPROT | BIOTYPE | SIFT | PolyPhen | Tumor Sample Barcode | Tissue | Histology | Sex | Age | Stage | Therapy Types | Drugs | Outcome |
| URB1 | SNV | Missense_Mutation | novel | c.1010N>C | p.Asn337Thr | p.N337T | O60287 | protein_coding | deleterious(0) | probably_damaging(0.999) | TCGA-A2-A1G4-01 | Breast | breast invasive carcinoma | Female | >=65 | III/IV | Chemotherapy | adriamycin | SD |
| URB1 | SNV | Missense_Mutation | novel | c.4629N>T | p.Lys1543Asn | p.K1543N | O60287 | protein_coding | deleterious(0) | probably_damaging(0.983) | TCGA-AC-A5XS-01 | Breast | breast invasive carcinoma | Female | >=65 | I/II | Hormone Therapy | femara | SD |
| URB1 | SNV | Missense_Mutation | rs763947089 | c.5159N>A | p.Arg1720Gln | p.R1720Q | O60287 | protein_coding | tolerated(0.21) | benign(0.011) | TCGA-AN-A046-01 | Breast | breast invasive carcinoma | Female | >=65 | I/II | Unknown | Unknown | SD |
| URB1 | SNV | Missense_Mutation | novel | c.307N>A | p.Glu103Lys | p.E103K | O60287 | protein_coding | deleterious(0) | probably_damaging(0.999) | TCGA-AN-A046-01 | Breast | breast invasive carcinoma | Female | >=65 | I/II | Unknown | Unknown | SD |
| URB1 | SNV | Missense_Mutation | c.593N>C | p.Tyr198Ser | p.Y198S | O60287 | protein_coding | deleterious(0) | probably_damaging(0.985) | TCGA-AN-A0XN-01 | Breast | breast invasive carcinoma | Female | >=65 | III/IV | Unknown | Unknown | SD | |
| URB1 | SNV | Missense_Mutation | novel | c.1690N>A | p.Leu564Ile | p.L564I | O60287 | protein_coding | deleterious(0) | probably_damaging(0.994) | TCGA-AO-A0J5-01 | Breast | breast invasive carcinoma | Female | <65 | III/IV | Other, specify in notesBisphosphonate | zoledronic | PD |
| URB1 | SNV | Missense_Mutation | rs372120737 | c.6433G>A | p.Val2145Met | p.V2145M | O60287 | protein_coding | tolerated(0.13) | benign(0.038) | TCGA-AO-A128-01 | Breast | breast invasive carcinoma | Female | <65 | I/II | Chemotherapy | doxorubicin | SD |
| URB1 | SNV | Missense_Mutation | novel | c.1604N>T | p.Asp535Val | p.D535V | O60287 | protein_coding | deleterious(0.04) | benign(0.006) | TCGA-AR-A2LH-01 | Breast | breast invasive carcinoma | Female | <65 | III/IV | Chemotherapy | adriamycin | PD |
| URB1 | SNV | Missense_Mutation | c.1766N>G | p.Ser589Cys | p.S589C | O60287 | protein_coding | deleterious(0.02) | possibly_damaging(0.707) | TCGA-BH-A18P-01 | Breast | breast invasive carcinoma | Female | <65 | I/II | Unknown | Unknown | PD | |
| URB1 | SNV | Missense_Mutation | novel | c.1010A>C | p.Asn337Thr | p.N337T | O60287 | protein_coding | deleterious(0) | probably_damaging(0.999) | TCGA-BH-A1F5-01 | Breast | breast invasive carcinoma | Female | <65 | I/II | Unknown | Unknown | SD |
| Page: 1 2 3 4 5 6 7 8 9 10 11 12 13 |
Top |
Related drugs of malignant transformation related genes |
| Identification of chemicals and drugs interact with genes involved in malignant transfromation |
| (DGIdb 4.0) |
| Entrez ID | Symbol | Category | Interaction Types | Drug Claim Name | Drug Name | PMIDs |
| Page: 1 |

Copyright 2023-Present -The University of Texas Health Science Center at Houston |